. 2023 Feb 17;7(4):e10724.
doi: 10.1002/jbm4.10724. eCollection 2023 Apr.

Degradation-Resistant Hypoxia Inducible Factor-2α in Murine Osteocytes Promotes a High Bone Mass Phenotype

Affiliations

Degradation-Resistant Hypoxia Inducible Factor-2α in Murine Osteocytes Promotes a High Bone Mass Phenotype

Sarah V Mendoza et al. JBMR Plus. .

Abstract

Molecular oxygen levels vary during development and disease. Adaptations to decreased oxygen bioavailability (hypoxia) are mediated by hypoxia-inducible factor (HIF) transcription factors. HIFs are composed of an oxygen-dependent α subunit (HIF-α), of which there are two transcriptionally active isoforms (HIF-1α and HIF-2α), and a constitutively expressed β subunit (HIFβ). Under normoxic conditions, HIF-α is hydroxylated via prolyl hydroxylase domain (PHD) proteins and targeted for degradation via Von Hippel-Lindau (VHL). Under hypoxic conditions, hydroxylation via PHD is inhibited, allowing for HIF-α stabilization and induction of target transcriptional changes. Our previous studies showed that Vhl deletion in osteocytes (Dmp1-cre; Vhl f/f ) resulted in HIF-α stabilization and generation of a high bone mass (HBM) phenotype. The skeletal impact of HIF-1α accumulation has been well characterized; however, the unique skeletal impacts of HIF-2α remain understudied. Because osteocytes orchestrate skeletal development and homeostasis, we investigated the role of osteocytic HIF-α isoforms in driving HBM phenotypes via osteocyte-specific loss-of-function and gain-of-function HIF-1α and HIF-2α mutations in C57BL/6 female mice. Deletion of Hif1a or Hif2a in osteocytes showed no effect on skeletal microarchitecture. Constitutively stable, degradation-resistant HIF-2α (HIF-2α cDR), but not HIF-1α cDR, generated dramatic increases in bone mass, enhanced osteoclast activity, and expansion of metaphyseal marrow stromal tissue at the expense of hematopoietic tissue. Our studies reveal a novel influence of osteocytic HIF-2α in driving HBM phenotypes that can potentially be harnessed pharmacologically to improve bone mass and reduce fracture risk. © 2023 The Authors. JBMR Plus published by Wiley Periodicals LLC on behalf of American Society for Bone and Mineral Research.

Keywords: GENETIC ANIMAL MODELS; OSTEOCLAST; OSTEOCYTE.


Conflict of interest statement

All authors declare that they have no relevant or material financial interests that relate to the research described in this paper.

Figures

Fig. 1
Fig. 1
Osteocyte specific Hifa isoform deletion does not elicit a skeletal phenotype. Representative longitudinal μCT images of distal femur (A) and representative transverse images from the femoral midshaft (B) and femoral metaphysis (C). (D) Representative hematoxylin/eosin and Alcian blue staining of distal femurs. Quantitative cortical microarchitecture measurements of Ct.Ar/Tt.Ar (E) and Ct.Th (F) from the femoral mid‐diaphysis. Quantitative trabecular microarchitecture measurements of Tb.BV/TV (G) and Tb.N (H) from the distal femoral metaphysis from cre‐negative, Hif1a cKO, and Hif2a cKO mice. Bars represent mean ± SD; n = 4–7 female mice per genotype; groups with different letters are statistically different from each other. Ct.Ar/Tt.Ar = cortical bone area fraction; Ct.Th = cortical thickness; Tb.BV/TV = trabecular bone area fraction; Tb.N = trabecular number.
Fig. 2
Fig. 2
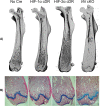
Osteocyte‐specific degradation‐resistant HIF‐2α accumulation generates an HBM phenotype. Representative 3D reconstruction images of distal femurs (A) and hematoxylin/eosin and Alcian blue staining of distal femoral epiphysis (B) of cre‐negative, HIF‐1α cDR, HIF‐2α cDR, and Vhl cKO mice.
Fig. 3
Fig. 3
Osteocyte‐specific HIF‐2α accumulation influences cortical microarchitecture. (A) Representative μCT transverse images of mid‐diaphyseal cortical microarchitecture from cre‐negative, HIF‐1α cDR, HIF‐2α cDR, and Vhl cKO femurs. Quantitative cortical microarchitecture measurements of Ct.Ar/Tt.Ar (B), Ct.TMD (C), Me.Ar (D), Ct.Th (E), and Ct.Po (F) of femoral mid‐diaphysis from cre‐negative (n = 7), HIF‐1α cDR (n = 4), HIF‐2α cDR (n = 6), and Vhl cKO (n = 3) femurs. Bars represent mean ± SD; groups with different letters are statistically different from each other. Ct.Ar/Tt.Ar = cortical bone area fraction; Ct.Po = cortical porosity; Ct.Th = cortical thickness; Ct.TMD = cortical tissue mineral density; Me.Ar = medullary area.
Fig. 4
Fig. 4
Osteocyte‐specific HIF‐2α accumulation augments trabecular microarchitecture. (A) Representative μCT transverse images of metaphyseal trabecular microarchitecture from cre‐negative, HIF‐1α cDR, HIF‐2α cDR, and Vhl cKO femurs. Quantitative trabecular microarchitecture measurements of the trabecular compartment BV/TV (B), Tb.N (C), Tb.Th (D) and Tb.Sp (E) of the distal femoral metaphysis from cre‐negative (n = 7), HIF‐1α cDR (n = 4), HIF‐2α cDR (n = 6), and Vhl cKO (n = 3) femurs. Bars represent mean ± SD; groups with different letters are statistically different from each other. BV/TV = bone volume fraction; Tb.N = trabecular number; Tb.Sp = trabecular separation; Tb.Th = trabecular thickness.
Fig. 5
Fig. 5
Osteocyte‐specific HIF‐2α accumulation drives distal trabecularization of the bone marrow compartment at the expense of hematopoietic cell lineages. Representative Safranin‐O/Fast green staining of the distal femoral epiphysis at 4× (A) and 10× (B) of cre‐negative, HIF‐1α cDR, HIF‐2α cDR, and Vhl cKO. (C) Representative hematoxylin/eosin and Alcian blue staining of bone marrow compartment of HIF‐2α cDR and Vhl cKO femurs. Arrows indicate newly embedding osteocytes in newly forming bone.
Fig. 6
Fig. 6
Osteocyte‐specific HIF‐2α accumulation increases osteoclast cell number. Representative TRAP‐staining of osteoclasts at 4× (top row) and 10× (bottom row) (A) and quantification of Oc.N/BS (B) in cre‐negative (n = 5), HIF‐1α cDR (n = 3), HIF‐2α cDR (n = 3), and Vhl cKO (n = 3) distal femoral epiphysis. Bars represent mean ± SD; groups with different letters are statistically different from each other. Oc.N/BS = osteoclast number over bone surface.

Similar articles

Cited by

References

    1. Baik AH, Jain IH. Turning the oxygen dial: balancing the highs and lows. Trends Cell Biol. 2020;30(7):516‐536. - PMC - PubMed
    1. Ledingham IM. Factors influencing oxygen availability. J Clin Pathol. 1977;s3‐11(1):1. - PMC - PubMed
    1. Dengler VL, Galbraith MD, Espinosa JM. Transcriptional regulation by hypoxia inducible factors. Crit Rev Biochem Mol. 2013;49(1):1‐15. - PMC - PubMed
    1. Kaelin WG, Ratcliffe PJ. Oxygen sensing by metazoans: the central role of the HIF hydroxylase pathway. Mol Cell. 2008;30(4):393‐402. - PubMed
    1. Semenza GL. Hypoxia‐inducible factors in physiology and medicine. Cell. 2012;148(3):399‐408. - PMC - PubMed

LinkOut - more resources