

A holistic model for melt electrowritten three-dimensional structured materials based on residual charge
- PMID: 37065672
- PMCID: PMC10090534
- DOI: 10.18063/ijb.v9i2.656
A holistic model for melt electrowritten three-dimensional structured materials based on residual charge
Abstract
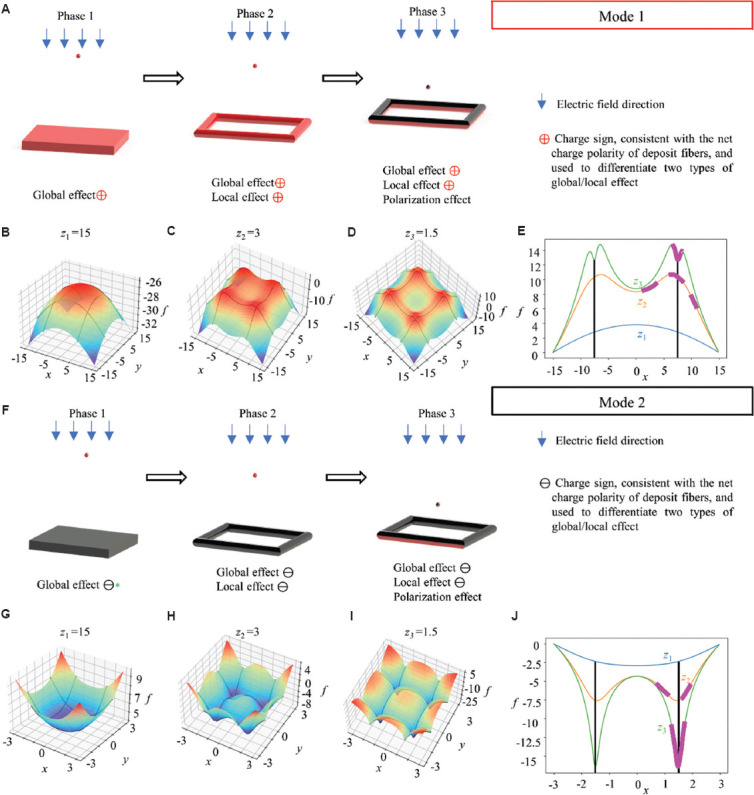
The printing accuracy of polymer melt electrowriting is adversely affected by the residual charge entrapped within the fibers, especially for three-dimensional (3D) structured materials or multilayered scaffolds with small interfiber distances. To clarify this effect, an analytical charge-based model is proposed herein. The electric potential energy of the jet segment is calculated considering the amount and distribution of the residual charge in the jet segment and the deposited fibers. As the jet deposition proceeds, the energy surface assumes different patterns, which constitute different modes of evolution. The manner in which the various identified parameters affect the mode of evolution are represented by three charge effects, including the global, local, and polarization effect. Based on these representations, typical modes of energy surface evolution are identified. Moreover, the lateral characteristic curve and characteristic surface are advanced to analyze the complex interplay between fiber morphologies and residual charge. Different parameters contribute to this interplay either by affecting residual charge, fiber morphologies, or the three charge effects. To validate this model, the effects of lateral location and grid number (i.e., number of fibers printed in each direction) on the fiber morphologies are investigated. Moreover, the "fiber bridging" phenomenon in parallel fiber printing is successfully explained. These results help to comprehensively understand the complex interplay between the fiber morphologies and the residual charge, thus furnishing a systematic workflow to improve printing accuracy.
Keywords: Charge polarization; Energy analysis; Fiber morphologies; Melt electrohydrodynamic printing; Residual charge.
Copyright: © 2022 Author(s).
Conflict of interest statement
The authors declare that they have no competing interests.
Figures


 is not a function of y,
  and is not a function of x in Equation VI; the energy surface can be generated by translating Curve A along the path defined by Curve B or vice versa. Curve B is defined as the lateral characteristic curve, which is shown in (B). Curve C and D are also shown in (B) when z is toggled at 30 and 1.1, respectively. The dash-dotted line denotes the prescribed locations. When z is continuously varied, lateral characteristic curves continuously evolve, and form a characteristic surface as shown in (C).
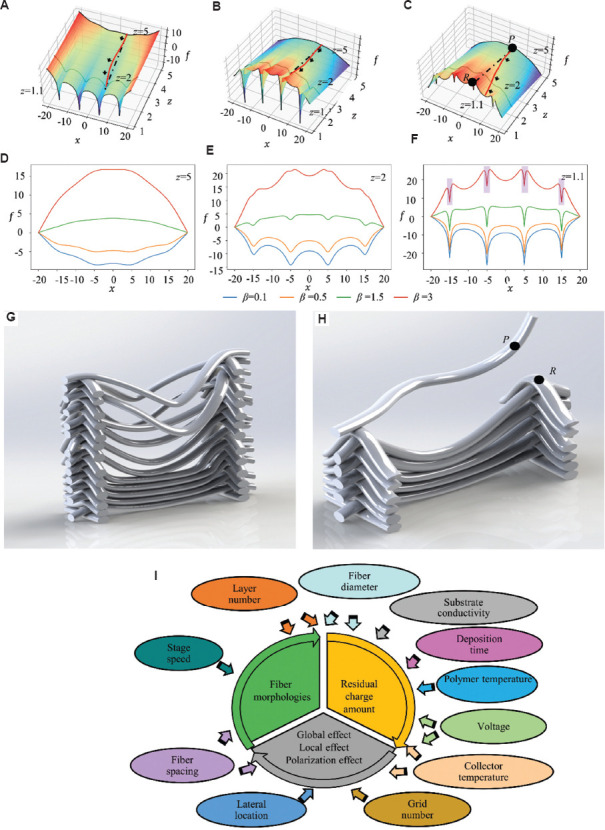


Similar articles
-
Controlling Topography and Crystallinity of Melt Electrowritten Poly(ɛ-Caprolactone) Fibers.3D Print Addit Manuf. 2021 Oct 1;8(5):315-321. doi: 10.1089/3dp.2020.0290. Epub 2021 Oct 8. 3D Print Addit Manuf. 2021. PMID: 36654937 Free PMC article.
-
A Microscale 3D Printing Based on the Electric-Field-Driven Jet.3D Print Addit Manuf. 2020 Feb 1;7(1):37-44. doi: 10.1089/3dp.2018.0154. Epub 2020 Feb 13. 3D Print Addit Manuf. 2020. PMID: 36654877 Free PMC article.
-
Suture Fiber Reinforcement of a 3D Printed Gelatin Scaffold for Its Potential Application in Soft Tissue Engineering.Int J Mol Sci. 2021 Oct 27;22(21):11600. doi: 10.3390/ijms222111600. Int J Mol Sci. 2021. PMID: 34769034 Free PMC article.
-
Electrohydrodynamic jet 3D printing in biomedical applications.Acta Biomater. 2021 Jul 1;128:21-41. doi: 10.1016/j.actbio.2021.04.036. Epub 2021 Apr 24. Acta Biomater. 2021. PMID: 33905945 Review.
-
3D-Printed Fiber-Reinforced Polymer Composites by Fused Deposition Modelling (FDM): Fiber Length and Fiber Implementation Techniques.Polymers (Basel). 2022 Nov 1;14(21):4659. doi: 10.3390/polym14214659. Polymers (Basel). 2022. PMID: 36365656 Free PMC article. Review.
References
-
- Daghrery A, de Souza Araújo IJ, Castilho M, et al. Unveiling the potential of melt electrowriting in regenerative dental medicine. Acta Biomater. 2022;20 https://doi.org/10.1016/j.actbio.2022.01.01. - PMC - PubMed
-
- Li X, Liu B, Pei B, et al. Inkjet bioprinting of biomaterials. Chem Rev. 2020;120:10793–10833. https://doi.org/10.1021/acs.chemrev.0c00008. - PubMed
-
- Jiang T, Munguia-Lopez JG, Flores-Torres S, et al. Extrusion bioprinting of soft materials:An emerging technique for biological model fabrication. Appl Phys Rev. 2019;6:011310. https://doi.org/10.1063/1.5059393.
-
- Ng WL, Lee JM, Zhou M, et al. Vat polymerization-based bioprinting-process, materials, applications and regulatory challenges. Biofabrication. 2019;12:022011. - PubMed
-
- Saidy NT, Wolf F, Bas O, et al. biologically inspired scaffolds for heart valve tissue engineering via melt electrowriting. Small. 2019;15:1–15. https://doi.org/10.1002/smll.201900873. - PubMed
LinkOut - more resources
Full Text Sources
Research Materials