. 2023 Apr 3:7:267.
doi: 10.12688/wellcomeopenres.17261.2. eCollection 2022.

Defective iron homeostasis and hematological abnormalities in Niemann-Pick disease type C1

Affiliations

Defective iron homeostasis and hematological abnormalities in Niemann-Pick disease type C1

Oscar C W Chen et al. Wellcome Open Res. .

Abstract

Background: Niemann-Pick disease type C1 (NPC1) is a neurodegenerative lysosomal storage disorder characterized by the accumulation of multiple lipids in the late endosome/lysosomal system and reduced acidic store calcium. The lysosomal system regulates key aspects of iron homeostasis, which prompted us to investigate whether there are hematological abnormalities and iron metabolism defects in NPC1. Methods: Iron-related hematological parameters, systemic and tissue metal ion and relevant hormonal and proteins levels, expression of specific pro-inflammatory mediators and erythrophagocytosis were evaluated in an authentic mouse model and in a large cohort of NPC patients. Results: Significant changes in mean corpuscular volume and corpuscular hemoglobin were detected in Npc1 -/- mice from an early age. Hematocrit, red cell distribution width and hemoglobin changes were observed in late-stage disease animals. Systemic iron deficiency, increased circulating hepcidin, decreased ferritin and abnormal pro-inflammatory cytokine levels were also found. Furthermore, there is evidence of defective erythrophagocytosis in Npc1 -/- mice and in an in vitro NPC1 cellular model. Comparable hematological changes, including low normal serum iron and transferrin saturation and low cerebrospinal fluid ferritin were confirmed in NPC1 patients. Conclusions: These data suggest loss of iron homeostasis and hematological abnormalities in NPC1 may contribute to the pathophysiology of this disease.

Keywords: Niemann-Pick disease type C; haematology; iron; lysosomal storage diseases; lysosome.


Conflict of interest statement

Competing interests: F.M.P. is a consultant to and co-founder of Intrabio. Other authors declare no competing interests.

Figures

Figure 1.
Figure 1.. Altered erythrocytic indices and erythrocyte morphology in Npc1 -/- mice.
A. Histograms showing significantly lower mean corpuscular volume ( i) and mean corpuscular hemoglobin ( ii) in five-week, seven-week, nine-week and eleven-week-old Npc1 -/- mice. B. Histograms representing reduced hematocrit ( i), increased red cell distribution width ( ii) and decreased hemoglobin ( iii) in eleven-week Npc1 -/- mice. Data shown are mean ± SEM, n=7–20 mice per group. * p < 0.05 ** p < 0.01*** p < 0.001, **** p < 0.0001. 1-way ANOVA with Tukey’s. C. Wright-Giemsa stain of peripheral blood smears from nine-week-old male and female Npc1 +/+ and Npc1 -/- mice. Arrowheads indicate examples of erythrocytes with altered morphology. Scale bar represents 10 μm. Images of blood smears were taken on Zeiss Axioplan 2 microscope and captured using Axiovision 2.0 software. Data are representative of three independent experiments.
Figure 2.
Figure 2.. Decreased systemic iron, increased serum sTfrc, transiently reduced hepatic iron and lower L-ferritin and enhanced tfrc and fpn expression in Npc1 -/- mice.
Serum iron levels are significantly lower in nine-week-old Npc1 -/- mice than in age-matched control animals ( i) whereas serum sTfrc are enhanced. Iron data are mean ± SEM, * p < 0.05, ** p < 0.01 n=8 per group, unpaired t test with Welch’s correction. Data are representative of two independent experiments. Western blot of serum protein samples, ( ii) quantification of specific protein bands. Data are mean ± SEM, ** p < 0.01 n=4 per group, unpaired t test with Welch’s correction. ( iii). B. Hepatic iron is significantly reduced in seven-week-old Npc1 -/- mice (filled circles) but not different from controls (filled triangles) at three and eleven weeks of age. Data are mean ± SEM, **** p < 0.0001 n= 5–8 per group, 2-way ANOVA ( i). C. Reduced ferritin content of liver and spleen in nine-week-old Npc1 -/- mice. Western blot of liver and spleen lysates ( i) quantification of specific bands ( ii) Data are mean ± SEM, ** p < 0.01 **** p < 0.0001 n=2–4 per group, unpaired t test with Welch’s correction. Data are representative of two independent experiments. Arrowheads indicate molecular mass of specific proteins. D. Increased hepatic Tfrc ( i) and duodenal fpn ( ii) transcripts in symptomatic Npc1 -/- mice (filled columns) as compared to Npc1 +/+ mice (open columns). Data are mean ± SEM, * p < 0.05 *** p < 0.001n=8 per group. Data are representative of three independent experiments.
Figure 3.
Figure 3.. Significantly increased systemic hepcidin and hepatic pro-inflammatory cytokines in Npc1 -/- mice.
A. Male and female Npc1 -/- mice (filled circles) have higher systemic hepcidin at seven weeks of age (left panel) and nine weeks of age (right panel) than Npc1 +/+ mice (filled triangles). Data shown mean ± SEM, * p < 0.05, ** p < 0.01 *** p < 0.001 **** p < 0.0001 n=5 per group. 2-way ANOVA. B. Q-PCR data confirming ( i) increased hepatic TNFα transcripts, ( ii) unchanged IL-1β and ( iii) enhanced IL-1α in five and eight-week-old Npc1 -/- mice (filled columns) relative to Npc1 +/+ animals (open columns). Data are mean ± SEM, ** p < 0.01 *** p < 0.001 n=5 per group. unpaired t test with Welch’s correction. Data representative of two independent experiments.
Figure 4.
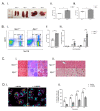
Figure 4.. Hepatosplenomegaly, altered erythropoiesis, perturbed splenic architecture and evidence of impaired erythrophagocytosis in Npc1 -/- mice.
A. Npc1 -/- mice display increased spleen and liver mass. (i). Representative images of spleen and liver from nine-week-old Npc1 -/- and Npc1 +/+ mice. Histograms of spleen (ii) and (iii) liver masses from Npc1 +/+ (open columns) and Npc1 -/- animals (filled columns). Data are mean± SEM, ** p < 0.01 *** p < 0.001 n=5. unpaired t test with Welch’s correction. B. Perturbed erythropoiesis in Npc1 -/- mice. (i) Representative FACS profiles of splenic cells from nine-week-old Npc1 +/+ (left panel) and Npc1 -/- mice (right panel) stained with anti-CD71 and anti-Ter119 specific antibodies. Gates indicate position of I, proerythroblasts; II, basophilic; III, polychromatic and IV orthochromatic populations. (ii) Quantification of Ter119 + cell frequencies. Mean± SEM *** p < 0.001 n=4–8 per group. unpaired t test with Welch’s correction (iii) frequencies of sub-populations I-IV. ** p < 0.01 **** p < 0.0001 n=7–9 per group. unpaired t test with Welch’s correction. Data are representative of three independent experiments. C. Altered splenic architecture and presence of foamy macrophages and nearby erythrocytes in livers from nine-week-old Npc1 -/- mice. (i) Representative images of Masson trichrome stained spleen sections from nine-week-old Npc1 +/+ (panels a-c) and Npc1 -/- (panels d-f) mice. Scale bar: panels a and d, 250 μm; b and e, 100 μm; c and f, 25 μm. (ii). Hematoxylin/eosin-stained liver sections from nine-week-old Npc1 +/+ (panels a–c) and Npc1 -/- mice (panels d–f). Arrowheads indicate examples of macrophages with foamy appearance; arrows indicate erythrocytes in close proximity to foamy macrophages. Scale bar; panels a and d, 50 μm; b, c, e, and f, 25 μm. Images were captured with a Zeiss Axioplan 2 microscope using Axiovision 2.0 software. D. Impaired in vitro phagocytosis of oxidized sheep erythrocytes by U18666A-treated RAW 264.7 macrophages. (i) Representative confocal microscopy images of vehicle-treated (left panel) and U18666A-treated RAW 264.7 macrophages (right panel) that have been co-incubated with oxidized sheep red blood cells. Arrows indicate examples of internalized erythrocytes (green). Cyan represents actin staining. Scale bar; 20 μm. Cells were imaged on a Leica TCS SP8 confocal microscope with LAS X software (ii). Frequencies of oxidized sheep erythrocytes internalized by vehicle-treated (open columns) and U18666A-treated (filled columns) RAW 264.7 macrophages. Mean ± SEM, n=minimum of 3 x 100 cells counted for each treatment. Data is representative of three independent experiments. * p < 0.05, *** p < 0.001, **** p < 0.0001. unpaired t test with Welch’s correction.
Figure 5.
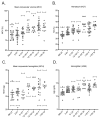
Figure 5.. NPC patients have hematological parameters that cluster at the low end of the normal range.
Plots of patient values: A. Mean corpuscular volume, B. hematocrit, C. corpuscular hemoglobin and D. hemoglobin. Data are mean ± SEM, n=19 (six months – two years); 25 (2–6 years); 21 (6–12 years); 11 (12–18 years females); 8 (12–18 years males); 21 (>18 years females); 9 (> 18 years males). Dashed lines indicate values at the limits of the normal range , .
Figure 6.
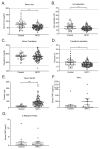
Figure 6.. NPC1 patients have significantly lower serum iron, iron and transferrin saturation, but increased ferritin levels.
Plots of patient A. serum iron, B. iron saturation, C. serum transferrin, D. transferrin saturation, E. serum ferritin F. systemic TNFα and G. systemic C-reactive protein. Mean ± SEM, * p < 0.05,** p < 0.01 *** p < 0.001 unpaired t test with Welch’s correction For serum iron, n=105 for NPC1 patients, 39 for controls; iron saturation, n=104 for NPC1, n=38 for controls; serum transferrin, n=104 for NPC1, 39 for controls; transferrin saturation, n=39 for control group, 105 for NPC1 patients; serum ferritin, n=20 for control and 100 for NPC1, serum TNF-α n=11 for control and 20 for NPC1 and for C-reactive protein, n=15 for control group (mean age 12.7 ± 5.8 years), 18 for NPC1 patients (mean age 11.6 ± 7.9 years. Dashed lines indicate values at the limits of the normal range of the various parameters , .
Figure 7.
Figure 7.. Ferritin deficiency and increased transferrin in the CSF of NPC1 patients.
Plots of A. CSF ferritin and B. CSF transferrin levels in control and NPC1 patients. Mean ± SEM, * p < 0.05, ** p < 0.01. unpaired t test with Welch’s correction. n=5 for ferritin determinations, n=30, n=58 for control and NPC1 patients for transferrin determinations.

References

    1. Muckenthaler MU, Rivella S, Hentze MW, et al. : A Red Carpet for Iron Metabolism. Cell. 2017;168(3):344–361. 10.1016/j.cell.2016.12.034 - DOI - PMC - PubMed
    1. De Domenico I, McVey Ward D, Kaplan J: Regulation of iron acquisition and storage: consequences for iron-linked disorders. Nat Rev Mol Cell Biol. 2008;9(1):72–81. 10.1038/nrm2295 - DOI - PubMed
    1. Hentze MW, Muckenthaler MU, Galy B, et al. : Two to tango: regulation of Mammalian iron metabolism. Cell. 2010;142(1):24–38. 10.1016/j.cell.2010.06.028 - DOI - PubMed
    1. Saftig P, Klumperman J: Lysosome biogenesis and lysosomal membrane proteins: trafficking meets function. Nat Rev Mol Cell Biol. 2009;10(9):623–635. 10.1038/nrm2745 - DOI - PubMed
    1. Mancias JD, Wang X, Gygi SP, et al. : Quantitative proteomics identifies NCOA4 as the cargo receptor mediating ferritinophagy. Nature. 2014;509(7498):105–109. 10.1038/nature13148 - DOI - PMC - PubMed

LinkOut - more resources