. 2023 Mar 30:14:1129930.
doi: 10.3389/fendo.2023.1129930. eCollection 2023.

Osteocalcin modulates parathyroid cell function in human parathyroid tumors

Affiliations

Osteocalcin modulates parathyroid cell function in human parathyroid tumors

Chiara Verdelli et al. Front Endocrinol (Lausanne). .

Abstract

Introduction: The bone matrix protein osteocalcin (OC), secreted by osteoblasts, displays endocrine effects. We tested the hypothesis that OC modulates parathyroid tumor cell function.

Methods: Primary cell cultures derived from parathyroid adenomas (PAds) and HEK293 cells transiently transfected with the putative OC receptor GPRC6A or the calcium sensing receptor (CASR) were used as experimental models to investigate γ-carboxylated OC (GlaOC) or uncarboxylated OC (GluOC) modulation of intracellular signaling.

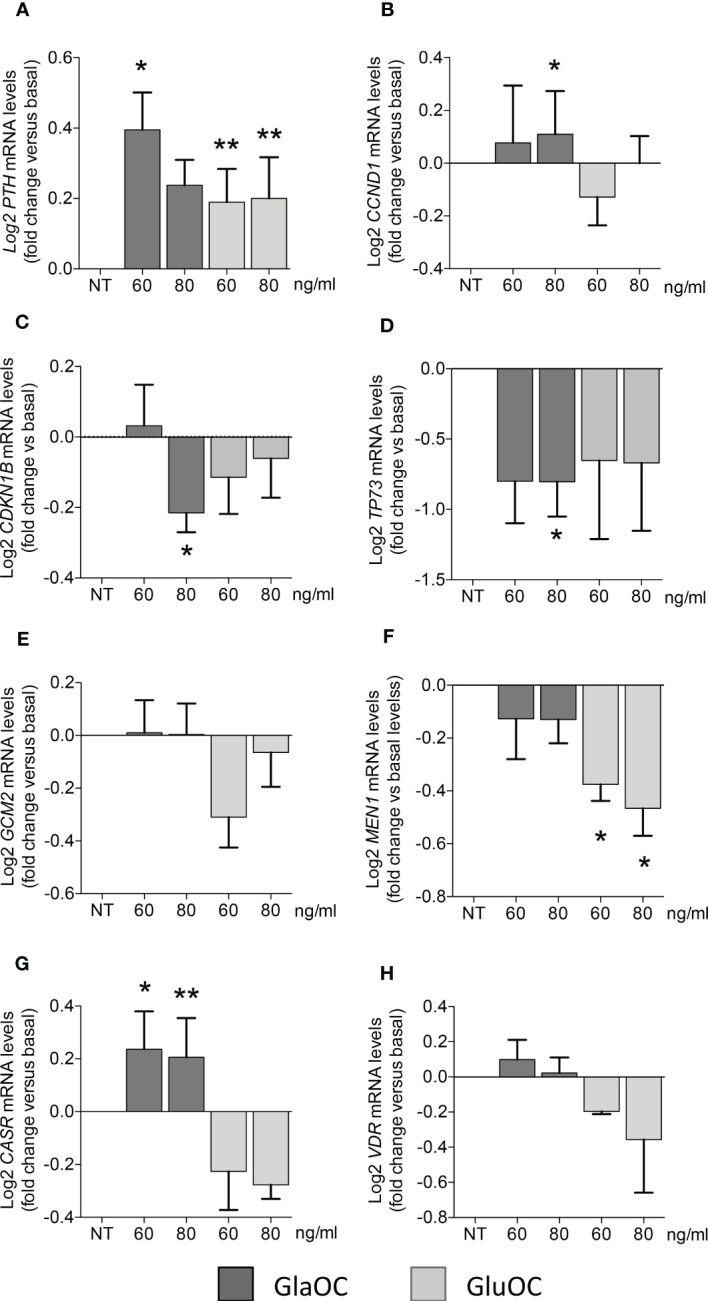
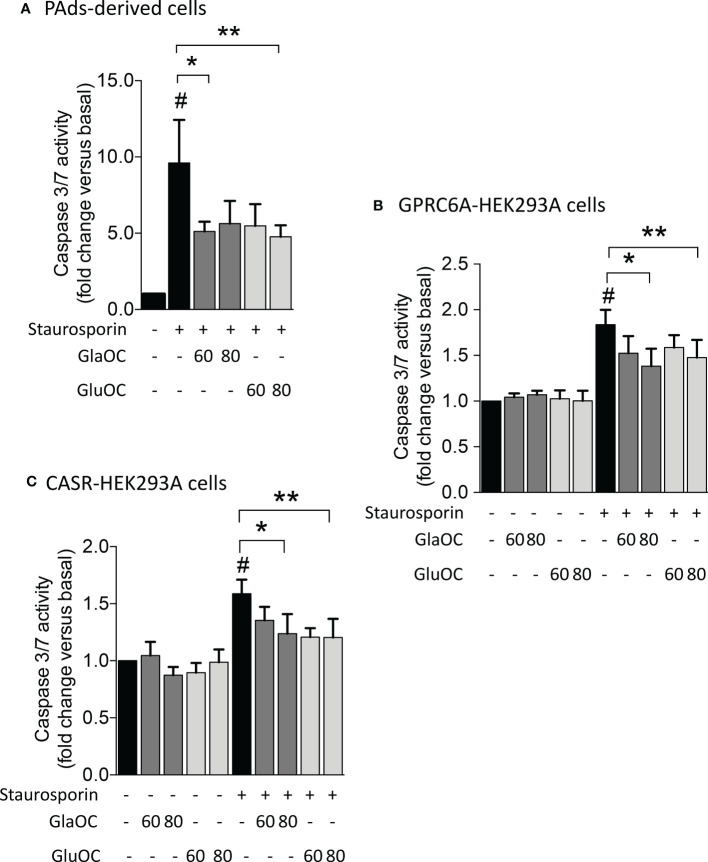
Results: In primary cell cultures derived from PAds, incubation with GlaOC or GluOC modulated intracellular signaling, inhibiting pERK/ERK and increasing active β-catenin levels. GlaOC increased the expression of PTH, CCND1 and CASR, and reduced CDKN1B/p27 and TP73. GluOC stimulated transcription of PTH, and inhibited MEN1 expression. Moreover, GlaOC and GluOC reduced staurosporin-induced caspase 3/7 activity. The putative OC receptor GPRC6A was detected in normal and tumor parathyroids at membrane or cytoplasmic level in cells scattered throughout the parenchyma. In PAds, the membrane expression levels of GPRC6A and its closest homolog CASR positively correlated; GPRC6A protein levels positively correlated with circulating ionized and total calcium, and PTH levels of the patients harboring the analyzed PAds. Using HEK293A transiently transfected with either GPRC6A or CASR, and PAds-derived cells silenced for CASR, we showed that GlaOC and GluOC modulated pERK/ERK and active β-catenin mainly through CASR activation.

Conclusion: Parathyroid gland emerges as a novel target of the bone secreted hormone osteocalcin, which may modulate tumor parathyroid CASR sensitivity and parathyroid cell apoptosis.

Keywords: CASR; ERK; GPRC6A; beta-catenin; osteocalcin; parathyroid tumor.


Conflict of interest statement

The authors declare that the research was conducted in the absence of any commercial or financial relationships that could be construed as a potential conflict of interest.

Figures

Figure 1
Figure 1
Effects of the GlaOC and GluOC stimulation on intracellular signaling pathways in human parathyroid cells. PAds-derived cells were incubated for 10 minutes with increasing concentrations of GlaOC (dark grey columns; 60-80 ng/mL) and GluOC (light grey columns; 60-80 ng/mL) (n=4). A representative western blot is shown for each experimental condition and data are expressed as mean ± SEM. (A) GlaOC and GluOC effects on basal pERK/ERK levels (*, P=0.019; **, P=0.004). (B) GlaOC and GluOC effects on basal pAKT/AKT levels. (C) GlaOC and GluOC effects on basal active β-catenin levels (*, P=0.048; **, P=0.042). VINC, vinculin was used as loading control.
Figure 2
Figure 2
Effects of GlaOC and GluOC stimulation on the expression of specific genes in PAds-derived cells. PAds-derived cells were incubated for 6 hours with increasing concentrations (60-80 ng/mL) of GlaOC (dark grey columns) and GluOC (light grey columns). Data were expressed as fold change versus levels in non treated conditions (NT) and presented as mean ± SEM. GlaOC and GluOC modulated the expression of (A) PTH mRNA levels (*, P=0.015; **, P=0.008), (B) CCND1 transcripts (*, P=0.002), (C) CDKN1B mRNA levels (*, P=0.041), and (D) TP73 mRNA levels (*, P=0.042). Effects of GlaOC and GluOC on parathyroid specific transcription factors (E) GCM2 mRNA levels, (F) MEN1 mRNA levels (*, P=0.0001), and on (G) the receptors CASR (*, P=0.002; **, P=0.014) and (H) VDR mRNA levels are shown.
Figure 3
Figure 3
GPCR6A expression in human parathyroid cells. (A) GPRC6A transcripts were variably detected by RT-PCR in total RNA from PAds (n=7) of PHPT patients; C+, plasmid encoding GPRC6A; C-, water. (B) Immunofluorescence of short-term cultured PAds-derived cells showed cytoplasmic and membrane expression of GPRC6A (red, b, f); PTH (green, c) co-expressed with GPRC6A (merge, d) GCM2 (green, g) co-expressed with GPRC6A (merge, h). (C) Immunohistochemistry by a specific anti-GPRC6A antibody in normal parathyroid glands from normocalcemic patients with thyroid diseases (a, b) and in parathyroid adenomas (panels c–f). (g) Human testis with GPRC6A-expressing Leydig cells were used as positive control. Insert in (d) shows cells with GPRC6A expression at membrane level. Magnification 20X; bars, 200 μm.
Figure 4
Figure 4
GPRC6A and CASR expression in membrane protein fractions from PAds and correlation with clinical features. (A) Western blot analysis of GPRC6A and CASR expression in membrane protein fractions from a series of PAds (n=15); GPRC6A specific band was detected at 105 kDa; specific CASR bands were detected at 130 and 150 kDa; Na+/K+ ATPAse was used as loading control. (B) Correlation between GPRC6A and CASR membrane proteins in the PAds series (r=0.618, P=0.014 by Spearman coefficient of correlation). (C) Correlation between GPRC6A/CASR ratio and plasma ionized calcium levels, expressed as log2 (r=0.552, P=0.033 by Pearson coefficient of correlation). (D) Correlation between GPRC6A/CASR ratio and serum total calcium levels, expressed as log2 (r=0.602, P=0.018 by Pearson coefficient of correlation). (E) Correlation between GPRC6A/CASR ratio and plasma PTH levels, expressed as log2 (r=0.539, P=0.038 by Pearson coefficient of correlation).
Figure 5
Figure 5
Effects of the treatment with GlaOC or GluOC in HEK293A cells transfected with GPCR6A and with CASR. HEK293A cells transiently transfected with GPRC6A (GPRC6A-HEK293A) or CASR (CASR-HEK293A) were incubated for 10 minutes with increasing concentrations (20, 40, 60, 80 ng/mL) of GlaOC (dark grey columns) and GluOC (light grey columns). Data were log2 transformed and presented as mean±SEM. (A, B) Effects of increasing concentrations of GlaOC and GluOC on pERK/ERK levels (*, P=0.006 and P=0.05, respectively) in GPRC6A-HEK293A cells. (C) Representative western blot. (D, E) Effects of increasing concentrations of GlaOC and GluOC on active β-catenin levels (*, P=0.025) in GPRC6A-HEK293A cells and representative western blot (F). (G, H) Effects of increasing concentrations of GlaOC and GluOC on pERK/ERK levels (*, P=0.023 and P=0.048, respectively) in CASR-HEK293A cells and representative western blot (I). (J, K) Effects of increasing concentrations of GlaOC and GluOC on β-catenin levels in CASR-HEK293A cells and representative western blot (L).
Figure 6
Figure 6
Effect of CASR silencing on the GlaOC/GluOC-activated signaling in PAds-derived cells. (A) Effect of the CASR silencing on CASR protein expression (**, P=0.0043). (B) Effect of the CASR silencing on GPRC6A protein levels; expression levels are presented as fold changes versus untreated conditions incubated with control siRNA, and log2 transformed. (C) Effects of GlaOC (dark grey columns) and GluOC (light grey columns) stimulation in PAds-derived cell preparations treated with control siRNA and with CASR siRNA on pERK/ERK levels (*, P<0.05). (D) Effects of GlaOC (dark grey columns) and GluOC (light grey columns) stimulation in PAds-derived cell preparations treated with control siRNA and with CASR siRNA on active β-catenin levels (*, P<0.05). Densitometric data were log2 transformed and presented as mean±SEM. A representative western blot is shown for each experimental condition.
Figure 7
Figure 7
Effects of GlaOC and GluOC stimulation on staurosporin-induced apoptosis. (A) Effects of 60-80 ng/mL GlaOC (dark grey columns) and GluOC (light grey columns) on staurosporin-induced apoptosis in PAds-derived cells (#, P=0.022 versus basal levels; *, P=0.050 vs staurosporin treated cells; **, P=0.045 vs staurosporin treated cells). (B) Effects of 60-80 ng/mL GlaOC and GluOC on staurosporin-induced apoptosis in GPRC6A-HEK293A cells (#, P=0.036 vs basal levels; *, P=0.013 vs staurosporin treated cells; **, P=0.087 vs staurosporin treated cells). (C) Effects of 60-80 ng/mL GlaOC and GluOC on staurosporin-induced apoptosis in CASR-HEK293A cells (#, P=0.042 vs basal levels; *, P=0.010 vs staurosporin treated cells; **, P=0.040 versus staurosporin treated cells).
Figure 8
Figure 8
Schematic representation of osteocalcin effects on parathyroid tumor cell signaling pathways. GlaOC and GluOC, activating GPRC6A and CASR, modulate parathyroid gene expression and partially prevent apoptosis. GlaOC also reduces ERK phosphorylation and increases β-catenin mainly acting through CASR. Part of this figure was created using images from Servier Medical Art, licensed under a Creative Commons Attribution 3.0 Unported License (https://smart.servier.com).

Similar articles

Cited by

References

    1. Bandeira L, Bilezikian J. Primary hyperparathyroidism. F1000Res (2016) 5:F1000. doi: 10.12688/f1000research.7039.1 - DOI - PMC - PubMed
    1. Makras P, Anastasilakis AD. Bone disease in primary hyperparathyroidism. Metabolism (2018) 80:57–65. doi: 10.1016/j.metabol.2017.10.003 - DOI - PubMed
    1. Ferron M, Lacombe J, Germain A, Oury F, Karsenty G. GGCX and VKORC1 inhibit osteocalcin endocrine functions. J Cell Biol (2015) 208(6):761–76. doi: 10.1083/jcb.201409111 - DOI - PMC - PubMed
    1. Diaz−Franco MC, Franco−Diaz de Leon R, Villafan−Bernal JR. Osteocalcin−GPRC6A: An update of its clinical and biological multi−organic interactions (Review). Mol Med Rep (2019) 19(1):15–22. doi: 10.3892/mmr.2018.9627 - DOI - PMC - PubMed
    1. Cristiani A, Maset F, Toni LD, Guidolin D, Sabbadin D, Strapazzon G, et al. . Carboxylation-dependent conformational changes of human osteocalcin. Front Biosci(Lendmark Ed) (2014) 19(7):1105–16. doi: 10.2741/4270 - DOI - PubMed

Publication types