. 2023 Mar 29:14:1093332.
doi: 10.3389/fendo.2023.1093332. eCollection 2023.

ZBTB7A as a novel vulnerability in neuroendocrine prostate cancer

Affiliations

ZBTB7A as a novel vulnerability in neuroendocrine prostate cancer

Song Yi Bae et al. Front Endocrinol (Lausanne). .

Abstract

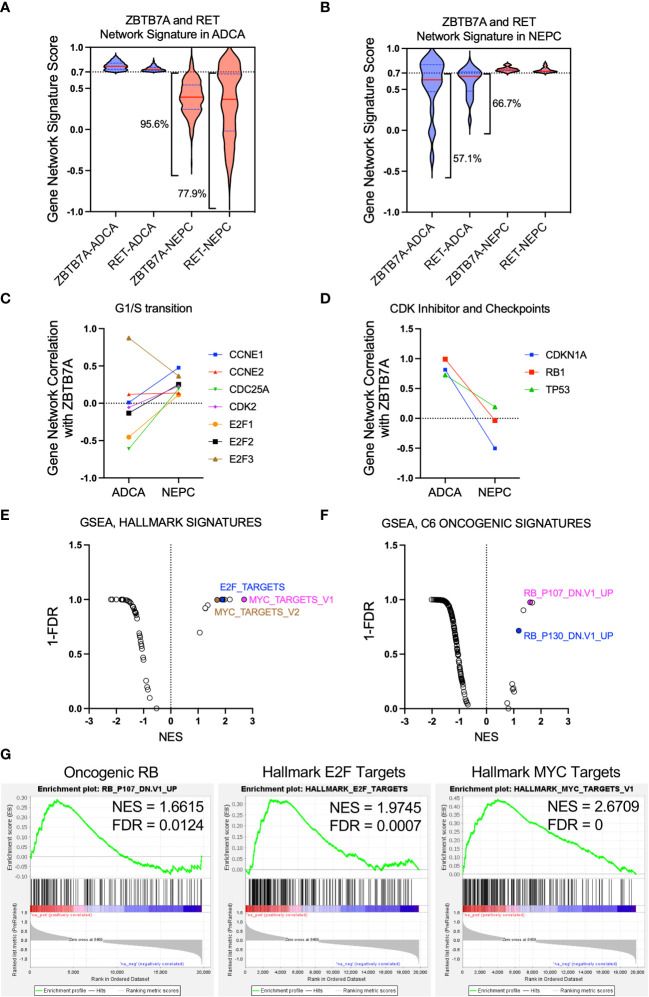
Neuroendocrine prostate cancer (NEPC) is a highly aggressive subtype of prostate cancer. NEPC is characterized by the loss of androgen receptor (AR) signaling and transdifferentiation toward small-cell neuroendocrine (SCN) phenotypes, which results in resistance to AR-targeted therapy. NEPC resembles other SCN carcinomas clinically, histologically and in gene expression. Here, we leveraged SCN phenotype scores of various cancer cell lines and gene depletion screens from the Cancer Dependency Map (DepMap) to identify vulnerabilities in NEPC. We discovered ZBTB7A, a transcription factor, as a candidate promoting the progression of NEPC. Cancer cells with high SCN phenotype scores showed a strong dependency on RET kinase activity with a high correlation between RET and ZBTB7A dependencies in these cells. Utilizing informatic modeling of whole transcriptome sequencing data from patient samples, we identified distinct gene networking patterns of ZBTB7A in NEPC versus prostate adenocarcinoma. Specifically, we observed a robust association of ZBTB7A with genes promoting cell cycle progression, including apoptosis regulating genes. Silencing ZBTB7A in a NEPC cell line confirmed the dependency on ZBTB7A for cell growth via suppression of the G1/S transition in the cell cycle and induction of apoptosis. Collectively, our results highlight the oncogenic function of ZBTB7A in NEPC and emphasize the value of ZBTB7A as a promising therapeutic strategy for targeting NEPC tumors.

Keywords: RET receptor tyrosine kinase; ZBTB7A; cancer dependency map (DepMap); castration-resistant prostate cancer (CRPC); cell cycle; gene network; neuroendocrine prostate cancer (NEPC); small-cell neuroendocrine (SCN).


Conflict of interest statement

EC is consultant of Dotquant and received research funding via institutional SRAs from AbbVie, Janssen Research, Gilead, Zenith Epigenetics, Bayer, GSK, Astra Zeneca, Kronos, Foghorn, MacroGenics, and Forma Pharmaceuticals. JMD has no conflicts relevant to this work. However, he holds equity in and serves as Chief Scientific Officer of Astrin Biosciences. This interest has been reviewed and managed by the University of Minnesota in accordance with its Conflict of Interest policies. None of these companies contributed to or directed any of the research reported in this article. The remaining authors declare that the research was conducted in the absence of any commercial or financial relationships that could be construed as a potential conflict of interest.

Figures

Figure 1
Figure 1
Functional co-dependency analyses identified small-cell neuroendocrine cancer cell lines to be dependent on RET and ZBTB7A. (A) Comparison of RET mRNA expression between cancer cell lines with SCN score ≥ 1.1 (SCN HI) and SCN score< 1.1 (SCN LO). RET mRNA expression values were obtained from Cancer Cell Line Encyclopedia Cancer. ****p<0.0001 by Mann-Whitney test. (B) Comparison of relative RET dependency scores (DEMETER2) between SCN HI and SCN LO cell lines. DEMETER2 scores taken from DepMap (DEMETER2 Data v6) reflect the impact of shRNA mediated RET knockdown on cell proliferation and the lower score indicates greater dependency on RET. **p<0.01 by Mann-Whitney test. (C, D) RET DEMETER2 scores of SCN HI (C) and SCN LO (D) cell lines were plotted against ZBTB7A DEMETER2 scores. (E, F) RET CERES scores of SCN HI (E) and SCN LO (F) were plotted against ZBTB7A CERES scores. CERES scores (DepMap Public 20Q4 v2) indicate the relative effect of gene perturbation by CRISPR/Cas9 on cell proliferation. (C-F) Each dot represents a cell line and the linear regression lines are in red.
Figure 2
Figure 2
Gene network correlation analysis revealed distinct gene network associations with ZBTB7A in NEPC versus prostate adenocarcinoma. (A, B) Gene network signature from both ZBTB7A and RET in ADCA (A) or NEPC (B) was assessed in the other state and depicted using violin plots (see Methods). Gene network signature in each CRPC state was generated from the gene networks with correlation coefficients above 0.7 for both ZBTB7A and RET. The broad violin plots indicate the dissimilarity of correlation coefficients for a gene network signature. The percentages of gene network signatures below 0.7 are indicated on the plots. (C) Gene network correlation of genes related to G1/S transition with ZBTB7A in ADCA and NEPC. (D) Gene network correlation of CDK negative regulator (CDKN1A) and checkpoint (RB1, TP53) genes with ZBTB7A in ADCA and NEPC. (E, F) GSEA analysis of ZBTB7A gene profiles based on NEPC and ADCA tumors from Beltran et al., 2016 (see Methods). Each dot represents a gene signature. Among the signatures enriched in ZBTB7A gene profile of NEPC, the cell cycle progression related ones are labeled. For the full list of signatures, see Supplementary Table 4 (G) Individual enrichment profiles are shown.
Figure 3
Figure 3
ZBTB7A knockdown reduced cell proliferation of NCI-H660 cells by blocking progression through the cell cycle. (A) ZBTB7A and RET protein expression in NCI-H660 cells stably transduced with scrambled (Scr) or two anti-ZBTB7A shRNAs. β-actin was used as a loading control. (B) Proliferation of stably transduced cells was measured every 7 days for 3 weeks via WST assay. Data are representative of three biological replicates. Error bars represent the SD of six technical replicates. Significance on Day 21 was assessed using one-way ANOVA. ****p<0.0001. (C) Representative images of each cell line in B at Day 21. Area of 90 cell clusters for each cell line (15 cell clusters/technical replicate, n = 6) were measured using Zen lite software and shown as a scatter plot with median and interquartile range. ****p<0.0001 by Kruskal-Wallis test. (D) Cell cycle analysis in NCI-H660 shScr and ZBTB7A knockdown cells using flow cytometry. Representative histograms showing cell cycle distribution of each cell line cultured for 48 hours after synchronization. The percentage of cell population in each cell cycle phase was calculated using FlowJo software. The stacked bars represent the mean from three biological replicates, and the error bars are SD. The statistical significance of percentage of cells in S phase was assessed against NCI-H660 shScr cells by one-way ANOVA. **p<0.01. (E) Expression of ZBTB7A and CDK-inhibitory proteins in NCI-H660 shScr and ZBTB7A knockdown cells. Protein expression levels were quantified by densitometry using Image J software. Bars represent the mean from five biological replicates, and error bars are SD. ns, non-significant, *p<0.05, and **p<0.01 by Kruskal-Wallis test.
Figure 4
Figure 4
Silencing RET in NCI-H660 ZBTB7A knockdown cells further reduced cell entry into S phase. (A) Protein expression of ZBTB7A, RET and CDK negative regulators in NCI-H660 shScr and ZBTB7A knockdown cells after transient transfection with non-targeting (NT) or two unique anti-RET siRNAs for 96 hours, including serum-starvation during the first 24 hours of transfection. Protein expression levels were quantified by densitometry using Image J. Bars represent the mean from five biological replicates and error bars are SD. *p<0.05, and **p<0.01 by one-way ANOVA. All the unmarked pairs are statistically non-significant. (B) Representative histograms of cell cycle analysis by flow cytometry in NCI-H660 shScr and ZBTB7A knockdown cells after transient transfection with indicated siRNAs following the condition described in (A). Cell cycle distributions were analyzed using FlowJo. Bars represent the mean percentage of cells in indicated cell cycle phase from four biological replicates and error bars are SD. *p<0.05, **p<0.01, ***p<0.001, and ****p<0.0001 by one-way ANOVA.
Figure 5
Figure 5
Gene network analysis and ZBTB7A perturbation revealed the association of ZBTB7A in suppressing apoptosis in NEPC. (A) Gene networks of apoptosis related genes are associated with ZBTB7A gene network in NEPC and ADCA. The gene network correlation coefficients of 19,769 genes present in both ADCA and NEPC patients were used. The gene networks associated with ZBTB7A were plotted in the rank order based on the differential gene network correlation coefficient values (see Methods). High differential correlation coefficient value indicates that a gene network is more associated with ZBTB7A in NEPC, while low value implies more association with ZBTB7A in ADCA. Red and blue dots represent the most associated gene networks of apoptosis related genes with ZBTB7A in NEPC and ADCA, respectively. (B) ZBTB7A, Bcl-2 and Bax protein expression in NCI-H660 shScr and ZBTB7A knockdown cells. Bcl-2 and Bax protein levels were quantified by densitometry using Image J. Bars represent the mean from four biological replicates, and error bars are SD. ns, non-significant, *p<0.05 by Kruskal-Wallis test. (C) Bax/Bcl-2 ratio was calculated using their quantified protein expression from each biological replicate in (B). Bars represent the mean of relative differences to the ratio of shScr cells from four biological replicates, and error bars are SD. ns, non-significant, *p<0.05 by Kruskal-Wallis test. (D) Apoptosis assay in NCI-H660 shScr and ZBTB7A knockdown cells by flow cytometry using Annexin V-FITC/7-AAD double staining. Representative scatter plots of 7-AAD versus Annexin V. The stacked bars represent the mean percentage of early and late apoptotic cells from three biological replicates and error bars are SD. The total percentage of apoptotic cells was assessed using one-way ANOVA. **p<0.01.

Similar articles

Cited by

References

    1. Beltran H, Prandi D, Mosquera JM, Benelli M, Puca L, Cyrta J, et al. . Divergent clonal evolution of castration-resistant neuroendocrine prostate cancer. Nat Med (2016) 22(3):298–305. doi: 10.1038/nm.4045 - DOI - PMC - PubMed
    1. Bluemn EG, Coleman IM, Lucas JM, Coleman RT, Hernandez-Lopez S, Tharakan R, et al. . Androgen receptor pathway-independent prostate cancer is sustained through FGF signaling. Cancer Cell (2017) 32(4):474–489.e6. doi: 10.1016/j.ccell.2017.09.003 - DOI - PMC - PubMed
    1. Abida W, Cyrta J, Heller G, Prandi D, Armenia J, Coleman I, et al. . Genomic correlates of clinical outcome in advanced prostate cancer. Proc Natl Acad Sci USA (2019) 116(23):11428–36. doi: 10.1073/pnas.1902651116 - DOI - PMC - PubMed
    1. Aggarwal R, Huang J, Alumkal JJ, Zhang L, Feng FY, Thomas GV, et al. . Clinical and genomic characterization of treatment-emergent small-cell neuroendocrine prostate cancer: A multi-institutional prospective study. J Clin Oncol (2018) 36(24):2492–503. doi: 10.1200/JCO.2017.77.6880 - DOI - PMC - PubMed
    1. Culine S, El DM, Lamy PJ, Iborra F, Avanc ès C, Pinguet F. Docetaxel and cisplatin in patients with metastatic androgen independent prostate cancer and circulating neuroendocrine markers. J Urol (2007) 178(3):844–8. doi: 10.1016/j.juro.2007.05.044 - DOI - PubMed

Publication types