

Hepatitis C Virus Micro-elimination Among People With HIV in San Diego: Are We on Track?
- PMID: 37065984
- PMCID: PMC10099471
- DOI: 10.1093/ofid/ofad153
Hepatitis C Virus Micro-elimination Among People With HIV in San Diego: Are We on Track?
Abstract
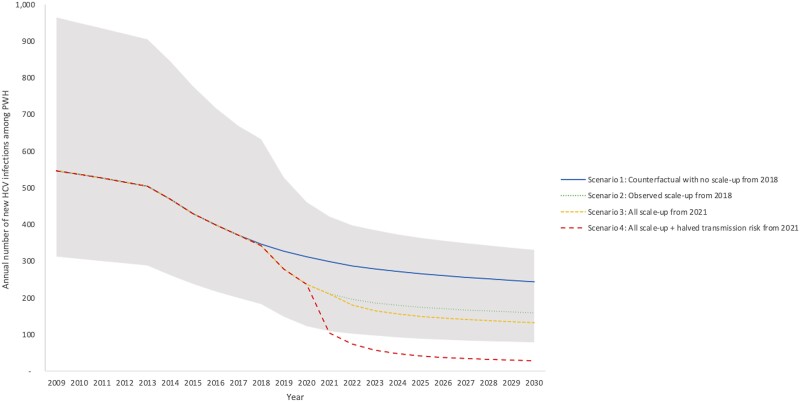
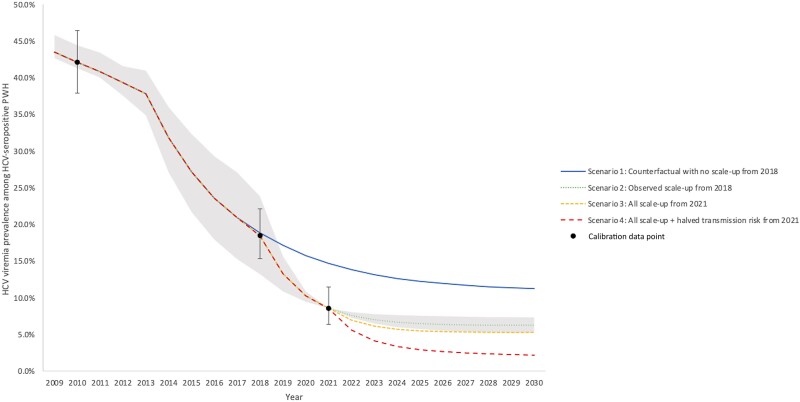
Background: Rising incidence of hepatitis C virus (HCV) among people with HIV (PWH) in San Diego County (SDC) was reported. In 2018, the University of California San Diego (UCSD) launched a micro-elimination initiative among PWH, and in 2020 SDC launched an initiative to reduce HCV incidence by 80% across 2015-2030. We model the impact of observed treatment scale-up on HCV micro-elimination among PWH in SDC.
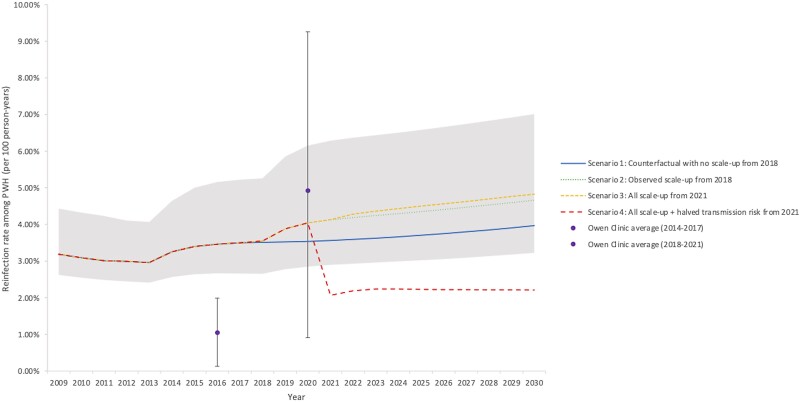
Methods: A model of HCV transmission among people who inject drugs (PWID) and men who have sex with men (MSM) was calibrated to SDC. The model was additionally stratified by age, gender, and HIV status. The model was calibrated to HCV viremia prevalence among PWH in 2010, 2018, and 2021 (42.1%, 18.5%, and 8.5%, respectively), and HCV seroprevalence among PWID aged 18-39 years, MSM, and MSM with HIV in 2015. We simulate treatment among PWH, weighted by UCSD Owen Clinic (reaching 26% of HCV-infected PWH) and non-UCSD treatment, calibrated to achieve the observed HCV viremia prevalence. We simulated HCV incidence with observed and further treatment scale-up (+/- risk reductions) among PWH.
Results: Observed treatment scale-up from 2018 to 2021 will reduce HCV incidence among PWH in SDC from a mean of 429 infections/year in 2015 to 159 infections/year in 2030. County-wide scale-up to the maximum treatment rate achieved at UCSD Owen Clinic (in 2021) will reduce incidence by 69%, missing the 80% incidence reduction target by 2030 unless accompanied by behavioral risk reductions.
Conclusions: As SDC progresses toward HCV micro-elimination among PWH, a comprehensive treatment and risk reduction approach is necessary to reach 2030 targets.
Keywords: HCV; HIV; PWH; modeling.
© The Author(s) 2023. Published by Oxford University Press on behalf of the Infectious Diseases Society of America.
Conflict of interest statement
Potential conflicts of interest. N.M. has received unrestricted research grants from Gilead and Merck. E.R.C. has received unrestricted research grants from Gilead and Merck. He also participated in an advisory board for Theratechnologies for an unrelated topic.
Figures

Similar articles
-
Is San Diego California on Track to Reach HCV Elimination? A Modeling Analysis of Combination Prevention Strategies.Viruses. 2024 Nov 22;16(12):1819. doi: 10.3390/v16121819. Viruses. 2024. PMID: 39772129 Free PMC article.
-
Screening for Sexually Transmitted Infections During Hepatitis C Treatment to Predict Reinfection Among People With HIV.Open Forum Infect Dis. 2020 Dec 30;8(2):ofaa643. doi: 10.1093/ofid/ofaa643. eCollection 2021 Feb. Open Forum Infect Dis. 2020. PMID: 33553480 Free PMC article.
-
Is hepatitis C virus elimination possible among people living with HIV and what will it take to achieve it?J Int AIDS Soc. 2018 Apr;21 Suppl 2(Suppl Suppl 2):e25062. doi: 10.1002/jia2.25062. J Int AIDS Soc. 2018. PMID: 29633560 Free PMC article. Review.
-
Eliminating Hepatitis C Virus Among Human Immunodeficiency Virus-Infected Men Who Have Sex With Men in Berlin: A Modeling Analysis.J Infect Dis. 2019 Oct 8;220(10):1635-1644. doi: 10.1093/infdis/jiz367. J Infect Dis. 2019. PMID: 31301142 Free PMC article.
-
Mathematical modeling of hepatitis c virus (HCV) prevention among people who inject drugs: A review of the literature and insights for elimination strategies.J Theor Biol. 2019 Nov 21;481:194-201. doi: 10.1016/j.jtbi.2018.11.013. Epub 2018 Nov 16. J Theor Biol. 2019. PMID: 30452959 Free PMC article. Review.
Cited by
-
Prevalence and Correlates of Hepatitis C Viremia Among People With Human Immunodeficiency Virus in the Direct-Acting Antiviral Era.Open Forum Infect Dis. 2025 Jan 17;12(2):ofaf030. doi: 10.1093/ofid/ofaf030. eCollection 2025 Feb. Open Forum Infect Dis. 2025. PMID: 39896988 Free PMC article.
-
Is San Diego California on Track to Reach HCV Elimination? A Modeling Analysis of Combination Prevention Strategies.Viruses. 2024 Nov 22;16(12):1819. doi: 10.3390/v16121819. Viruses. 2024. PMID: 39772129 Free PMC article.
References
-
- Centers for Disease Control and Prevention . People coinfected with HIV and viral hepatitis. Updated September 21, 2020. Available at: https://www.cdc.gov/hepatitis/populations/hiv.htm. Accessed May 22, 2021.
-
- Centers for Disease Control and Prevention . Hepatitis C questions and answers for health professionals. Updated August 7, 2020. Available at: https://www.cdc.gov/hepatitis/hcv/hcvfaq.htm. Accessed May 22, 2021.
-
- World Health Organization . Consolidated strategic information guidelines for viral hepatitis: planning and tracking progress towards elimination. 2018. Available at: https://apps.who.int/iris/bitstream/handle/10665/310912/9789241515191-en.... Accessed January 5, 2021.
