. 2023 Apr 7;9(1):vead022.
doi: 10.1093/ve/vead022. eCollection 2023.

MutaGAN: A sequence-to-sequence GAN framework to predict mutations of evolving protein populations

Affiliations

MutaGAN: A sequence-to-sequence GAN framework to predict mutations of evolving protein populations

Daniel S Berman et al. Virus Evol. .

Abstract

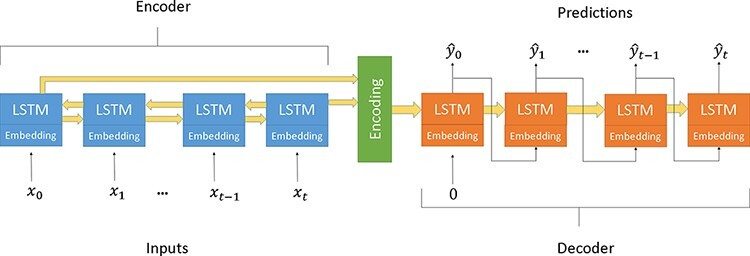
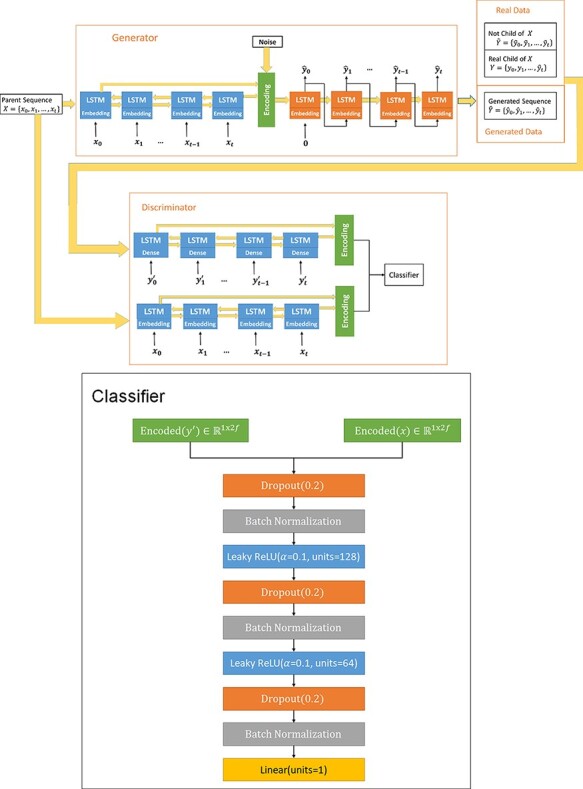
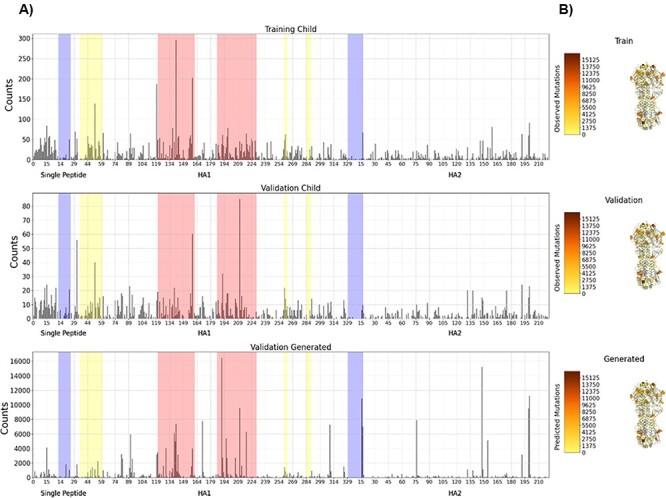
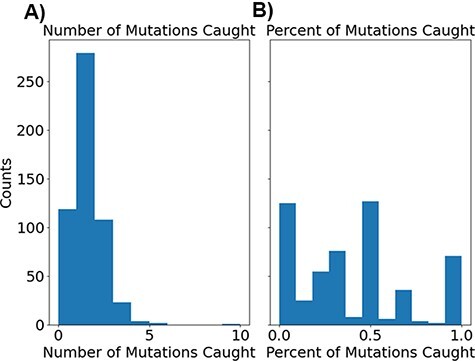
The ability to predict the evolution of a pathogen would significantly improve the ability to control, prevent, and treat disease. Machine learning, however, is yet to be used to predict the evolutionary progeny of a virus. To address this gap, we developed a novel machine learning framework, named MutaGAN, using generative adversarial networks with sequence-to-sequence, recurrent neural networks generator to accurately predict genetic mutations and evolution of future biological populations. MutaGAN was trained using a generalized time-reversible phylogenetic model of protein evolution with maximum likelihood tree estimation. MutaGAN was applied to influenza virus sequences because influenza evolves quickly and there is a large amount of publicly available data from the National Center for Biotechnology Information's Influenza Virus Resource. MutaGAN generated 'child' sequences from a given 'parent' protein sequence with a median Levenshtein distance of 4.00 amino acids. Additionally, the generator was able to generate sequences that contained at least one known mutation identified within the global influenza virus population for 72.8 per cent of parent sequences. These results demonstrate the power of the MutaGAN framework to aid in pathogen forecasting with implications for broad utility in evolutionary prediction for any protein population.

Keywords: Influenza virus; deep learning; evolution; generative adversarial networks; sequence generation.


Conflict of interest statement

The authors declare no conflicts of interest.

Figures

Figure 1.
Figure 1.
A seq2seq model using two bidirectional LSTM encoder and a unidirectional LSTM decoder and embedding layers.
Figure 2.
Figure 2.
The MutaGAN framework’s architecture. The generator of the MutaGAN is a seq2seq translation deep neural network using LSTMs and embedding layers. The encoding layer uses a bidirectional LSTM. The output of the encoder is combined with a vector of random noise from a normal distribution N(0,1). The output of the decoder LSTM feeds into a softmax dense layer. An argmax function is then applied to select a single amino acid at each position, rather than a probability distribution. The discriminator uses an encoder with a slightly different structure from the encoder in the generator, but it uses the same weights. This is because an argmax function is not differentiable. Therefore, the first layer of the encoder in the discriminator is a linear dense layer with the same output size as the term embedding layer in the generator. This allows it to take as input, the output of the dense layer of the decoder in the generator. The weights of this dense layer are the same as those of the embedding layer, meaning that it produces a linear combination of the embeddings from the embedding layer of encoder. The discriminator takes in two sequences and determines whether the input sequences are a real parent–child pair or if they are not. The sequences that are not real parent–child pairs are a parent and generated sequences and two real sequences that are not parent–child pairs.
Figure 3.
Figure 3.
Topology of RAxML tree used to build parent–child pairs. The topology of the maximum likelihood tree created from 6,840 H3N2 sequences is shown in (A). The ancestral sequences of each internal node in this tree were used to form the 13,768 parent–child pairs used to train the seq2seq generator of the GAN framework. An outlying group, containing twenty-two sequences, was identified as coming from swine or avian hosts, and those sequences are indicated in blue and with *. One of these twenty-two sequences was from the group of 155 parent-child pairs with a Levenshtein distance >10 and is indicated in yellow and with **. The region surrounding that outlying group (gray box) is expanded in the inset (B) and further expanded in the insert (C), where it can be seen that the majority of the parent–child pairs removed for high Levenshtein distance in non-human hosts come directly off the backbone of the phylogenetic tree leading to the outlying group in blue. This trend continues back to the root of the tree.
Figure 4.
Figure 4.
Amino acid mutation profiles with respect to amino acid types. For the training, validation, and generated child sequences, total counts for each amino acid mutation from parent to child are displayed in (A). Amino acid ordering was determined using R’s hclust function on the training data and kept consistent throughout both (A) and (B). Differences in amino acid mutation frequency between the training, validation, and generated datasets were calculated and are visualized in (B) using Equation 2
Figure 5.
Figure 5.
Amino acid mutation profiles with respect to HA protein locations. For the training, validation, and generated child sequences, total counts of mutations observed across the entire length of the HA protein segment are displayed in (A), indicating the signal peptide, HA1 (head), and HA2 (stalk) regions of the full HA protein. The most highly variable regions are highlighted in salmon, the third and fourth highlighted regions. Regions of lesser, but still significant variability, are highlighted in yellow, the second, fifth and sixth highlighted regions. Particularly conserved regions are highlighted in blue, the first and last highlighted regions. In (B), a diagram of the H3 HA structure (PDB: 4GMS) is colored by this mutation frequency, with the positions with the fewest mutations in yellow to the positions with the most mutations in brown. Positions with zero observed mutations across each dataset are colored gray. Residues are displayed as spheres for positions with mutation frequencies above 30 per cent of the maximum position for each of the three datasets. These 30 per cent threshold lines are also plotted in (A).
Figure 6.
Figure 6.
Histograms showing the distribution of correct mutations as both total counts (A) and percentage of total recorded mutations (B).

References

    1. Abadi M. et al. (2016) ‘Tensorflow: A system for large-scale machine learning’, in 12th {USENIX} Symposium on Operating Systems Design and Implementation ({OSDI} 16), pp. 265–83.
    1. Alipanahi B. et al. (2015) ‘Predicting the Sequence Specificities of DNA- and RNA-Binding Proteins by Deep Learning’, Nature Biotechnology, 33: 831–8. - PubMed
    1. Anand N., and Huang P. (2018) ‘Generative Modeling for Protein Structures’, Advances in Neural Information Processing Systems, 31: 7504–15.
    1. Arjovsky M., Chintala S., and Bottou L. (2017) ‘Wasserstein Generative Adversarial Networks’, in International Conference on Machine Learning, pp. 214–23.
    1. Asgari E., and Mofrad M. R. K. (2015) ‘Continuous Distributed Representation of Biological Sequences for Deep Proteomics and Genomics’, PLoS One, 10: e0141287. - PMC - PubMed