Review
. 2023 Mar 30:17:1129097.
doi: 10.3389/fncel.2023.1129097. eCollection 2023.

Theoretical considerations and supporting evidence for the primary role of source geometry on field potential amplitude and spatial extent

Affiliations
Review

Theoretical considerations and supporting evidence for the primary role of source geometry on field potential amplitude and spatial extent

Oscar Herreras et al. Front Cell Neurosci. .

Abstract

Field potential (FP) recording is an accessible means to capture the shifts in the activity of neuron populations. However, the spatial and composite nature of these signals has largely been ignored, at least until it became technically possible to separate activities from co-activated sources in different structures or those that overlap in a volume. The pathway-specificity of mesoscopic sources has provided an anatomical reference that facilitates transcending from theoretical analysis to the exploration of real brain structures. We review computational and experimental findings that indicate how prioritizing the spatial geometry and density of sources, as opposed to the distance to the recording site, better defines the amplitudes and spatial reach of FPs. The role of geometry is enhanced by considering that zones of the active populations that act as sources or sinks of current may arrange differently with respect to each other, and have different geometry and densities. Thus, observations that seem counterintuitive in the scheme of distance-based logic alone can now be explained. For example, geometric factors explain why some structures produce FPs and others do not, why different FP motifs generated in the same structure extend far while others remain local, why factors like the size of an active population or the strong synchronicity of its neurons may fail to affect FPs, or why the rate of FP decay varies in different directions. These considerations are exemplified in large structures like the cortex and hippocampus, in which the role of geometrical elements and regional activation in shaping well-known FP oscillations generally go unnoticed. Discovering the geometry of the sources in play will decrease the risk of population or pathway misassignments based solely on the FP amplitude or temporal pattern.

Keywords: LFP; current source; field potential; network oscillations; source geometry; source localization; spatial reach; volume conduction.


Conflict of interest statement

The authors declare that the research was conducted in the absence of any commercial or financial relationships that could be construed as a potential conflict of interest.

Figures
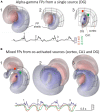
FIGURE 1
FIGURE 1
Field potentials (FPs) extend far from their population sources, invading other areas and mixing. (A) 1–3 are snapshots of the alpha-gamma activity generated in the Dentate Gyrus (DG). The instants chosen are indicated by vertical dashes in single site customary traces. The 3D structure of the sources is shown in the background in black. These were modeled as contiguous dipolar blocks of current (source and sink) with dimensions and spatial location roughly matching those in the Rat Brain Atlas by Patxinos and Watson (2006). Three pathway-specific sources of current were modeled, a synaptic input to middle dendrites of layer 5 pyramidal cells in the cortex (outer frame), an input to the st. lacunosum-moleculare of the CA1 pyramidal cells (intermediate), and the LPP input to Dentate Gyrus granule cells (inner frame). The colored concentric spheroids represent isopotential surfaces (blue and red shells of FP are negative and positive values, respectively). The lowest level plotted (outermost spheroid) is at ± 0.13 mV. These are from a point in the thalamus (blue) and two in the cortex (red and green) (note different scaling). (B) 1–3 snapshots during co-activation of multiple sources in different structures: alpha-gamma in the DG, slow waves in the cortex, and hippocampal theta rhythm in CA1. The model is based on finite-element methods (FEMs) using realistic dimensions, current densities and temporal dynamics (as in Torres et al., 2019). Note that FP shells at different instants maintain proportional amplitude across space when only one source is active (A), but not when multiple sources are co-activated (B). For a dynamic representation see Supplementary Video 1.
FIGURE 2
FIGURE 2
Spatial coherence of FPs is brought about by the pathway-specific nature of the sources. (A) The spatiotemporal clustering of currents required to raise a mesoscopic FP is provided by the synchronous firing of a cell assembly projecting onto an orderly population. The scheme illustrates a simple case corresponding to excitatory input from a neuron assembly to a target population with neurons arranged in palisade (e.g., the CA3-CA1 Schaffer pathway). Numerous buttons en passage ensure synchronous synaptic currents in the target population and the stratified organization of the synaptic territory can be perceived as an initial anatomical reference for source geometry (pad-like bluish block occupying a dendritic stratum). However, as the inward current at the synapses (sinks, in blue) travels inside neurons, it leaks out back into the volume (sources, in red) through adjacent membrane domains, jointly shaping a conglomerate of sheet-like stacked currents that cover the entire physical space occupied by the population. (B) Voltage profiles do not match CSD profiles. Computed voltage profiles for the activation of the Schaffer (green) and Perforant pathways (blue) that establish synaptic contacts in the middle and distal parts of the dendritic tree, respectively. The dashed lines represent the spatial boundaries of the source population within which the extracellular currents arise (colored bars on the left indicate the spatial distribution of currents for each pathway, i.e., the current source density: CSD) along the cell generators that produce the voltage profiles. Note the dipole or quadrupole (sandwich-like) configuration of the currents for inputs to distal or mid-dendritic portions of neurons, respectively. Distal inputs favor the extension of FPs away from the source population (oval).
FIGURE 3
FIGURE 3
The critical role of source geometry and current density in defining the rate of field potential decay. (A) Non-symmetrical dipolar sources produce FPs with different rates of decay. Panels (1,2) show the 3D computation of isopotential spheroids (only three levels are represented) generated by rectangular dipolar sources with the long side doubling the short one (4 mm × 2 mm × 0.5 mm). The lines of current are drawn on a plane perpendicular to the source. In panel (2) the source maintains the same overall geometry and total current density, but this is unevenly distributed. A few linear profiles of the voltage have been drawn (4) to better appreciate the different rates of decay. All plots depart from the center of the block as indicated in panel (3) and scan the volume orthogonal to the dipolar source (o), or they are tilted at identical angles to the long (l) or the short (s) sides, or in between (d). Profiles in orange and green correspond to 3D configurations in panels (1,2), respectively. It can be appreciated that the “mean” distance between the electrode and the source cannot be used to predict the amplitude and spatial reach of FPs. (B) Model analysis of the effect of increasing the size of a cortical module (0.5–6 mm) on the amplitude of the FPs recorded inside (gray) and outside subcortical sites (brown). Voltage profiles in panel (2) are colored from cyan to dark blue for enlarging cortical modules. The curved (in-source) and the flat portions (out-source) of the voltage profiles grow at different rates (3). Whereas the curved portion is mostly contributed by nearby neurons, the flat part can be said to be contributed by neurons at a distance from the recording tract. This distant contribution (red profile) can be computed by excluding neurons close to the electrode [neurons within 1 mm of the electrode were excluded in the red profile of panel (B) 2]. This is schematically explained in panel (C): Panel (1) is a scheme of the activation of an excitatory synapse and the resulting microscopic sinks and sources (blue and red arrowheads) on the outside, each of which raises a potential that integrates into recording sites weighted by distance. For small sources (2) the different distance of “point-like” sources or sinks determines the amplitude and polarity at electrodes inside the active population. For large sources (3) the distances of distant sources and sinks equalize at electrodes inside the population, largely neutralizing each other (large arrows), but less so for electrodes at a distance from the population (ovals). Although each “point-like” current has a small impact, the large numbers build significant potential over a distance. Thus, distance becomes irrelevant when many fields are combined and their joint geometry takes over [(B) reproduced with permission from Torres et al., 2019. (A) Computed with the same model].
FIGURE 4
FIGURE 4
Spatial and temporal ambiguities of potentials generated by local and remote sources. (A) Potentials decay fast close to the source and slowly away from it, a feature that is used as an arbitrary segmentation of the volume to circumscribe “local” and remote FPs. FPs elicited by a single source have an identical time course throughout the volume (normalized at the bottom in red), only varying in amplitude or polarity at different sites. (B) A case of two overlapping sources in the same structure (two synaptic pathways): left column, spatial voltage profiles; right column (from top to bottom), color coded activities of the two sources (top); in black, mixed FPs at different distances; at the bottom, normalized potentials of distant sites. Note that close to the sources the time course is strongly site-dependent, whereas at positions further away time features are invariant and exhibit blended time marks.
FIGURE 5
FIGURE 5
The reach of cortical FPs depends on the specific geometry of the sources. (A) Computational (1) and experimental findings (2) on the activation of small cortical modules (0.5 mm) of layer 5 pyramidal cells during gamma waves in two cortical areas (M1 and V2). The computation is performed over the entire hemisphere (3D) but only one sagittal cut is shown with contour plots of the potential at a chosen instant. Scale color bar: ± 0.15 mV. The boxes mark the sites where recording arrays were placed in experiments to capture laminar FPs in panel (2). The limited spatial extent of gamma bouts in experiments is noted by the lack of coherence between the waves in different areas (a) or the region-selective occurrence (b). Other gamma waves (purple oval) appear with invariant waveforms along the cortical width and even in the striatum, indicating an extracortical origin of a gamma source that extends into large brain areas. Panels (3,4) show a different computer analysis of cortical blocks with independent dynamics and different sizes. It can be appreciated how small cortical modules (in blue) can exhibit FPs dominated by nearby larger modules (cortico-cortical contamination). The black trace corresponds to the FP mixture in the small module and the colored traces are the input activities to each module. The voltage profiles (3) and the time course of mixed FPs (4) show the greater contribution of near modules in red and green than its own. (B) (1) Similar computer simulation as in (A) for slow cortical (delta) waves spanning large portions of the cortical mantle predict that it reaches all sites in the rat brain with large amplitude (Scale color bar: ± 0.6 mV), which is confirmed in experiments (2). Actually, the amplitude reduces only moderately in subcortical sites far from their origin (the recording sites are marked by colored dots in “1”). Panel (3) illustrates the 3D representation of about 2/3rds of the cortical mantle used for the computation. Assembled rectangular blocks of dipolar current were used (numbers are mm). The blue arrows mark the direction of the slow wave traveling across the cortical modules. Upper traces in panel (4) represent the activation of a single cortical block, and the lower traces depict computed potentials during sliding activation (100 ms delay between contiguous cortical blocks) of the entire cortex [the first and last block are marked in blue in panel (3)]. (Columns 1 and 2, and panels (A3,A4) are adapted from Torres et al., 2019).
FIGURE 6
FIGURE 6
Population curvatures promote greater FPs out of the physical space of the active neurons: the Hilus of the Dentate Gyrus. (A) Laminar recordings across the Dentate Gyrus (DG): synaptic inputs to granule cells (GCs) of the DG produce giant FPs in the Hilus between the folded layer of GCs. (B) Spatial display of the relative power of the medial perforant path (MPP)-specific FPs detached mathematically from other inputs. The dotted line outlines the GC body layer and the dashed line marks polarity reversal (zero value). The large positive potentials (yellow-red) in the Hilus (out of GC layers) outgrow the negative potentials in the synaptic layers 10–20-fold. The black lines are voltage profiles across different recording tracks. (C) Explanatory scheme of the potentials associated to an excitatory lateral perforant path (LPP) input in distal dendrites. Blue/red bar indicates the current density across GC layers: while the microsinks scatter in the outer dendritic layer (blue dots), the folding causes all the microsources (red dots) in both layers to cluster and approach the Hilus, fostering the combination of their potentials with respect to that of microsinks. The red lines indicate the similar proximity of the latter at the ends of both leafs to an electrode located in the middle of the Hilus (r5). These would be farther away if the GC layer were flat. Although the same can be said for microsources, the smaller average distance of the former has a greater impact. The bar represents the current density across the GC layers. (D) Model reconstruction of the relative power of FPs across a sagittal cut of the DG generated by synchronous MPP input to both layers (compare to B). (E) Scheme showing the cellular dipoles (blue/red bars) representing GCs receiving LPP input (S2) and somatic inhibition (S1). Note that the synaptic territories at both ends of GCs and opposing currents for somatic inhibition and dendritic excitation makes the respective dipoles orientate similarly. The dipoles in the upper and lower blades face each other and project with the same polarity (positive) toward the hilar region. The MPP input (S3, in gray) produces a quadrupole current distribution (not illustrated) that limits the spread of the potentials. The black box depicts the array recording area for traces illustrated in panel (F). (F) Model gamma oscillations elicited by a LPP excitatory input (S1, green) and soma inhibition (S2, cyan). The model was fed with source activities (colored traces) obtained from experiments to simulate FPs (black traces). The source/sink currents (CSD) generating the FPs are limited to GC layers, but they are absent in the Hilus. Note that all gamma waves recorded across the Hilus have similar polarity, whether contributed by one or the two inputs, and hence they could not reveal the synaptic origin [Panels (A,B,D) are taken from Fernández-Ruiz et al., 2013].
FIGURE 7
FIGURE 7
Field potentials (FPs) arising from whole-structure geometry: the banana-like hippocampus. (A) Snapshot of the FP spatial distribution over a sagittal cut of the rat brain during activation of theta sources in the stratum Lac-Mol of the CA1 hippocampus. Model FPs have been AC-filtered to remove the strong baseline. The curved shape of this structure fosters the addition of fields toward the inner side (thalamus). This is better appreciated in the 3D representation (see Supplementary Video 2). (B) Experimental traces recorded by pairs during theta activity [sites indicated in panel (A)]. Note the different amplitude or polarity and the strong but incomplete pairing of the waves at the sites. (C) Scheme of the model. The CA1 was built as assembled dipolar blocks of current with the dimensions and current densities obtained from experiments. The overall curvature means the cell dipoles are arranged radially toward the thalamus, such that their potentials cluster in the center and decay much less than expected for planar structures. The double-headed arrows indicate the orientation of the dipole blocks. Note that the cortex and thalamus must receive potentials of opposite polarity. (D) Scheme illustrating possible relationships derived from experimental observations on regionalized activation of theta sources along the septotemporal axis. The hippocampus is segmented into three portions, dorsal (d), medial (m), and ventral (v). Theta activation in one or more of these regions may result in a modulation of different theta wave parameters in other segments inside the hippocampus (interactions marked by white arrows) or outside (red arrows). (E) Snapshots of the FP distribution in one hemisphere (pseudo 3D representations) during regional activation of the CA1 with theta currents. The structures in the background correspond to the cortical mantle (outer structure), the CA1, and the DG. View of the right hemisphere from the middle line. The CA1 was modeled as four planar blocks of dipolar current arranged as to account for the global curvature. Panels correspond to the dorsal (1), lateral (2), dorsal plus lateral (3), or complete CA1 (4) theta activation. See dynamic display in Supplementary Video 2. Sample FP traces at selected sites indicated by colored dots in panel 1. The asterisk marks the instant used to build the contour plots. Note the different modulations of amplitude, polarity and even the phase of the waves. The regions are activated with a 100 ms delay along the septotemporal axis according to experimental findings. A, D, L: anterior, dorsal, lateral (Same model as in Torres et al., 2019).
FIGURE 8
FIGURE 8
Potentials from far sources may correlate to local neuron firing with no direct relationship: cuckoo potentials. (A) The lateral habenula (LHb) is positioned near the hippocampus. Both structures receive theta-pace inputs from the septal pacemakers and exhibit rhythmic theta oscillations in FP recordings (black traces). e1 and e6 are located in the stratum Lac.-Mol. of the CA1 and the LHb, respectively. Spatial discrimination analysis (ICA) of FPs recorded across the boundary between these regions (scheme) highlights a single theta source (S1: purple trace and V-profile) with peaks in the CA1 stratum Lac.-Mol. and DG molecular layer (arrow). However, although the power decays inside and across the LHb (arrowhead), it still makes the strongest contribution there (black oval). Sources S4 and S5 have greater power in the HBl, but they exhibit irregular activity. (B) Anatomically realistic model of the CA1 and the LHb. The upper blocks represent the orderly cytoarchitecture of the pyramidal cells in the CA1 and the multipolar tangled cell types in the LHb. The lower plots are the V-profiles obtained for theta inputs (marked in red) onto different cell types (FH: fusiform horizontal; FV: fusiform vertical; Vert: vertical). FV(1–3) correspond to three different subcellular distribution of inputs: only an apical–only input (FV3) produce significant potentials (white arrow). Whereas theta input to CA1 pyramidal cells leads to strong FPs that extend through the LHb, habenular cells barely contributed any FPs (compare contributions VCA1 and VLHb). (C) Scheme explaining the spurious but correct FP-to-spike correlation. Input from the septal area drives neurons in the CA1 and the LHb (purple arrows), both of which fire spikes at a theta frequency. In CA1 theta firing cells activate theta currents in pyramidal cells and large theta FPs, which spread and reach the LHb [Panels (A,B) are adapted with permission from Bertone-Cueto et al., 2020].

Similar articles

Cited by

References

    1. Abeles M. (1991). Corticonics: neural circuits of the cerebral cortex. Cambridge: Cambridge University Press.
    1. Adey W. R., Kado R. T., McIlwain J. T., Walter D. O. (1966). The role of neuronal elements in regional cerebral impedance changes in alerting, orienting and discriminative responses. Exp. Neurol. 15 490–510. 10.1016/0014-4886(66)90146-4 - DOI - PubMed
    1. Aizawa H., Yanagihara S., Kobayashi M., Niisato K., Takekawa T., Harukuni R., et al. (2013). The synchronous activity of lateral habenular neurons is essential for regulating hippocampal theta oscillation. J. Neurosci. 33 8909–8921. 10.1523/JNEUROSCI.4369-12.2013 - DOI - PMC - PubMed
    1. Anastassiou C. A., Koch C. (2015). Ephaptic coupling to endogenous electric field activity: why bother? Curr. Opin. Neurobiol. 31 95–103. 10.1016/j.conb.2014.09.002 - DOI - PubMed
    1. Arcaro M. J., Livingston M. S. (2021). On the relationship between maps and domains in inferotemporal cortex. Nat. Rev. Neurosci. 22 573–583. 10.1038/s41583-021-00490-4 - DOI - PMC - PubMed