[Preprint]. 2023 Apr 6:2023.04.06.535398.
doi: 10.1101/2023.04.06.535398.

Histone Deacetylases (HDACs) maintain expression of the pluripotent gene network via recruitment of RNA polymerase II to coding and non-coding loci

Affiliations

Histone Deacetylases (HDACs) maintain expression of the pluripotent gene network via recruitment of RNA polymerase II to coding and non-coding loci

Kelly Rdw et al. bioRxiv. .

Update in

Abstract

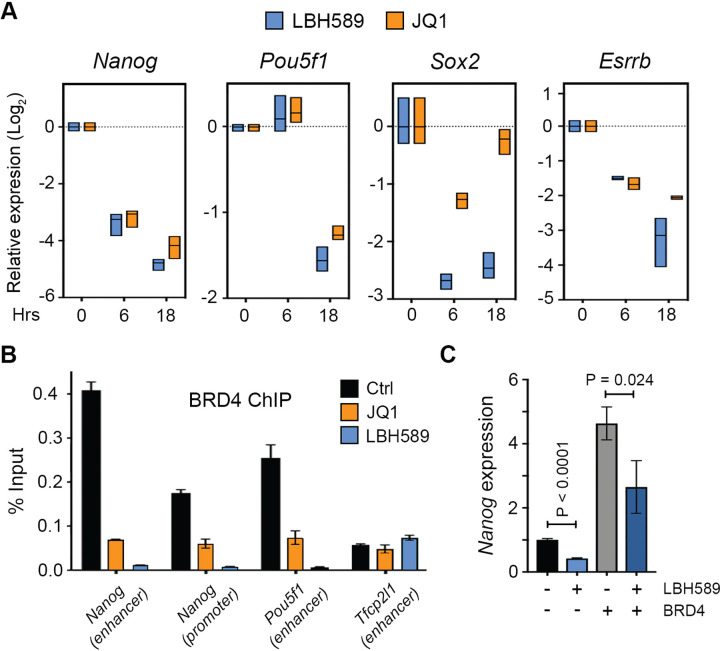
Histone acetylation is a dynamic modification regulated by the opposing actions of histone acetyltransferases (HATs) and histone deacetylases (HDACs). Deacetylation of histone tails results in chromatin tightening and therefore HDACs are generally regarded as transcriptional repressors. Counterintuitively, simultaneous deletion of Hdac1 and Hdac2 in embryonic stem cells (ESC) reduced expression of pluripotent transcription factors, Oct4, Sox2 and Nanog (OSN). By shaping global histone acetylation patterns, HDACs indirectly regulate the activity of acetyl-lysine readers, such as the transcriptional activator, BRD4. We used inhibitors of HDACs and BRD4 (LBH589 and JQ1 respectively) in combination with precision nuclear run-on and sequencing (PRO-seq) to examine their roles in defining the ESC transcriptome. Both LBH589 and JQ1 caused a marked reduction in the pluripotent network. However, while JQ1 treatment induced widespread transcriptional pausing, HDAC inhibition caused a reduction in both paused and elongating polymerase, suggesting an overall reduction in polymerase recruitment. Using enhancer RNA (eRNA) expression to measure enhancer activity we found that LBH589-sensitive eRNAs were preferentially associated with super-enhancers and OSN binding sites. These findings suggest that HDAC activity is required to maintain pluripotency by regulating the OSN enhancer network via the recruitment of RNA polymerase II.


Figures

Figure 1:
Figure 1:. HDAC1 and 2 (HDAC1/2) maintain pluripotency in a gene dosage-dependent manner.
(A) Microarray data from n = 3 biological replicates showing relative expression (log2 fold-change) of indicated pluripotent genes in Hdac1/2-KO (DKO) and Hdac1-KO; Hdac2-Het cells at 0 (Ctrl) and 3 days post deletion (OHT). (B) Gene set enrichment analysis (GSEA) plot of microarray data showing Ctrl samples are enriched for the Muller Plurinet (ES=0.47; P<0.0001) and pluripotency (ES=0.70; P<0.0001) gene sets compared to Hdac1-KO; Hdac2-Het KO cells. (C) Western blot data for HDAC1, HDAC2, NANOG and POU5F1 proteins in Hdac1/2-KO (DKO) and Hdac1-KO; Hdac2-Het cells at 0 (Ctrl) and 3 days post deletion (OHT). α-Tubulin (α-TUB) was used as a protein loading control.
Figure 2:
Figure 2:. Super-enhancers have Increased histone H3 Lys27 acetylation (H3K27Ac) in the absence of HDAC1/2, but does not correlate with transcriptional activity.
(A) Heatmaps show ChIP-seq data for the enrichment of H3K27ac levels (Log2-fold) +/− 5kb of the TSS of Refseq genes in control and Hdac1/2 double knockout (DKO) ESCs. (B) A meta-analysis of relative H3K27ac levels relative to input for (B) all genes, (C) differentially expressed genes and (D) super-enhancer (SE) regions in control versus DKO ESCs. (E) H3K27ac levels in control versus DKO ESCs for the indicated genes.
Figure 3:
Figure 3:. HDAC inhibition attenuates pluripotent gene expression without inducing differentiation.
(A) Microarray analysis: the number of genes differentially expressed (1.5-fold; FDR ≤0.05) at the indicated times following LBH589 treatment. (B) Gene set enrichment analysis (GSEA) plot showing enrichment for the defined pluripotency gene set (Kim_Core_Module) in Control versus LBH589 treated ESCs. LBH589 2hr (ES=0.527; P<0.0001), 6hr (ES=0.789; P<0.0001) and 18hr (ES=0.83; P<0.0001). (C) GSEA for Ctrl and LBH589 samples showed equal enrichment for the formation of the primary germ layer (GO:0001704; Germ Layer). (D) Microarray data from n = 3 biological replicates showing relative expression of indicated pluripotent genes in ESCs treated with LBH589 for 2, 6 and 18hrs. The statistical difference was calculated using Benjamini & Hochberg’s false discovery rate (FDR). Asterisk (*) denotes significant changes in expression (≤1.5-fold; FDR≤0.05) relative to untreated control ESCs. (E) RT-qPCR was used to quantify nascent RNA transcription at Nanog, Pou5f1 and Tfcp2l1. Values represent relative Log2 mean (± SEM) of n = 3 technical replicates. (F) ChIP-qPCR analysis of H3K27ac enrichment at the indicated regions. Bars represent the mean (± SEM) of n = 3 technical replicates from one immunoprecipitation.
Figure 4:
Figure 4:. LBH589 and JQ1 target the same subset of pluripotent genes and reduce BRD4 recruitment.
(A) RT-qPCR analysis of pluripotent gene expression following the treatment of ESCs with LBH589 or JQ1 for the indicated time points. Box plots represent the max-min expression range and mean from three biological replicates. (B) ChIP-qPCR analysis of BRD4 enrichment at the indicated regions. Bars represent the mean (± SEM) of n = 3 technical replicates from one immunoprecipitation. (C) RT-qPCR analysis for Nanog expression in ESCs treated with LBH589 and/or over-expressing BRD4, as indicated. Values represent mean (± SEM) relative expression compared to wt of n=6 biological replicates. Statistical differences were calculated using a paired Student t-test.
Figure 5:
Figure 5:. HDAC inhibition caused increased expression of promoter upstream transcripts (PROMPTs) and a loss of promotor proximal polymerase.
(A) Heatmaps displaying a log2-fold change of PRO-seq read counts in 200-bp bins (TSS± 5 kb) at Refseq genes displaying increased or decreased pause index changes following JQ1 (2hr) or LBH589 (2hr and 6hr) treatment. Genes were ranked based on log2-transformed fold-change of RNA polymerase in the promoter-proximal region. (B) A number of gene clusters (A-F) with similar transcriptional changes are shown. For each treatment genes were clustered based on (± 1.5 fold; FDR≤0.05) change in gene body or paused index changes. (C) Metagene plots (TSS ± 5 kb) of RNA polymerase densities at genes showing increased gene body levels following the treatment with JQ1 or LBH589. Inserts show increased antisense transcript (PROMPTs) relative to TSS in greater detail. (D) PRO-seq IGV bedGraph screenshots of Fos and Tpst2 TSS in control with JQ1 or LBH589 for the indicated times. Shaded areas indicate increased antisense transcription in LBH589-treated samples.
Figure 6:
Figure 6:. HDACs regulate expression of the pluripotent gene network via recruitment of RNA polymerase II.
(A) PRO-seq analysis displaying the effects of JQ1 or LBH589 treatment on the level of gene body transcripts for pluripotent gene network members. Heatmap shows log2 fold-change relative to untreated controls. (B) Heatmap shows the effects of JQ1 and LBH589 treatment on pausing index (the ratio of promoter-proximal to gene body transcript levels) changes relative to untreated controls. (C) Metagene plots (TSS ± 4 kb) of pluripotency genes demonstrating decreased initiation and elongation in LBH589 treated samples. (D) RNA polymerase density at Nanog, Sox2 and Pou5f1, Klf2 and Sall4 TSS in either control, JQ1 or LBH589 treated ESCs.
Figure 7:
Figure 7:. HDACs positively regulate a subset of eRNAs associated with super-enhancers.
(A) Volcano plot showing changes in eRNA transcription following treatment with JQ1 or LBH589 for the indicated time points. Statistically enriched (± 1.5 fold; FDR≤0.05) eRNA transcripts relative are indicated by colour. (B) IGV genomic tracks of PRO-seq RNA polymerase densities at intergenic OCT4/SOX2/NANOG (OSN) binding sites associated with the indicated super-enhancer regions. Shaded areas indicate regions of decreased transcription following LBH589 treatment. (C) Metagene plots of RNA polymerase density reads at intergenic OSN binding sites following the indicated treatments.

References

    1. Adams GE, Chandru A, Cowley SM. 2018. Co-repressor, co-activator and general transcription factor: the many faces of the Sin3 histone deacetylase (HDAC) complex. Biochem J 475: 3921–3932. - PMC - PubMed
    1. Andersson R, Gebhard C, Miguel-Escalada I, Hoof I, Bornholdt J, Boyd M, Chen Y, Zhao X, Schmidl C, Suzuki T et al. 2014. An atlas of active enhancers across human cell types and tissues. Nature 507: 455. - PMC - PubMed
    1. Arnold M, Bressin A, Jasnovidova O, Meierhofer D, Mayer A. 2021. A BRD4-mediated elongation control point primes transcribing RNA polymerase II for 3’-processing and termination. Mol Cell 81: 3589–3603 e3513. - PubMed
    1. Baker IM, Smalley JP, Sabat KA, Hodgkinson JT, Cowley SM. 2023. Comprehensive Transcriptomic Analysis of Novel Class I HDAC Proteolysis Targeting Chimeras (PROTACs). Biochemistry 62: 645–656. - PMC - PubMed
    1. Baltus GA, Kowalski MP, Tutter AV, Kadam S. 2009. A Positive Regulatory Role for the mSin3A-HDAC Complex in Pluripotency through Nanog and Sox2. Journal of Biological Chemistry 284: 6998–7006. - PMC - PubMed

Publication types