[Preprint]. 2023 Apr 19:2023.04.03.535488.
doi: 10.1101/2023.04.03.535488.

Improving deep models of protein-coding potential with a Fourier-transform architecture and machine translation task

Affiliations

Improving deep models of protein-coding potential with a Fourier-transform architecture and machine translation task

Joseph D Valencia et al. bioRxiv. .

Update in

Abstract

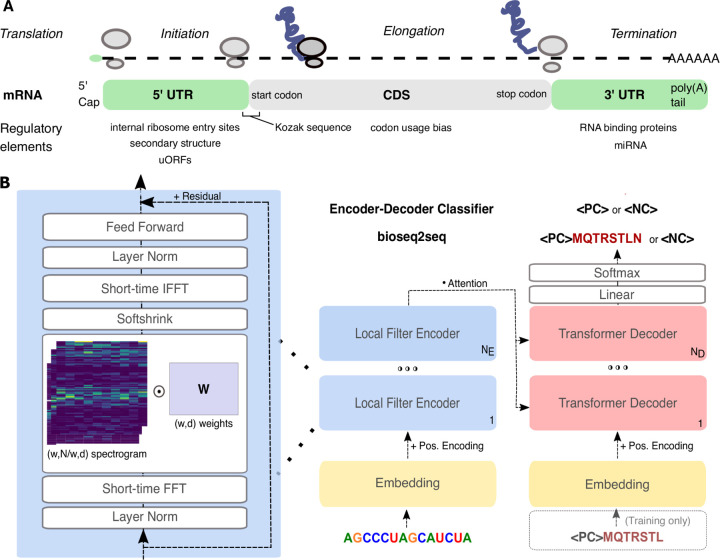
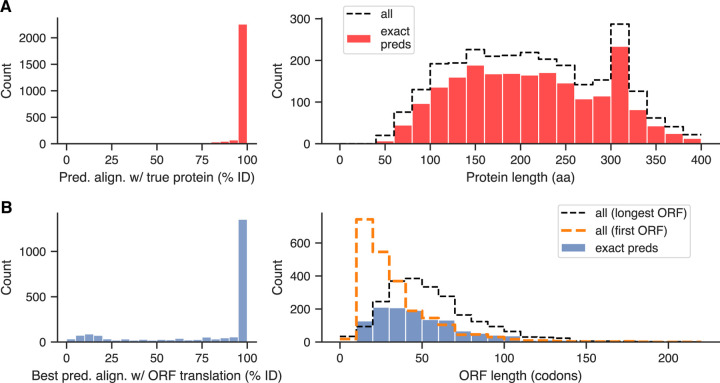
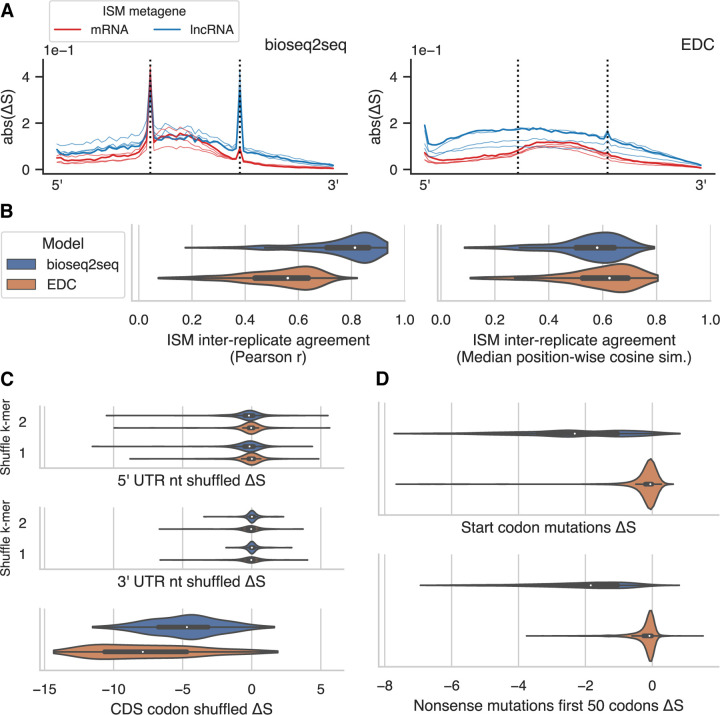
Ribosomes are information-processing macromolecular machines that integrate complex sequence patterns in messenger RNA (mRNA) transcripts to synthesize proteins. Studies of the sequence features that distinguish mRNAs from long noncoding RNAs (lncRNAs) may yield insight into the information that directs and regulates translation. Computational methods for calculating protein-coding potential are important for distinguishing mRNAs from lncRNAs during genome annotation, but most machine learning methods for this task rely on previously known rules to define features. Sequence-to-sequence (seq2seq) models, particularly ones using transformer networks, have proven capable of learning complex grammatical relationships between words to perform natural language translation. Seeking to leverage these advancements in the biological domain, we present a seq2seq formulation for predicting protein-coding potential with deep neural networks and demonstrate that simultaneously learning translation from RNA to protein improves classification performance relative to a classification-only training objective. Inspired by classical signal processing methods for gene discovery and Fourier-based image-processing neural networks, we introduce LocalFilterNet (LFNet). LFNet is a network architecture with an inductive bias for modeling the three-nucleotide periodicity apparent in coding sequences. We incorporate LFNet within an encoder-decoder framework to test whether the translation task improves the classification of transcripts and the interpretation of their sequence features. We use the resulting model to compute nucleotide-resolution importance scores, revealing sequence patterns that could assist the cellular machinery in distinguishing mRNAs and lncRNAs. Finally, we develop a novel approach for estimating mutation effects from Integrated Gradients, a backpropagation-based feature attribution, and characterize the difficulty of efficient approximations in this setting.

Keywords: Fourier Transform; Interpretable Deep Learning; Long Noncoding RNAs; Post-Transcriptional regulation; Protein-Coding Potential; Token Mixing Neural Networks.


Conflict of interest statement

6Competing Interest Statement The authors have no competing interests to declare.

Figures

Figure 1.
Figure 1.
Overview of problem setting and computational method. (A) Summary of messenger RNA functional regions and known elements regulating translation. See (Gebauer and Hentze 2004) for a review of known regulatory elements. (B) Neural network sequence-to-sequence architecture. We designed LFNet (left) to apply a learned filter matrix W to a 1D short-time Fourier transform (spectrogram) of the hidden representations, enabling frequency-domain filtering of the 3-base periodicity present in coding sequences. We trained this architecture for two problem settings: in Encoder-Decoder Classifier (EDC), the expected output is a classification token, for bioseq2seq, the protein translation is also predicted.
Figure 2.
Figure 2.
Analysis of translation products predicted by best bioseq2seq replicate. (A) Global alignment identity between the top-beam protein decoding predicted by bioseq2seq for true positive mRNAs and the ground truth protein (left), and length distribution of perfect translations (right). Black dashed line indicates the complete distribution of protein lengths. (B) Highest global identity found from all-by-all alignment of the three-frame translation of a lncRNA with its lower-beam ⟨PC⟩ + peptide predictions from bioseq2seq (left) and length distribution of perfectly translated sORFs (right). Black dashed line indicates the length distribution of hypothetical translations of the longest ORF found in each lncRNA and orange dashed line denotes the same for the most 5’ ORF.
Figure 3.
Figure 3.
Frequency-domain content in model representations. LFNet filters from selected layers, with complex filter weights visualized in terms of magnitude ( bioseq2seq in panel A, EDC in B ) and phase (bioseq2seq in C, EDC in D). For each layer heatmap, the x-axis represents the hidden embedding dimension, and the y-axis refers to a discrete frequency bin, with annotations for the equivalent nucleotide periodicity. Both model types learned weights with a pronounced structure around 3-nt periodicity, visible mostly clearly in the phase for bioseq2seq and in the magnitude for EDC. (E) A nucleotide-resolution metagene consisting of average encoder-decoder attention scores from mRNAs aligned relative to their start codons. Attention distributions for this plot were taken from head 6 of the lower bioseq2seq decoder layer, which primarily attends to the start codon and places attention downstream of the start in a periodic fashion. (F) The equivalent plot for the same attention head applied to lncRNAs aligned relative to the start of the longest ORF, illustrating the loss of attention rhythmicity downstream of the leading spike.
Figure 4.
Figure 4.
Predicted mutation effects by model type on a subset of testing data. (A) Metagene plots of saturated in silico mutagenesis (ISM) ∆S scores, i.e. the difference in log(P (⟨PC⟩)/P (⟨NC⟩)) between single-nucleotide variants and their wild-type sequence. The absolute value of ∆S was averaged within each of 25 positional bins and across all three possible mutations in each position, with mRNAs and lncRNAs depicted separately for both bioseq2seq (left) and EDC (right). Vertical dashed lines denote the first and last bin of the CDS for mRNAs and the longest ORF for lncRNAs. Metagenes from all four replicates are shown, with the best-performing model colored using the darkest hue. (B) Per-transcript average of Pearson correlation (left) and median position-specific cosine similarity (right) of ISM scores from pairwise comparison of model replicates. (C) Changes in score relative to wildtype for mRNAs shuffled within each functional region. UTRs were shuffled to preserve mononucleotide or dinucleotide frequencies. Codon shuffling excluded the start and stop codons to preserve CDS length. (D) Changes in score for mRNAs from nucleotide substitutions that knock out a start codon or introduce a stop codon within the first 50 codons of the CDS. Note: panels C and D follow the legend from panel B.
Figure 5.
Figure 5.
Detailed analysis of in silico mutagenesis (ISM) on the full test set. (A) Plots of ISM metagenes for selected amino acids lysine (left) and glycine (right). Mean ∆S is shown for 25 positional bins across mRNA CDS regions with mutations listed based on the resulting codon. The red line represents the average across all missense/nonsynonymous mutations. For amino acids with more than two codons, the blue dashed line depicts the average synonymous mutation for comparison. (B) Mean ISM for synonymous point mutations by codon position and nucleotide. X’s denote substitutions which do not exist as synonymous changes. (C) An example protein-coding transcript with NCBI accession NM_001015628.1. Signed ISM scores for the transcript are depicted as a heatmap and the RNA sequence is portrayed with characters scaled according to the ↑ PC importance strategy, i.e. regions with highly negative ISM weights depicted in dark blue. The subregions shown are windows around the start codon, the position of maximum importance, and the stop codon, respectively. (D) Same as panel B with an example long noncoding RNA with NCBI accession NR_126388.1. The endogenous sequence is scaled according to ↑ NC, or highly positive ISM values drawn in dark red. (E) mRNA motifs discovered in our test set with STREME using ISM importance values from bioseq2seq to determine sequence regions in which to search for enriched signals. Annotations denote the importance and control strategy for each trial, with boldfaced annotations signifying that importance values were not masked and ordinary typeface indicating that feature importance at start and stop codons and nonsense mutations were excluded. Motifs are positioned near the regions in which they were enriched. (F) Same as panel D showing discovered lncRNA motifs.
Figure 6.
Figure 6.
Gradient-based approximation performance. (A) Summary results from tuning of β hyperparameter for MDIG alongside baseline methods. Inter-replicate agreement is shown on the x-axis and correlation with ISM on the y-axis, using the median across transcripts as a point estimate for both metrics. (B) Scatter plot of ∆S for all possible synonymous point mutations, i.e. every wildtype>variant pair differing at one position, from MDIG on the training set (x-axis) versus the same for ISM on the test set. (C) mRNA motifs discovered in our training set with STREME using MDIG importance values from bioseq2seq to determine sequence regions in which to search for enriched signals. Results from unmasked importance are shown above the transcript diagram and those from the masked trials are shown below. (D) lncRNA motifs discovered in the training set using MDIG importance values from bioseq2seq, depicted in the same manner as panel C.

References

    1. Agarwal V and Kelley DR. 2022. The genetic and biochemical determinants of mRNA degradation rates in mammals. Genome Biology. 23: 245. - PMC - PubMed
    1. Anastassiou D. 2000. Frequency-domain analysis of biomolecular sequences. Bioinformatics. 16: 1073–1081. - PubMed
    1. Anderson DM et al. 2015. A Micropeptide Encoded by a Putative Long Noncoding RNA Regulates Muscle Performance. Cell. 160: 595–606. - PMC - PubMed
    1. Avsec, Agarwal V, Visentin D, Ledsam JR, Grabska-Barwinska A, Taylor KR, Assael Y, Jumper J, Kohli P, and Kelley DR. 2021. Effective gene expression prediction from sequence by integrating long-range interactions. Nature Methods. 18: 1196–1203. - PMC - PubMed
    1. Avsec, Weilert M, et al. 2021. Base-resolution models of transcription-factor binding reveal soft motif syntax. Nature Genetics. 53: 354–366. - PMC - PubMed

Publication types