[Preprint]. 2023 Apr 21:2023.04.06.535853.
doi: 10.1101/2023.04.06.535853.

Intestinal transit amplifying cells require METTL3 for growth factor signaling, KRAS expression, and cell survival

Affiliations

Intestinal transit amplifying cells require METTL3 for growth factor signaling, KRAS expression, and cell survival

Charles H Danan et al. bioRxiv. .

Update in

Abstract

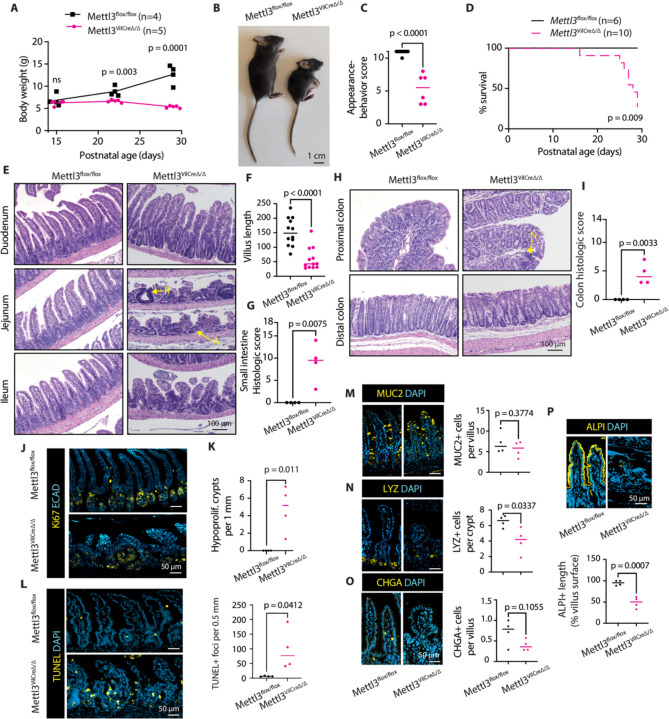
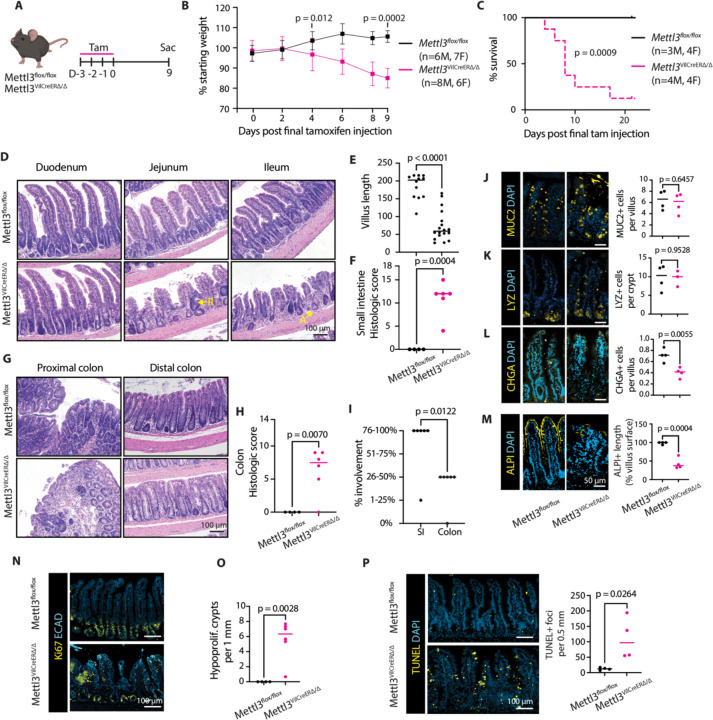
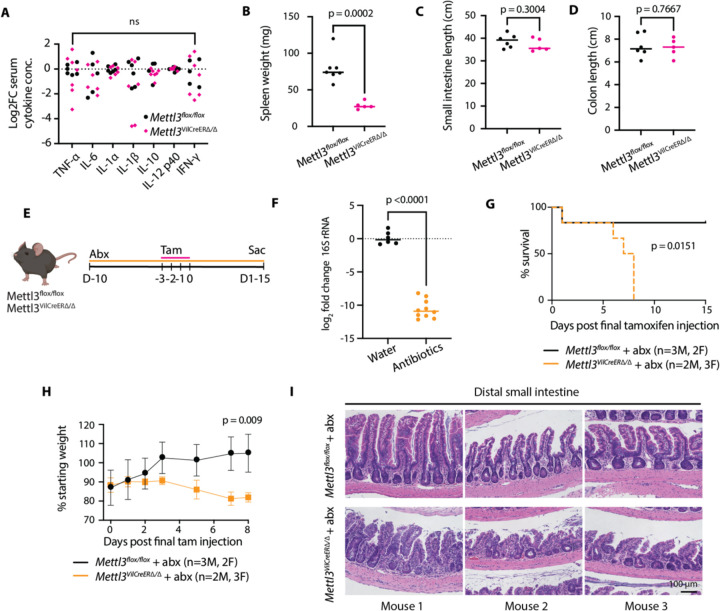
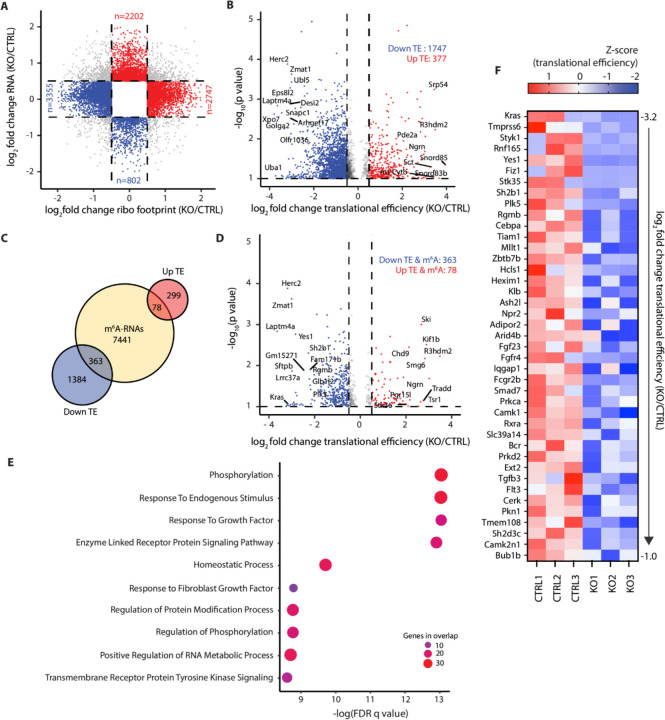
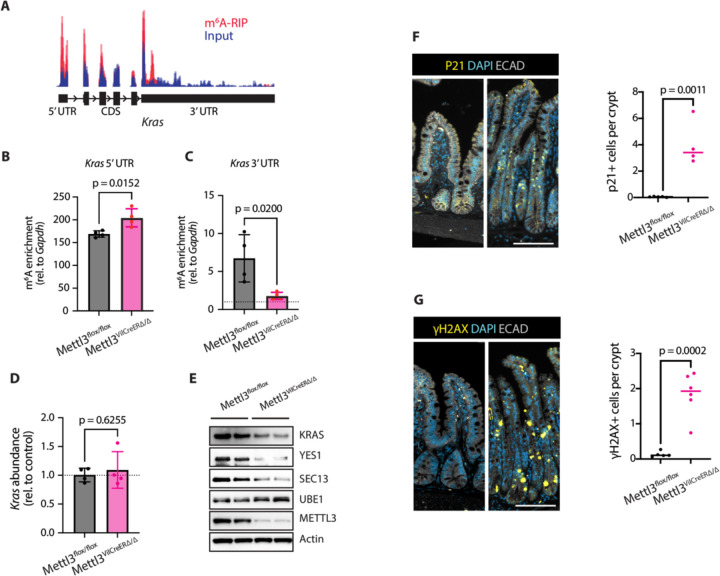
Intestinal epithelial transit amplifying cells are essential stem progenitors required for intestinal homeostasis, but their rapid proliferation renders them vulnerable to DNA damage from radiation and chemotherapy. Despite their critical roles in intestinal homeostasis and disease, few studies have described genes that are essential to transit amplifying cell function. We report that the RNA methyltransferase, METTL3, is required for survival of transit amplifying cells in the murine small intestine. Transit amplifying cell death after METTL3 deletion was associated with crypt and villus atrophy, loss of absorptive enterocytes, and uniform wasting and death in METTL3-depleted mice. Ribosome profiling and sequencing of methylated RNAs in enteroids and in vivo demonstrated decreased translation of hundreds of unique methylated transcripts after METTL3 deletion, particularly transcripts involved in growth factor signal transduction such as Kras. Further investigation confirmed a novel relationship between METTL3 and Kras methylation and protein levels in vivo. Our study identifies METTL3 as an essential factor supporting the homeostasis of small intestinal tissue via direct maintenance of transit amplifying cell survival. We highlight the crucial role of RNA modifications in regulating growth factor signaling in the intestine, with important implications for both homeostatic tissue renewal and epithelial regeneration.


Conflict of interest statement

Conflict-of-interest statement Premal Shah is a member of the Scientific Advisory Board of Trestle Biosciences and is Director at Ananke Therapeutics. All other authors declare they have no competing interests.

Figures

Figure 1.
Figure 1.. Constitutive METTL3 deletion leads to growth retardation and small intestinal epithelial distortion.
(A) Growth curves from postnatal day 15 to 29. (B) Gross appearance at postnatal day 29. (C) Composite appearance and behavior score at postnatal day 29. (D) Kaplan-Meier survival curves through postnatal day 29; p value corresponds to Log-rank (Mantel-Cox) test. (E) Representative small intestine H&E images. “R” indicates regenerative crypt. “A” indicates atrophic crypt. (F) Quantification of jejunal villus lengths, n=4 mice per genotype. (G) Composite histological score for small intestine (H) Representative colon H&E images. “N” denotes neutrophil invasion. (I) Composite histological score for colon (J) Representative images of Ki67 in distal small intestine (K) Number of hypo-proliferative crypts (<10 Ki67+ cells) crypts per 1 mm distal half small intestine (L) Representative images and quantification of TUNEL staining (M, N, O) Representative images and quantification of intestinal secretory markers MUC2, LYZ, and CHGA (P) Representative images and quantification of alkaline phosphatase. Unless otherwise noted, each data point is the mean of three representative sections imaged per mouse with bar at median value and p value represents unpaired parametric Student’s t test. Immunofluorescence staining and quantification performed in distal half small intestine.
Figure 2.
Figure 2.. METTL3 is required for survival and small intestinal epithelial homeostasis in adult mice.
(A) Experimental schematic depicting timing of tamoxifen injection. (B) Weight curves through nine days post tamoxifen injection, mean +/− SD. (C) Kaplain-Meier survival curves through 22 days post final tamoxifen injecition, p value corresponds to Log-rank (Mantel-Cox) test. (D) Representative small intestine H&E images. “R” indicates regenerative crypt. “A” indicates atrophic crypt. (E) Quantification of shortest villus lengths in three representative jejunal sections in Mettl3flox/flox (n=4) and Mettl3VilCreERΔ/Δ (n=6) mice. (F) Composite histological score for small intestine. (G) Representative colon H&E images. (H) Composite histological score for colon. (I) Greatest percent involvement for histological score depicted in F or H. (J, K, L) Representative images and quantification of intestinal secretory markers MUC2, LYZ, and CHGA. (M). Representative images and quantification of alkaline phosphatase activity. (N) Representative images of Ki67 (O) Number of hypo-proliferative (<10 Ki67+ cells) crypts per 1mm intestine (P) Representative images and quantification of TUNEL staining. Unless otherwise noted, each data point is the mean of three representative sections per mouse with bar at median value and p value represents unpaired parametric Student’s t test. Immunofluorescence staining and quantification performed in distal half small intestine.
Figure 3.
Figure 3.. Intestinal distortion and mortality after METTL3 deletion is microbiota independent.
(A) Log2 fold change in serum cytokines in mice nine days post final tamoxifen injection, ns indicates p > 0.05 for all. (B) Spleen weight nine days post final tamoxifen injection. (C, D) Small intestine and colon length nine days post final tamoxifen injection. (E) Experimental schematic for antibiotic (abx) treatment. (F) Log2 fold change in 16S rRNA amplified from fecal bacterial DNA on final day of tamoxifen injection in antibiotic-treated or water vehicle mice. (G, H) Kaplain-Meier survival curve and weight change post final tamoxifen injection in antibiotic treated mice. P-value in (G) represents Log-rank (Mantel-Cox) test. Data in (H) presented as mean +/− SD (I) Representative H&E images from matched sections of distal small intestine in n=3 antibiotic treated mice per genotype. Unless otherwise noted, each data point represents a single mouse with bar at median value and p denotes value of unpaired parametric Student’s t test.
Figure 4.
Figure 4.. METTL3 deletion rapidly induces death of transit amplifying cells.
(A) Experimental schematic. (B) Representative images and quantification of crypt height. (C) Representative images and quantification of Ki67 staining. (D) Log2 fold change in qPCR quantification of indicated genes normalized to the mean of Mettl3flox/flox controls and Actb. Data from crypt enriched lysates. (E) Representative images and quantification of TUNEL staining (F) Representative image and quantification of distribution of TUNEL staining in villus, transit amplifying (TA) zone, and crypt base. Unless otherwise noted, each data point is the mean of three representative sections per mouse with bar at median value and p denotes value of unpaired parametric Student’s t test. Scale bar 100 µM. All data from distal small intestine of mice two days post final tamoxifen injection.
Figure 5.
Figure 5.. METTL3 deletion triggers growth arrest and death in intestinal epithelial enteroids and colonoids.
(A) Intestinal epithelial enteroids or colonoids were treated with 1 µm 4-OHT 48 and 24 hours before beginning of time course and analyzed at days 1 through 5. (B) Percent live enteroids or colonoids from indicated tissue regions at 5 days post 4-OHT treatment. Each point represents n=9 technical replicates across n=3 passage separated biological replicates per genotype. Bar height at median value with error bars as +/− SD. (C) Representative images at 5 days post 4-OHT treatment corresponding to quantification in (B). (D) Western blot for METTL3 in surviving Mettl3VilCreERΔ/Δ distal colonoids six days after 4-OHT treatment. (E) Representative images of ileal enteroids in the five days post 4-OHT treatment. (F, G) ImageJ quantification of average ileal enteroid 2D area and percent live enteroids in the five days post 4-OHT treatment of Villin-CreERT2 (VilCreERT2) and Mettl3VilCreERΔ/Δ enteroids. N=3 passage separated replicates. Data presented as mean +/− SD. P-value represents unpaired parametric Student’s t test at day 3 and day 5.
Figure 6.
Figure 6.. METTL3 deletion leads to a global decrease in mRNA translational efficiency with impacts on growth factor signaling.
(A) Scatter plot of log2 fold change in ribosome footprint and total transcript abundance for all transcripts detected in RNA-seq and Ribo-seq of Mettl3flox/flox (CTRL) and Mettl3VilCreERΔ/Δ (KO) ileal enteroids 72 hours post initiation of 4-OHT treatment. Log2 fold change cut off >0.5 or <−0.5. Red marks transcripts increased in RNA or ribosome footprint abundance only. Blue marks decreases in RNA or ribosome footprint abundance only. Grey marks transcripts changed in both. (B) Volcano plot of all transcripts with log2 fold change in translational efficiency (TE) >0.5 or <−0.5 and −log10 p value >1. Red marks all transcripts with increased TE and blue marks all transcripts with decreased TE. (C) Venn diagram depicting fraction of transcripts with changes in TE and at least one m6A peak as determined by m6A-seq of wildtype mouse small intestinal crypt epithelium. Yellow circle is all m6A-methylated transcripts detected by m6A-seq. Blue circle is all transcripts with decreased TE from (B). Red circle is all transcripts with increased TE from (B). (D) Volcano plot of all transcripts displayed in (B), now filtered for transcripts containing at least one m6A peak. (E) Pathway enrichment analysis comparing transcripts with downregulated TE (log2FC < −1) and at least one m6A peak against Gene Ontology Biological Process (GOBP) gene sets. Circle color and size both scale with number of genes overlapping between the tested gene set and the GOBP gene set. (F) Heat map depicting Z-scores for TE in three Mettl3flox/flox (CTRL) and three Mettl3VilCreERΔ/Δ (KO) replicates 72 hours post initiation of 4-OHT treatment. Genes presented are all 42 genes from the four most significantly enriched pathways in (E). Genes are presented in order of greatest decrease in mean TE to smallest. All data from RNA-seq and Ribo-seq of Mettl3flox/flox (CTRL) and Mettl3VilCreERΔ/Δ (KO) ileal enteroids 72 hours post initiation of 4-OHT treatment.
Figure 7.
Figure 7.. METTL3 deletion downregulates KRAS and induces cellular senescence.
(A) Integrated Genomics Viewer depiction of read density for m6A-RIP (red) and input RNA (blue) for the Kras transcript as determined by m6A-seq in distal small intestinal crypts of n=3 wildtype mice. (B, C) m6A-enrichment determined by m6A-RIP-qPCR with primers targeting Kras 5’ and 3’ UTR in crypt enriched lysates from Mettl3flox/flox and Mettl3VilCreERΔ/Δ mice 3 days post-tamoxifen (n=2M, 2F per genotype). The m6A enrichment score is the result of dividing the ratio of the target-of-interest in RIP compared to RIP input by the ratio of Gapdh (negative control) in RIP compared to RIP input. Data presented as median +/− SD. P-value represents unpaired parametric Student’s t test. (D) qPCR for Kras transcript in crypt enriched lysates from Mettl3flox/flox and Mettl3VilCreERΔ/Δ mice 3 days post-tamoxifen (n= 2M, 2F per genotype). Data normalized to Actb and the mean of Mettl3flox/flox controls. Data presented as median +/− SD. P-value represents unpaired parametric Student’s t test. (E) Western blot for top targets with downregulated TE in crypts of Mettl3flox/flox and Mettl3VilCreERΔ/Δ mice two days post final tamoxifen injection (n=2 mice per genotype). (F, G) Representative images and quantification of p21 and γH2AX staining in distal half small intestine of Mettl3flox/flox and Mettl3VilCreERΔ/Δ mice two days post final tamoxifen injection. Images and quantification from areas of most severe histological distortion in distal small intestine of mice two days post final tamoxifen injection. Each data point is the mean of three representative sections imaged per mouse with bar at median value and p denotes value of unpaired parametric Student’s t test. Scale bar 100 µM.
Figure 8.
Figure 8.. METTL3 maintains growth factor signaling and survival in intestinal transit amplifying cells.
Proposed model. METTL3 methylates Kras and other transcripts involved in transducing growth factor signaling. Methylation promotes translation of these transcripts, enhancing proliferation and survival in transit amplifying (TA) cells downstream of external growth factors. In the absence of METTL3, a decreased response to extracellular growth factors in METTL3 knockout TA cells leads to cellular senescence and death. Loss of transit amplification results in reduced crypt and villus size and diminished production of absorptive cells. ECM, extra cellular matrix. RTK, receptor tyrosine kinase.

References

    1. Peterson LW, Artis D. Intestinal epithelial cells: Regulators of barrier function and immune homeostasis. Nat. Rev. Immunol. 2014;14(3):141–153. - PubMed
    1. Gehart H, Clevers H. Tales from the crypt: new insights into intestinal stem cells [Internet]. Nat. Rev. Gastroenterol. Hepatol. 2019;16(1):19–34. - PubMed
    1. Yousefi M, Li L, Lengner CJ. Hierarchy and Plasticity in the Intestinal Stem Cell Compartment. Trends Cell Biol. 2017;27(10):753–764. - PMC - PubMed
    1. Sanman LE et al. Transit-Amplifying Cells Coordinate Changes in Intestinal Epithelial Cell-Type Composition [Internet]. Dev. Cell 2021;56(3):356–365.e9. - PMC - PubMed
    1. Ding X et al. Crypt Base Columnar Stem Cells in Small Intestines of Mice Are Radioresistant. Gastroenterology 2012;16(3):387–393. - PMC - PubMed

Publication types