[Preprint]. 2024 Apr 25:2023.04.03.535373.
doi: 10.1101/2023.04.03.535373.

An acute microglial metabolic response controls metabolism and improves memory

Affiliations

An acute microglial metabolic response controls metabolism and improves memory

Anne Drougard et al. bioRxiv. .

Update in

  • An acute microglial metabolic response controls metabolism and improves memory.
    Drougard A, Ma EH, Wegert V, Sheldon R, Panzeri I, Vatsa N, Apostle S, Fagnocchi L, Schaf J, Gossens K, Völker J, Pang S, Bremser A, Dror E, Giacona F, Sagar S, Henderson MX, Prinz M, Jones RG, Pospisilik JA. Drougard A, et al. Elife. 2024 Dec 3;12:RP87120. doi: 10.7554/eLife.87120. Elife. 2024. PMID: 39625057 Free PMC article.

Abstract

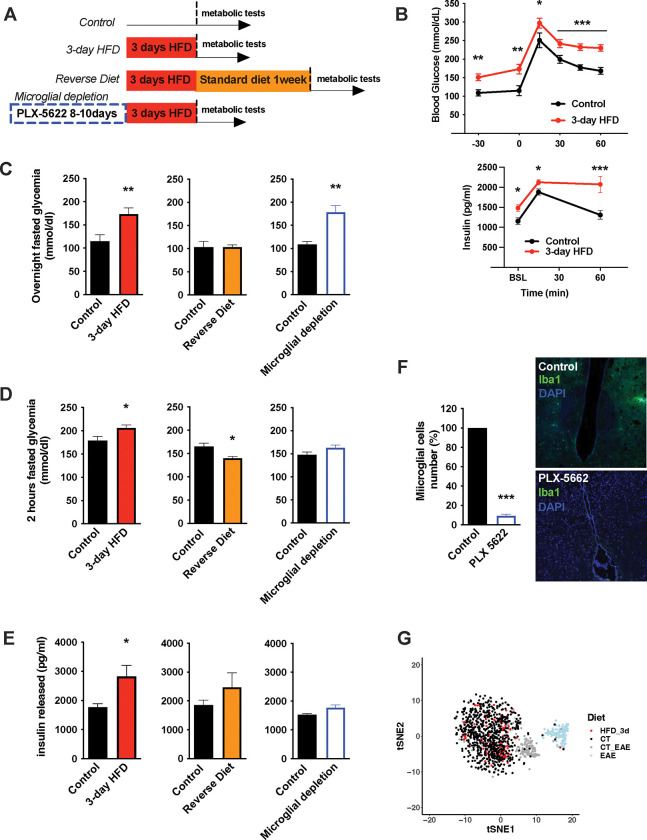
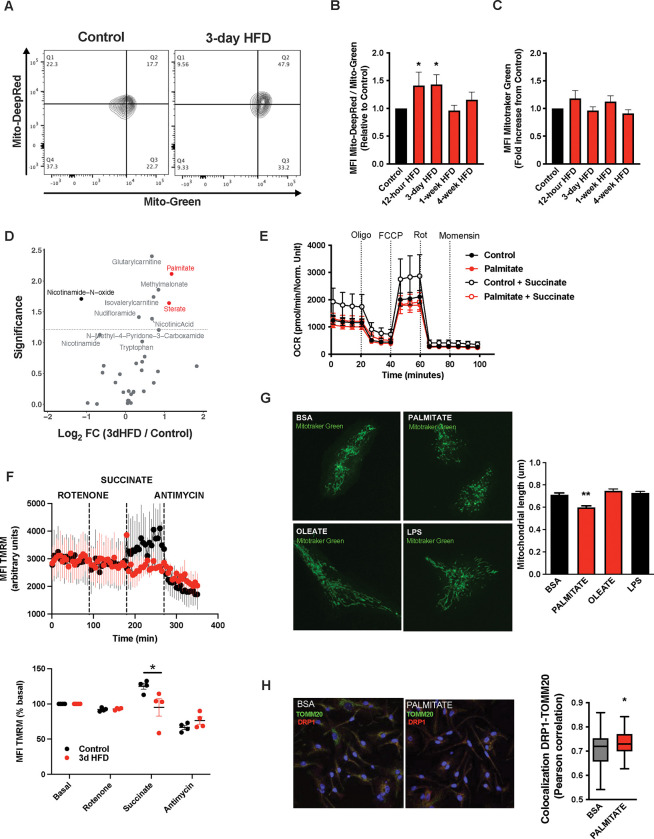
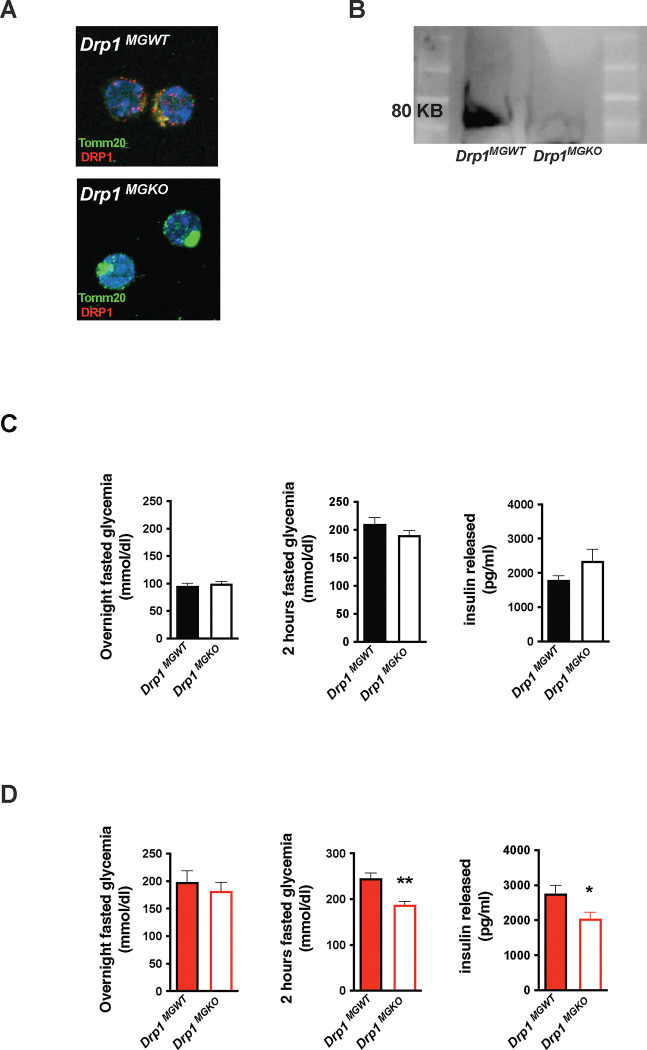
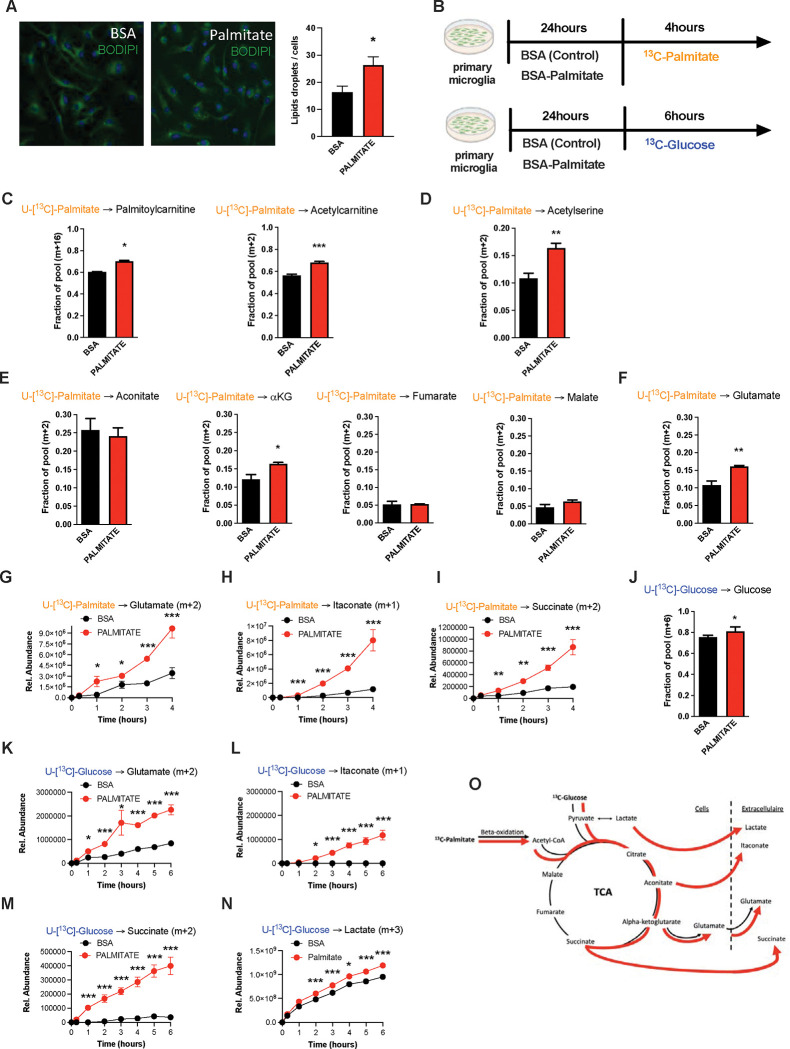
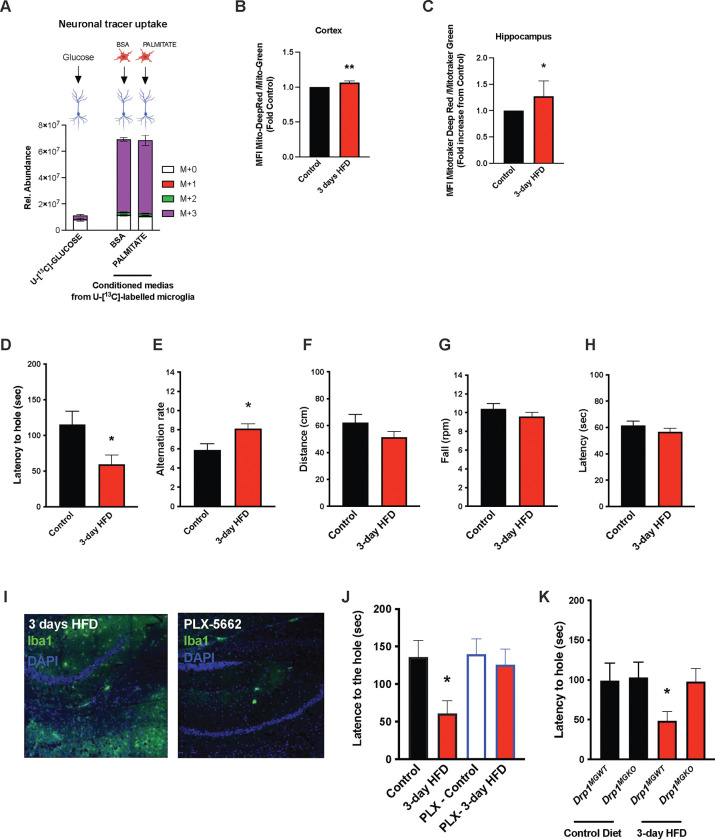
Chronic high-fat feeding triggers chronic metabolic dysfunction including obesity, insulin resistance, and diabetes. How high-fat intake first triggers these pathophysiological states remains unknown. Here, we identify an acute microglial metabolic response that rapidly translates intake of high-fat diet (HFD) to a surprisingly beneficial effect on metabolism and spatial / learning memory. High-fat intake rapidly increases palmitate levels in cerebrospinal fluid and triggers a wave of microglial metabolic activation characterized by mitochondrial membrane activation and fission as well as metabolic skewing towards aerobic glycolysis. These effects are detectable throughout the brain and can be detected within as little as 12 hours of HFD exposure. In vivo, microglial ablation and conditional DRP1 deletion show that the microglial metabolic response is necessary for the acute effects of HFD. 13C-tracing experiments reveal that in addition to processing via β-oxidation, microglia shunt a substantial fraction of palmitate towards anaplerosis and re-release of bioenergetic carbons into the extracellular milieu in the form of lactate, glutamate, succinate, and intriguingly, the neuro-protective metabolite itaconate. Together, these data identify microglia as a critical nutrient regulatory node in the brain, metabolizing away harmful fatty acids and releasing the same carbons as alternate bioenergetic and protective substrates for surrounding cells. The data identify a surprisingly beneficial effect of short-term HFD on learning and memory.


Figures

FIGURE 1:
FIGURE 1:. Acute HFD-induced metabolic changes are microglia dependent
A. Schematic depicting the different treatments and diets followed by the different mice groups. B. Graphs showing the Glucose Tolerance Test (OGTT) and the associated-insulin kinetic of C57Bl6/J male fed with control diet (Control) or fed with high fat diet for 3 days (3-day HFD) (n=8). C. Graph showing the overnight fasted glycemia from the mice groups depicting in the A. Schematic (n=5 to 11). D. Graph showing the 2hours-fasted glycemia from the mice groups depicting in the A. schematic (n=5 to 11). E. Graph showing the insulin released after a glucose gavage from the mice groups depicting in the A. schematic (n=5 to 11). F. Microglial cells staining with Iba1 (green) in the brain slices from mice fed with 3 days HFD or mice depleted from their microglial cells with 1 week control diet complexed with PLX-5662 prior the 3 days HFD (PLX-5662) (n=5). G. sgRNAseq dataset from hypothalamic microglia cells harvested from C57bl6/J male mice fed with control diet (CT) and High Fat Diet for 3 days (HFD_3d) (n=5) merged with sgRNAseq microglia dataset from mice presenting an Experimental Autoimmune Encephalomyelitis (EAE). Data are presented as mean ±SEM. *p<0.05, **p<0.01, ***p<0.001 as determined by two-tailed Student’s test and two-way ANOVA followed by Bonferroni post hoc test.
FIGURE 2:
FIGURE 2:. A rapid Microglial Mitochondria Response to high fat diet
A. Facs plots depicting the ratio Mitotraker Deep Red/ Mitotraker Green from sorted microglial cells of C57Bl6/J male fed with a control diet (Control) or fed with high fat diet for 3 days (3-day HFD). B. Graph showing the ratio Mitotraker Deep Red/ Mitotraker Green from sorted hypothalamic microglial cells of C57Bl6/J male fed with a control diet (Control) or fed with high fat diet for 12 hours,3 days or 1–4 weeks (n=5 to 12). C. Graph showing the Mitotraker Green fluorescence from sorted hypothalamic microglial cells of C57Bl6/J male fed with a control diet (Control) or fed with high fat diet for for 12 hours,3 days or 1–4 weeks (n=5 to 12). D. Volcano plot showing the metabolites content of cerebrospinal fluid from of C57Bl6/J male fed with a control diet (Control) or fed with high fat diet for 3 days (n=10). E. Seahorse (+/− succinate added in the media during the experiment) on primary microglia challenged for 24hours with BSA (control) or Palmitate (experiment replicated 3times). F. Mitochondrial Electron transport chain activity recorded with FACS after TMRM staining from sorted microglial cells of C57Bl6/J male fed with a control diet (Control) or fed with high fat diet for 3 days (n=5). G. Mitochondrial networks from primary microglia stained with Mitotraker green after being challenged for 24hours with BSA (control), Palmitate, Oleate or LPS (n=40) and the mitochondrial length quantification graphs. H. DRP1 colocalization with the mitochondrial network stained with TOMM20 on primary microglial cell after being challenged for 24hours with BSA (control) and Palmitate(n=40) and the colocalization quantification graphs. Data are presented as mean ±SEM. *p<0.05, **p<0.01, ***p<0.001 as determined by two-tailed Student’s test and two-way ANOVA followed by Bonferroni post hoc test.
FIGURE 3:
FIGURE 3:. aMMR is required for diet induced homeostatic rewiring in vivo
A. Immunostaining of TOMM20 and DRP1 on sorted microglia from mice Drp1MGWT or Drp1MGKO B. Western Blot against DRP1 on sorted microglia from mice Drp1MGWT or Drp1MGKO C. Graphs showing the overnight fasted glycemia, the 2hours fasted glycemia and the insulin released from Drp1MGWT or Drp1MGKO fed with control diet (n=5 to 11). D. Graphs showing the overnight fasted glycemia, the 2hours fasted glycemia and the insulin released from Drp1MGWT or Drp1MGKO fed with 3 day high fat diet (n=5 to 11). Data are presented as mean ±SEM. *p<0.05, **p<0.01, ***p<0.001 as determined by two-tailed Student’s test and two-way ANOVA followed by Bonferroni post hoc test.
FIGURE 4:
FIGURE 4:. Palmitate induces a novel microglial lactate/succinate/itaconate release pathway.
A. BODIPY staining on primary microglia challenged for 24hours with BSA or palmitate and the lipid droplets quantification graph. (n=20) B. Schematic depicting the timeline for the tracing experiments (13C-palmitate or 13C-glucose) on primary microglial challenged for 24hours with BSA or palmitate. C. 13C-palmitate incorporation into palmytoilcarnitine (m+16) and acetylcarnitine (m+2) after 4 hours tracing experiment on primary microglia pretreated for 24hours with BSA or palmitate (n=3). D. 13C-palmitate incorporation into acetyl serine (m+2) after 4 hours tracing experiment on primary microglia pretreated for 24hours with BSA or palmitate (n=3). E. 13C-palmitate incorporation into aconitate, alpha-ketoglutarate, fumarate, malate (m+2) after 4 hours tracing experiment on primary microglia pretreated for 24hours with BSA or palmitate (n=3). F. 13C-palmitate incorporation into glutamate (m+2) after 4 hours tracing experiment on primary microglia pretreated for 24hours with BSA or palmitate (n=3). G. 13C-palmitate incorporation into glutamate (m+2) released during the 4 hours tracing experiment by primary microglia pretreated for 24hours with BSA or palmitate (n=3). The results are graphed in relative abundance. H. 13C-palmitate incorporation into itaconate (m+1) released during the 4 hours tracing experiment by primary microglia pretreated for 24hours with BSA or palmitate (n=3). I. 13C-palmitate incorporation into succinate (m+2) released during the 4 hours tracing experiment by primary microglia pretreated for 24hours with BSA or palmitate (n=3). J. 13C-glucose incorporation into the intracellular glucose pool (m+6) after 6 hours tracing experiment on primary microglia pretreated for 24hours with BSA or palmitate (n=3). K. 13C-glucose incorporation into glutamate (m+2) released during the 6 hours tracing experiment by primary microglia pretreated for 24hours with BSA or palmitate (n=3). L. 13C-glucose incorporation into itaconate (m+1) released during the 6 hours tracing experiment by primary microglia pretreated for 24hours with BSA or palmitate (n=3). M. 13C-glucose incorporation into succinate (m+2) released during the 6 hours tracing experiment by primary microglia pretreated for 24hours with BSA or palmitate (n=3). N. 13C-glucose incorporation into lactate (m+3) released during the 6 hours tracing experiment by primary microglia pretreated for 24hours with BSA or palmitate (n=3). O. Schematic depicting the metabolic pathways used by the primary microglial challenged for 24hours with BSA (black arrow) or palmitate (red arrow) during the different tracing (13C-palmitate or 13C-glucose). Data are presented as mean ±SEM. *p<0.05, **p<0.01, ***p<0.001 as determined by two-tailed Student’s test and two-way ANOVA followed by Bonferroni post hoc test.
FIGURE 5:
FIGURE 5:. Acute HFD induces widespread MMR and rapid modulation of spatial and learning memory
A. Primary microglial cell media was collected after the 13C-glucose tracing (containing 13C-lactate released by microglia challenged with BSA or Palmitate) and incubated for 4 hours with primary neurons, the graph shows the 13C-lactate incorporation in the neurons in relative abondance, as control, primary neurons were incubated directly with 13C-glucose (n=6). B. Graph showing the ratio Mitotraker Deep Red/ Mitotraker Green from sorted cortical microglial cells of C57Bl6/J male fed with a control diet (Control) or fed with high fat diet for 3 days (3-day HFD) (n=5 to 12). C. Graph showing the ratio Mitotraker Deep Red/ Mitotraker Green from sorted hippocampic microglial cells of C57Bl6/J male fed with a control diet (Control) or fed with high fat diet for 3 days (3-day HFD) (n=5 to 12). D. Graph showing the latency during the Barnes Test from mice fed with normal diet (Control) or 3 days HFD (3-day HFD) (n=11). The test was performed in the VAI animals facility (USA). E. Graph showing the alternation during the T Maze Test from mice fed with normal diet (Control) or 3 days HFD (3-day HFD) (n=11). The test was performed in the VAI animals facility (USA). F. Graph showing the distance walked during the ROTAROD test from mice fed with normal diet (Control or 3 days HFD (3-day HFD) (n=11). G. Graph showing the number of turn before the mice fall during the ROTAROD test from mice fed with normal diet (Control) or 3 days HFD (3-day HFD) (n=11). H. Graph showing the latency during the ROTAROD test from mice fed with normal diet (Control) or 3 days HFD (3-day HFD) (n=11). I. Microglial staining with Iba1 (green) in the Hippocampus slices from mice fed with 3 days HFD or mice depleted from their microglial cells with 1 week control diet complexed with PLX-5662 prior the 3 days HFD (PLX-5662) (n=5). J. Graph showing the latency during the Barnes Test from mice fed with normal diet (Control) (n=4), mice fed with 3 days HFD (3-day HFD) (n=6), mice depleted from their microglial cells with 1 week control diet complexed with PLX-5662 (PLX-Control) (n=8) or mice depleted from their microglial cells with 1 week control diet complexed with PLX-5662 prior the 3 days HFD (PLX-3-day HFD) (n=5). K. Graph showing the latency during the Barnes Test from Drp1MGWT or Drp1MGKO mice fed with normal diet (Control diet ) or with 3 days HFD (3-day HFD) (n=11). Data are presented as mean ±SEM. *p<0.05, **p<0.01, ***p<0.001 as determined by two-tailed Student’s test and two-way ANOVA followed by Bonferroni post hoc test.

References

    1. Kleinridders A., Konner A.C., and Bruning J.C., CNS-targets in control of energy and glucose homeostasis. Curr Opin Pharmacol, 2009. 9(6): p. 794–804. - PubMed
    1. Grayson B.E., Seeley R.J., and Sandoval D.A., Wired on sugar: the role of the CNS in the regulation of glucose homeostasis. Nat Rev Neurosci, 2013. 14(1): p. 24–37. - PMC - PubMed
    1. Argente-Arizon P., et al., Glial cells and energy balance. J Mol Endocrinol, 2017. 58(1): p. R59–R71. - PubMed
    1. Pellerin L., et al., Evidence supporting the existence of an activity-dependent astrocyte-neuron lactate shuttle. Dev Neurosci, 1998. 20(4–5): p. 291–9. - PubMed
    1. Magistretti P.J. and Allaman I., Lactate in the brain: from metabolic end-product to signalling molecule. Nat Rev Neurosci, 2018. 19(4): p. 235–249. - PubMed

Publication types