[Preprint]. 2023 Apr 3:2023.04.03.535167.
doi: 10.1101/2023.04.03.535167.

Astrocytic Slc4a4 regulates blood-brain barrier integrity in healthy and stroke brains via a NO-CCL2-CCR2 pathway

Affiliations

Astrocytic Slc4a4 regulates blood-brain barrier integrity in healthy and stroke brains via a NO-CCL2-CCR2 pathway

Qi Ye et al. bioRxiv. .

Update in

Abstract

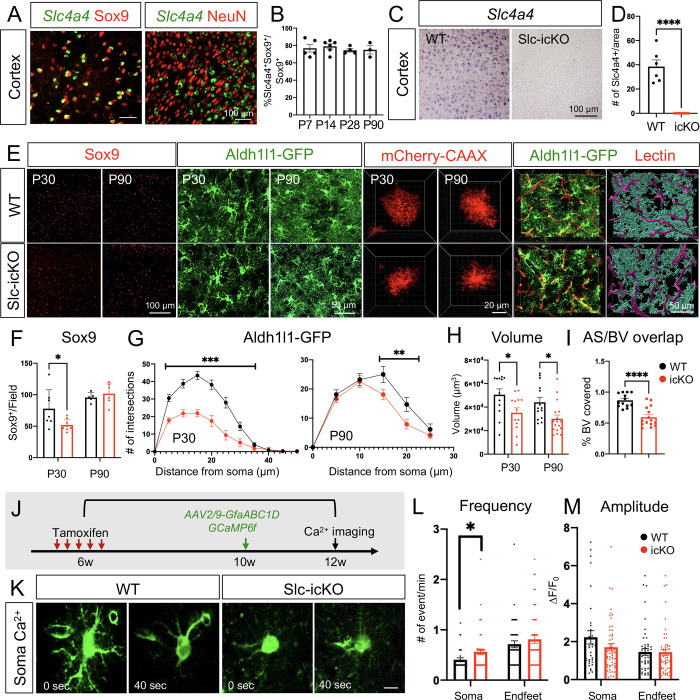
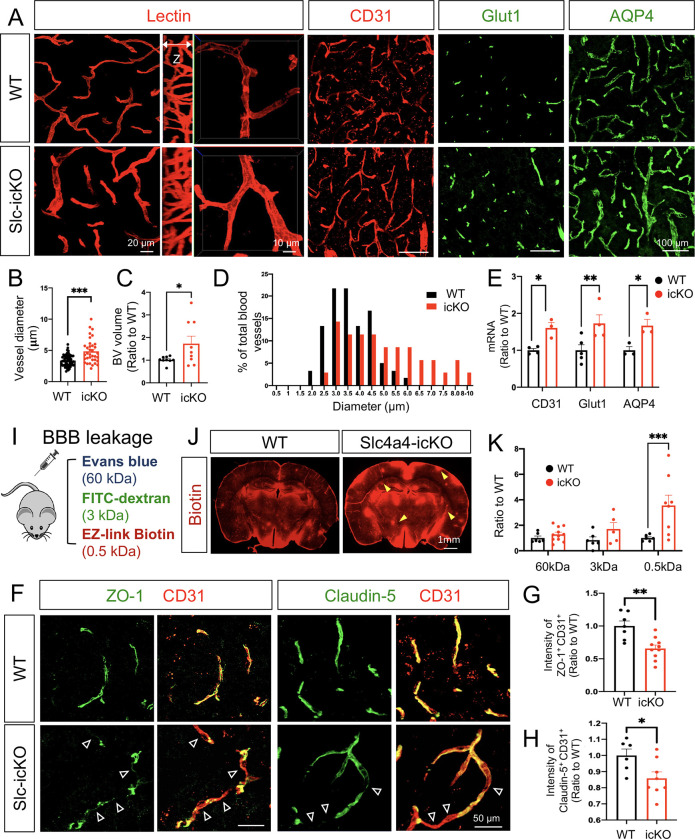
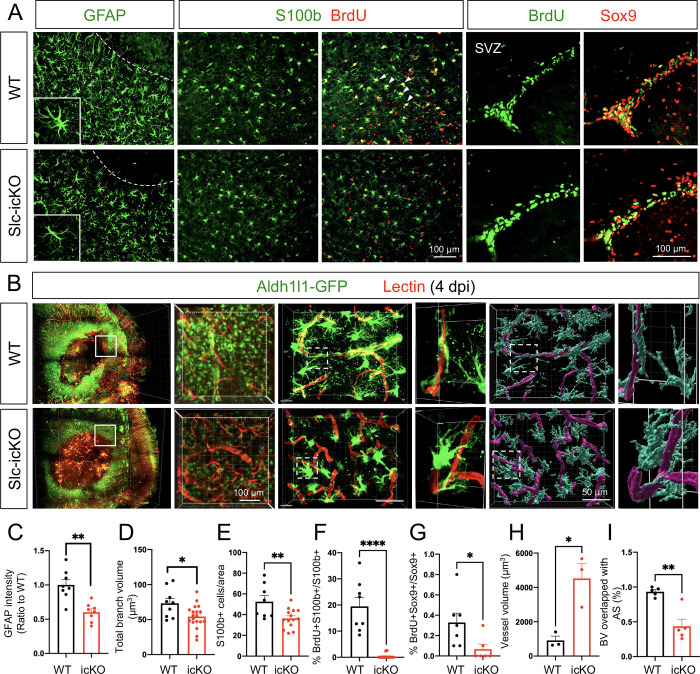
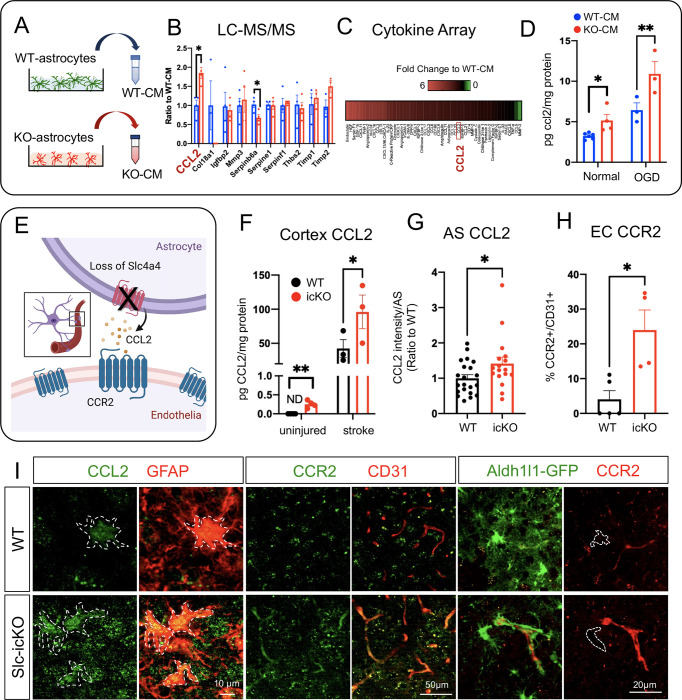
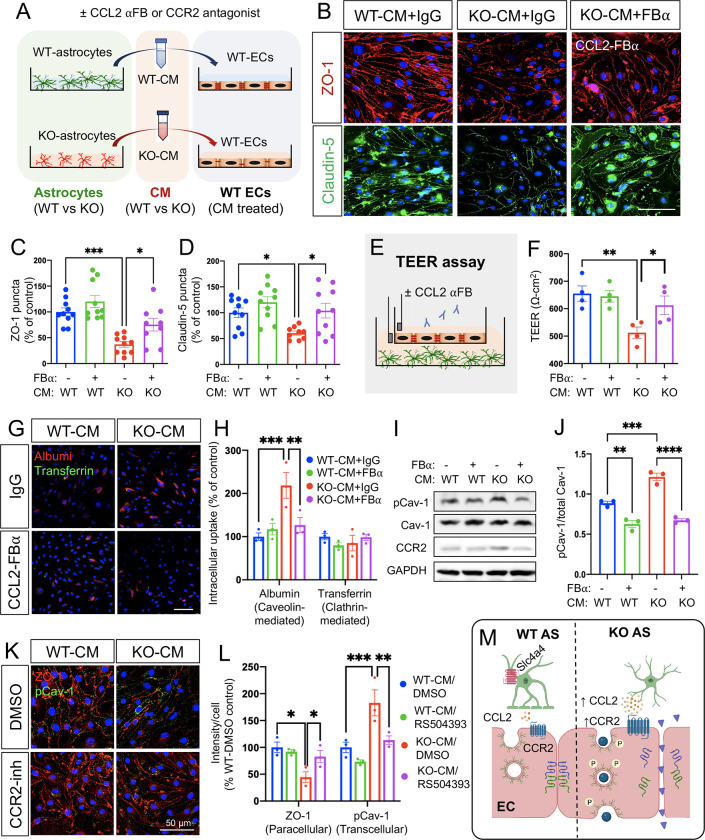
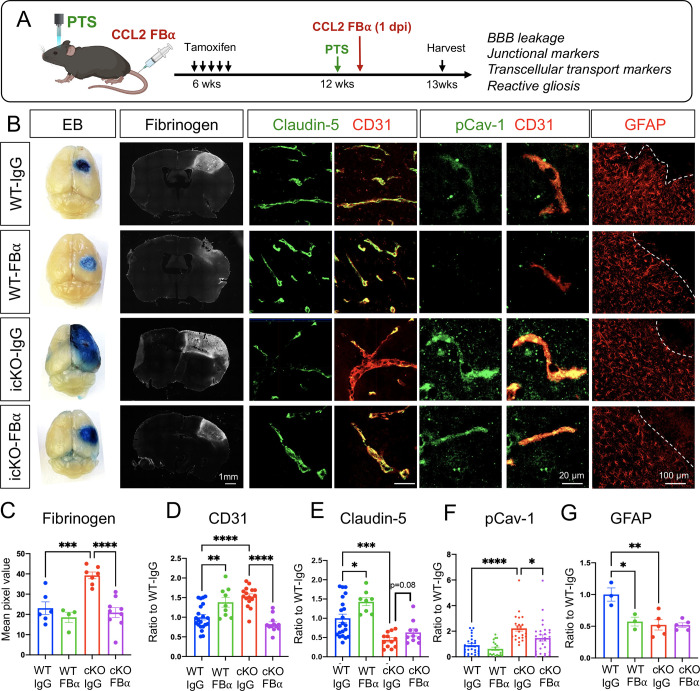
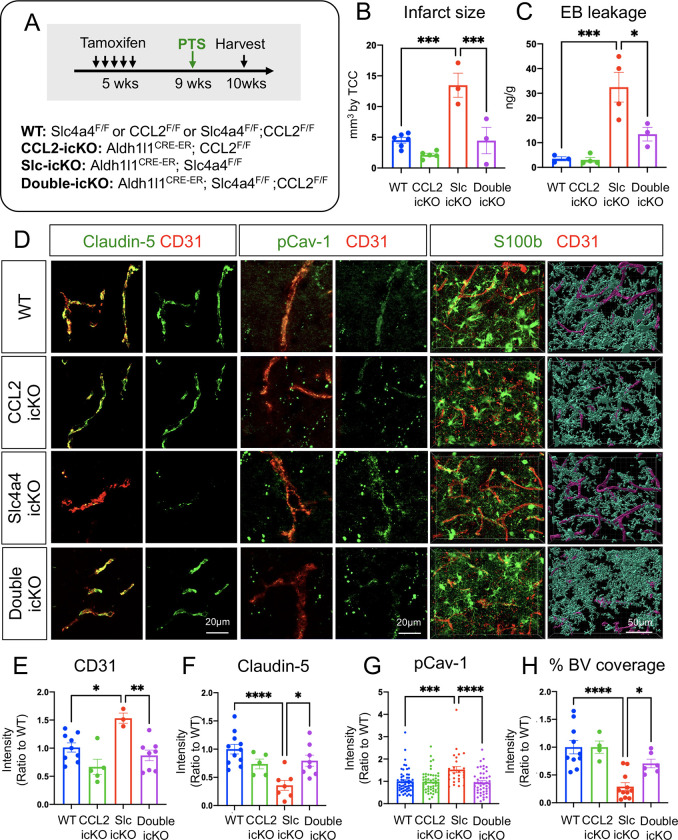
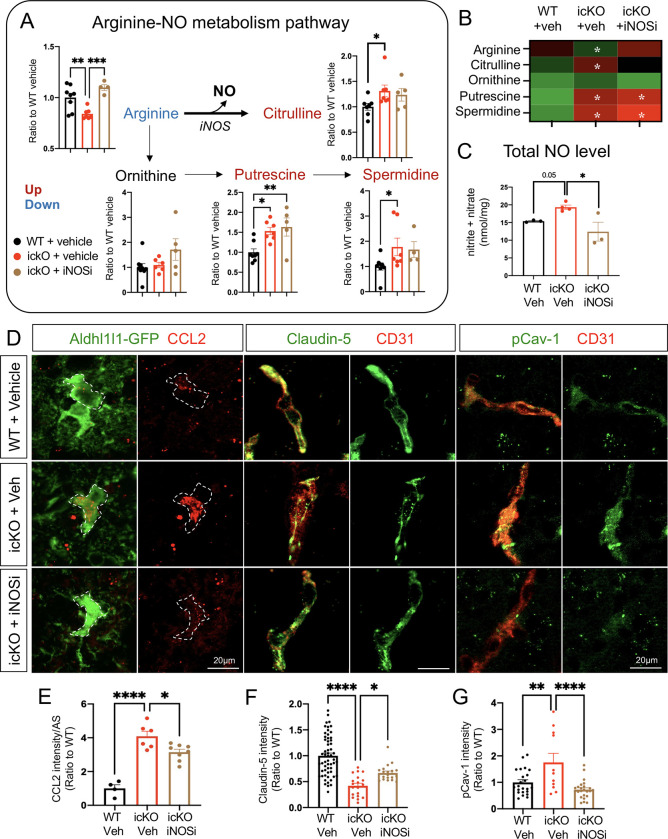
Astrocytes play vital roles in blood-brain barrier (BBB) maintenance, yet how they support BBB integrity under normal or pathological conditions remains poorly defined. Recent evidence suggests pH homeostasis is a new cellular mechanism important for BBB integrity. In the current study, we investigated the function of an astrocyte-specific pH regulator, Slc4a4, in BBB maintenance and repair. We show that astrocytic Slc4a4 is required for normal astrocyte morphological complexity and BBB function. Multi-omics analyses identified increased astrocytic secretion of CCL2 coupled with dysregulated arginine-NO metabolism after Slc4a4 deletion. Using a model of ischemic stroke, we found that loss of Slc4a4 exacerbates BBB disruption and reactive gliosis, which were both rescued by pharmacological or genetic inhibition of the NO-CCL2 pathway in vivo. Together, our study identifies the astrocytic Slc4a4-NO-CCL2 axis as a pivotal mechanism controlling BBB integrity and repair, while providing insights for a novel therapeutic approach against BBB-related CNS disorders.

Keywords: Astrocyte; CCL2; Nitric oxide; Slc4a4; blood-brain barrier; ischemic stroke; pH regulation.


Conflict of interest statement

Conflicts of interests Y.K.R. is the founder of pHLIP Inc., but the company did not fund any part of the work reported here. The authors declare no other competing interests.

Figures

Figure 1.
Figure 1.. Slc4a4 is required for astrocytogenesis, morphological complexity and proper Ca2+ propagation.
(A) Double in situ-immunofluorescence staining of Slc4a4 in astrocyte lineage (Sox9) and neuronal lineage (NeuN) in P28 mouse cortex. (B) Quantification of the number of Slc4a4-expressing astrocytes (Slc4a4+Sox9+) in cortex during development through adulthood. Data are presented as mean ± SEM. Each data point represents an individual animal. N = 3–5 for each age. (C-D) In situ hybridization confirms deletion of Slc4a4 in the cortex. (E) Immunofluorescence staining of astrocyte markers (Sox9, Aldh1l1-GFP) in the cortex from WT and Slc4a4-icKO mice at P30 or P90. Astrocyte morphology is labeled at single-cell resolution using AAV-PhP.eB -GfaABC1D-mCherry-CAAX by intracerebral injection at P1. Blood vessels were labeled by td-tomato lectin (red). Astrocyte-blood vessel interactions were reconstructed using IMARIS. (F) Quantification of the number of Sox9+ cells from WT and Slc4a4-icKO cortices at P30 and P90. Data are presented as mean ± SEM. Each dot indicates an individual animal. *p<0.05 by Student’s t-test. (G) Overall complexity of astrocytes (Aldh1l1-GFP) was measured by Sholl analysis. Data are presented as mean ± SEM. n = 6–8 cells per animal and N = 4–6 mice per genotype. **p<0.01, ***p<0.001 by two-way ANOVA. (H) Astrocyte volume was reconstructed and quantified using IMARIS software. Each dot represents an individual astrocyte. n = 14–18 astrocytes and N = 4 mice per group. (I) Quantification of blood vessel area covered by astrocytes after IMARIS 3D reconstruction. n = 3–4 images per animal and N = 3–4 mice per genotype. **p<0.01 by Student’s t-test. (J) Schematic of measuring astrocytic spontaneous calcium signaling in the cortex from WT and Slc4a4-icKO mice. Tamoxifen (100mg/kg) was injected for 5 consecutive days at 6 weeks old to induce gene deletion, followed by stereotaxic AAV2/9-GfaABC1D-GCaMP6f virus injection into the cortex at 10 weeks old. Astrocytic calcium from ex vivo cortical slices was imaged at 12 weeks old. (K) Representative images of astrocytic soma spontaneous calcium activity from WT and Slc4a4-icKO mice. (L-M) Quantification of amplitude and frequency of GCaMP6f signal events in cortical astrocyte soma and endfeet. Data are presented as mean ± SEM. Total number of cells is n = 30–40 collected from N = 6–8 mice of each genotype. Student’s t-test was used for statistics, *p<0.05.
Figure 2.
Figure 2.. Loss of Slc4a4 results in hyper-vascularization coupled with junctional marker loss at BBB.
(A) Blood vessel phenotype in Slc4a4-icKO cortex was examined by in vivo lectin labeling and immunofluorescence staining of vasculature markers (CD31, Glut1 and AQP4) at P90. (B) Quantification of blood vessel diameter by lectin labeling in WT and Slc4a4-icKO cortex. n = 35–60 vessels collected from N = 4–5 animals per genotype. ***p<0.001. (C) Quantification of blood vessel volume from IMARIS 3D reconstruction. Data are presented as mean ± SEM, n = 8–10 images from N = 4–5 animals per genotype. ***p<0.001 by Student’s t-test. (D) A histogram of average blood diameter measures in each genotype. n = 35–60 vessels collected from N = 4–5 animals per genotype. (E) qRT-PCR analysis of endothelial cell markers in the cortex from WT and Slc4a4-icKO mice. Data are presented as mean ± SEM. Each dot represents an individual animal (N = 3–5). *p<0.05 by Student’s t-test. (I) BBB leakage was assessed in WT and Slc4a4-icKO mice by intraperitoneal injection of Evans blue (indicates albumin leakage), intravenous injection of FITC conjugated dextran (3kDa), and intracardial injection of EZ-Link Sulfo-NHS-Biotin (indicates small molecule leakage) before harvest. (J) Representative images of stained biotin in the cortex from WT and Slc4a4-icKO mice. Yellow arrowheads indicate leakage of EZ-Link Sulfo-NHS-Biotin into the brain. (K) Extravasated Evans blue level in the brain was quantified by colorimetric assays. Extravasated FITC-dextran and EZ-Link Sulfo-NHS-Biotin were quantified based on intensity in brain sections. Data are presented as mean ± SEM. Each dot represents an individual animal (N = 6–8 per genotype). *p<0.05 by Student’s t-test. (F) Double immunofluorescence staining of tight junction markers (ZO-1, Claudin-5) and endothelial cell marker (CD31) in the cortex from WT and Slc4a4-icKO mice. Empty arrowheads indicate vessels missing coverage by tight junction proteins. (G-H) Quantification of the intensity of ZO-1 and Claudin-5 colocalized with CD31. Data are presented as mean ± SEM. N = 4–5 animals per genotype *p<0.05, **p<0.01 by Student’s t-test.
Figure 3.
Figure 3.. Slc4a4-deficient astrocytes exhibit impaired BBB remodeling after ischemic stroke.
(A) Schematics of photothrombotic ischemic stroke (PTS) in WT and Slc4a4-icKO mice. Tamoxifen (100mg/kg) was injected for 5 consecutive days at 6 weeks old to induce gene deletion. PTS was induced at 12 weeks old (6 weeks post gene deletion), followed by brain harvesting at designated days post injury (dpi). Peri-lesion is defined as 150μm in distance from the lesion border. (B) Single or double staining of Slc4a4 (in situ) and S100b (immunostaining) in the WT cortex after PTS. (C) Extracellular pH in the stroke lesions was measured by intraperitoneal injection of pHLIP-ICG dye (1mg/kg). 24 hours after injection (1 dpi), brains from WT and Slc4a4-icKO mice were harvested and imaged using the Bruker Xtreme Imager with 735 nm excitation and 830 nm emission wavelength. (D) Representative images of albumin leakage (Evans blue), hemorrhage, and gross histology (H&E) of WT and Slc4a4-icKO mice at 4 or 14 dpi. (E) Evans blue levels in stroked brains from WT and Slc4a4-icKO mice were determined by colorimetric assays. Data are presented as mean ± SEM. Each dot represents an individual animal. N = 5–7 per genotype. *p<0.05 by Student’s t-test. (F) Quantification of infarct size is based on H&E staining of serial 40 μm-thick brain sections from stroked brains at 4 and 14 dpi. Each dot represents an individual animal. N = 3 per genotype. *p<0.05 by Student’s t-test (G) Double immunofluorescence staining of tight junction marker Claudin-5 and caveolae markers (Cav-1, pCav-1) with endothelial cell marker (CD31) at the peri-lesion area from WT and Slc4a4-icKO at 4 dpi. Empty arrowheads indicate loss of Claudin-5 (Cldn5). (H) Quantification of tight junctional markers (Cldn5, ZO-1) and caveolae markers (Cav-1, pCav-1) based on their intensity colocalized with CD31 in immunostaining. Data are presented as mean ± SEM. Each dot represents individual blood vessels collected from N = 4–6 animals per genotype. ***p<0.001, ****p<0.0001 by Student’s t-test.
Figure 4.
Figure 4.. Loss of astrocytic Slc4a4 dampens reactive astrogliosis and astrocyteblood vessel interaction after stroke.
(A) Immunostaining of reactive astrocyte markers (GFAP, S100b) at the peri-lesion area at 4 dpi. To label proliferating astrocytes, WT and Slc4a4-icKO mice were intraperitoneally injected with BrdU (200mg/kg) every 12 hours from 1 to 3 dpi. S100b+ cells are co-labeled with BrdU to indicate local astrocyte proliferation. SVZ Sox9+ cells are co-labeled with BrdU to indicate SVZ astrocyte proliferation. (B) Whole-mount images of CLARITY-cleared mice brain at 4 dpi of PTS. Astrocytes were genetically labeled with Aldh1l1-GFP (green), and blood vessels were labeled with tomato-lectin (red). 40μm-thick sections were used for further IMARIS 3D reconstruction to visualize astrocyte-blood vessel interaction. (C) Quantification of GFAP intensity from immunostaining. Data are presented as mean ± SEM. Each dot represents an individual animal. N = 8 per genotype, **p<0.01 by Student’s t-test. (D) Quantification of total branch volume of reactive astrocytes from GFAP immunostaining. Data are presented as mean ± SEM. n = 9–19 cells collected from N = 3–5 mice per genotype. *p<0.05 by Student’s t-test. (E) Quantification of S100b+ cell number from immunostaining. Data are presented as mean ± SEM. Each dot represents an individual animal. N = 4–6 per genotype. **p<0.01 by Student’s t-test. (F) Quantification of proliferating reactive astrocytes at peri-lesion area (S100b+; Ki67+). Data are presented as mean ± SEM. Each dot represents an individual animal. N = 5–7 per genotype. ****p<0.0001 by Student’s t-test. (G) Quantification of the number of proliferating SVZ astrocytes (BrdU+; Sox9+). Data are presented as mean ± SEM. Each dot represents an individual animal. N = 4–7 per genotype. *p<0.05 by Student’s t-test. (H-I) Quantification of blood vessel volume and volume covered by astrocyte processes in the peri-lesion area from WT and Slc4a4-icKO cortices at 4 dpi. Each dot represents an individual animal. N = 3–4 per genotype. *p<0.05, **p<0.01 by Student’s t-test.
Figure 5.
Figure 5.. Loss of Slc4a4 upregulates astrocytic CCL2 and endothelial CCR2 after ischemic stroke.
(A) Conditioned media (CM) was collected from primary WT and Slc4a4 KO astrocytes and subjected to LC-MS/MS-based unbiased proteomics and cytokine/chemokine array. (B) Angiogenic factors detected from LC-MS/MS-based unbiased proteomics. (C) Cytokine/chemokines that are changed in the CM from WT and Slc4a4 KO astrocytes. (D) CM from primary WT and Slc4a4 KO astrocytes cultured under either normal or oxygen-glucose deprivation (OGD) condition was collected for CCL2 measurement by ELISA. Each dot represents conditioned media collected from individual animals’ astrocytes. N = 3–5 per genotype. *p<0.05, ****p<0.01 by Student’s t-test. (E) Proposed model for the Slc4a4-CCL2-CCR2 axis regulating astrocyte-endothelia interaction. (F) Quantification of cortical CCL2 levels in the uninjured and stroked (1 dpi) brains from WT and Slc4a4-icKO mice. Data are presented as mean ± SEM. N = 3–5 mice per genotype. *p<0.05, **p<0.01 by Student’s t-test. (G) Quantification of astrocytic CCL2 expression from double immunostaining. Data are presented as mean ± SEM. n = 7–17 cells collected from N = 3–5 mice per genotype. *p<0.05 by Student’s t-test. (H) Quantification of endothelial CCR2 expression from double immunostaining. Data are presented as mean ± SEM. Each dot represents an individual animal. N = 4–5 per genotype. *p<0.05, *p<0.05 by Student’s t-test. (I) At 4 dpi, astrocytic CCL2 expression was visualized by double immunostaining of CCL2/GFAP. Endothelial and astrocytic CCR2 expression was visualized by double immunostaining of CCR2/CD31 and CCR2/Aldh1l1-GFP respectively.
Figure 6.
Figure 6.. Slc4a4 regulates astrocyte-endothelia interaction via CCL2-CCR2 axis
(A) Mouse endothelial cells (bEnd3) were incubated with conditioned media (CM) collected from primary WT and Slc4a4 KO astrocytes with CCL2 functional blocking antibody (CCL2 αFB, 15 ng/ml) or CCR2 antagonist for 24 hours. (B-D) Representative immunofluorescence images and quantification of tight junction proteins (ZO-1 and Claudin-5) of bEnd3 cells incubated with WT- or Slc4a4 KO- CM in the presence of control IgG or CCL2-FBα. Data are presented as mean ± SEM. Each dot represents a well collected from 3 independent experiments. *p<0.05, ***p<0.001 by two-way ANOVA. (E) Experimental setup of the transendothelial electrical resistance (TEER) assay. A monolayer of bEnd3 cells was co-cultured with WT or Slc4a4-deficient astrocytes, where astrocytes were plated at the bottom of the well and endothelial cells were plated in the insert, allowing endothelial cells to be exposed to astrocytic secreting factors without physical contact with astrocytes. CCL2 blocking antibody was added into the insert with a final concentration of 15 ng/ml. (F) The electro-resistance of the endothelial cell monolayer was measured as an indicator for the permeability of endothelial cells in the TEER assay. Data are presented as mean ± SEM. Each dot represents each independent culture. N = 4 independent assays. *p<0.05, **p<0.01 by two-way ANOVA. (G-H) Caveolin- and clathrin-mediated endothelial intracellular uptake was examined by Texas Red conjugated albumin and A488-transferrin, respectively, in bEnd3 cells incubated with WT- or Slc4a4 KO-CM with CCR2 FBα or control IgG. Data are presented as mean ± SEM. Each dot represents each independent culture. N= 3 independent assays. **p<0.01, ***p<0.001 by two-way ANOVA. (I-J) Western blot analysis of pCav-1, Cav-1 and CCR2 expression in bEnd3 cells incubated with WT- or Slc4a4 KO-CM with CCR2 FBα or control IgG. Data are presented as mean ± SEM. Each dot represents each independent culture. N = 3 independent assays. **p<0.01, ***p<0.001, ****p<0.0001 by two-way ANOVA. (K-L) Paracellular and transcellular endothelial transport in bEnd3 cells incubated with WT- or Slc4a4 KO-CM with CCR2 antagonist RS504393 (10 μM) or control DMSO were examined by immunostaining of ZO-1 and pCav-1. Data are presented as mean ± SEM. Each dot represents each independent culture. N = 3 independent assays. *p<0.05, **p<0.01, ***p<0.001 by two-way ANOVA. (M) A proposed mechanism by which astrocytic Slc4a4 regulates endothelial paracellular and transcellular transport pathways via the CCL2-CCR2 axis.
Figure 7.
Figure 7.. Pharmacologically CCL2 inhibition rescues loss of Slc4a4-induced exacerbated BBB damage after ischemic stroke.
(A) Experimental scheme of the PTS induction in WT and Slc4a4-icKO mice, followed by intraperitoneal injection of CCL2 functional blocking antibody (CCL2-FBα) at 1 dpi. Brains were then harvested and analyzed at 4 dpi. (B) Representative images of protein leakage (Evans blue, fibrinogen), endothelial junctional marker expression (Claudin-5+; CD31+), endothelial pCav-1 expression and reactive astrocyte marker GFAP at the peri-lesion area in WT and Slc4a4-icKO mice with or without CCL2-FBα treatment. (C) Quantification of fibrinogen intensity from immunostaining. Data are presented as mean ± SEM. Each dot represents an individual animal (N = 4–9 per group). ***p<0.001, ****p<0.0001 by two-way ANOVA. (D) Quantification of CD31 intensity from immunostaining. Data are presented as mean ± SEM. n = 2–3 blood vessels per animal and N = 4–5 animals per group. **p<0.01 ***p<0.001, ****p<0.0001 by two-way ANOVA. (E) Quantification of the intensity of Claudin-5 colocalized with CD31. Data are presented as mean ± SEM. n = 2–3 blood vessels per animal and N = 4–5 animals per group. *p<0.05, ***p<0.001 by two-way ANOVA. (F) Quantification of the intensity of pCav-1 colocalized with CD31. Data are presented as mean ± SEM. n = 4–5 blood vessels per animal and N = 4–5 animals per group. *p<0.05, ***p<0.001 by two-way ANOVA. (G) Quantification of GFAP intensity from immunostaining. Data are presented as mean ± SEM. Each dot represents an individual animal. N = 3–5 per genotype. *p<0.05 **p<0.001 by two-way ANOVA.
Figure 8.
Figure 8.. Genetic inhibition of astrocytic derived CCL2 rescues loss of Slc4a4-induced exacerbated BBB damage after ischemic stroke.
(A) Experimental scheme of the PTS induction in temporally controlled astrocyte-specific conditional null alleles. Brains were then harvested and analyzed at 4 dpi. (B) Quantification of infarct size based on 2,3,5-Triphenyltetrazolium chloride staining of serial 1mm-thick brain sections from stroked brains at 4 dpi. Data are presented as mean ± SEM. Each dot represents an individual animal. N = 3–6 animals per group. ***p<0.001 by two-way ANOVA. (C) Evans blue levels in stroked brains from WT and Slc4a4-icKO mice were determined by colorimetric assays. Data are presented as mean ± SEM. Each dot represents an individual animal. N = 3–4 per genotype. *p<0.05, ***p<0.001 by two-way ANOVA. (D) Representative images of endothelial junctional marker expression (Claudin-5+; CD31+) and endothelial pCav-1 at the peri-lesion area. Reactive astrocyte and blood vessel interactions are visualized by double fluorescence staining of S100b and CD31. (E) Quantification of CD31 intensity at the peri-lesion area. Data are presented as mean ± SEM. n = 1–2 blood vessels per animal and N = 3–5 animals per group. *p<0.05, **p<0.01 by two-way ANOVA. (F) Quantification of Claudin-5 intensity colocalized with CD31 at the peri-lesion area. Data are presented as mean ± SEM. n = 1–2 blood vessels per animal and N = 3–5 animals per group. *p<0.05, ****p<0.0001 by two-way ANOVA. (G) Quantification pCav-1 intensity colocalized with CD31 at peri-lesion area. Data are presented as mean ± SEM. n = 5–6 blood vessels per animal and N = 5–6 animals per group. ***p<0.001, ****p<0.0001 by two-way ANOVA. (J) Quantification vessel area covered by astrocytes using IMARIS 3D reconstruction at the peri-lesion area. Data are presented as mean ± SEM. n = 1–2 images per animal and N = 4–5 animals per group. *p<0.05, ****p<0.0001 by two-way ANOVA.
Figure 9.
Figure 9.. Astrocytic CCL2 dysregulation by the loss of Slc4a4 is partially attributable to arginine hypermetabolism.
(A-B) WT and Slc4a4-icKO mice were intraperitoneally injected with iNOS inhibitor (L-NMMA, 10mg/kg) from 1–3 dpi. Brains were harvested at 4 dpi for analysis of cortical arginine metabolites. Data are presented as mean ± SEM. N = 4–7 animals per group. *p<0.05, **p<0.01, ***p<0.001 by one-way ANOVA. (C) Total NO levels in stroked cortices were measured by the total concentration of nitrite and nitrate using a colorimetric assay. *p<0.05 by one-way ANOVA. (D-G) Representative images and quantification of CCL2 colocalized with Aldh1l1-GFP, Claudin-5 colocalized with CD31, and pCav-1 colocalized with CD31 at the peri-lesion area. Data are presented as mean ± SEM. Each data point represents individual images from multiple animals. N = 3–4 animals per group. *p<0.05, **p<0.01, ****p<0.0001 by one-way ANOVA.

References

    1. Daneman R, Engelhardt B. Brain barriers in health and disease. Neurobiol. Dis. 2017;107:1–3. - PubMed
    1. Ronaldson PT, Davis TP . Blood-brain barrier integrity and glial support: mechanisms that can be targeted for novel therapeutic approaches in stroke. [Internet]. Curr. Pharm. Des. 2012;18(25):3624–44. - PMC - PubMed
    1. Gorelick PB. The global burden of stroke: persistent and disabling. [Internet]. Lancet. Neurol. 2019;18(5):417–418. - PubMed
    1. Hankey GJ. Stroke. [Internet]. Lancet (London, England) 2017;389(10069):641–654. - PubMed
    1. Iadecola C, Nedergaard M. Glial regulation of the cerebral microvasculature. Nat. Neurosci. 2007;10(11):1369–1376. - PubMed

Publication types