

This is a preprint.
Reconstruction Set Test (RESET): a computationally efficient method for single sample gene set testing based on randomized reduced rank reconstruction error
- PMID: 37066315
- PMCID: PMC10104009
- DOI: 10.1101/2023.04.03.535366
Reconstruction Set Test (RESET): a computationally efficient method for single sample gene set testing based on randomized reduced rank reconstruction error
Update in
-
Reconstruction Set Test (RESET): A computationally efficient method for single sample gene set testing based on randomized reduced rank reconstruction error.PLoS Comput Biol. 2024 Apr 29;20(4):e1012084. doi: 10.1371/journal.pcbi.1012084. eCollection 2024 Apr. PLoS Comput Biol. 2024. PMID: 38683883 Free PMC article.
Abstract
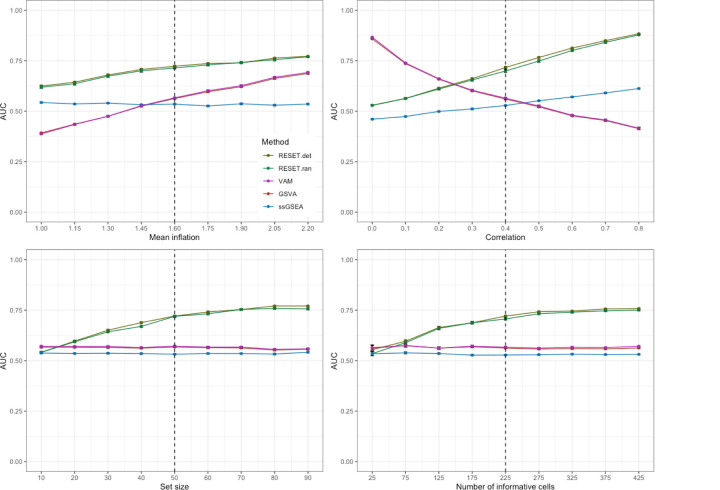
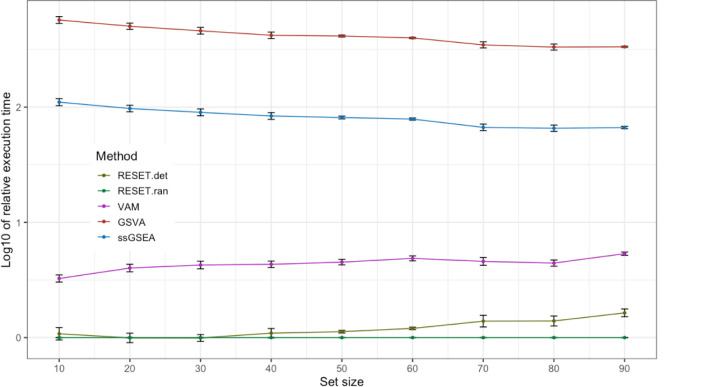
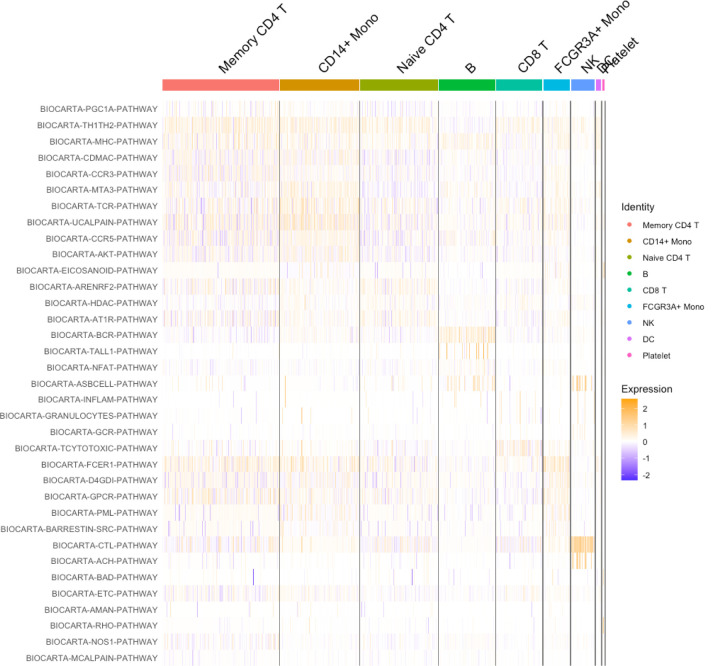
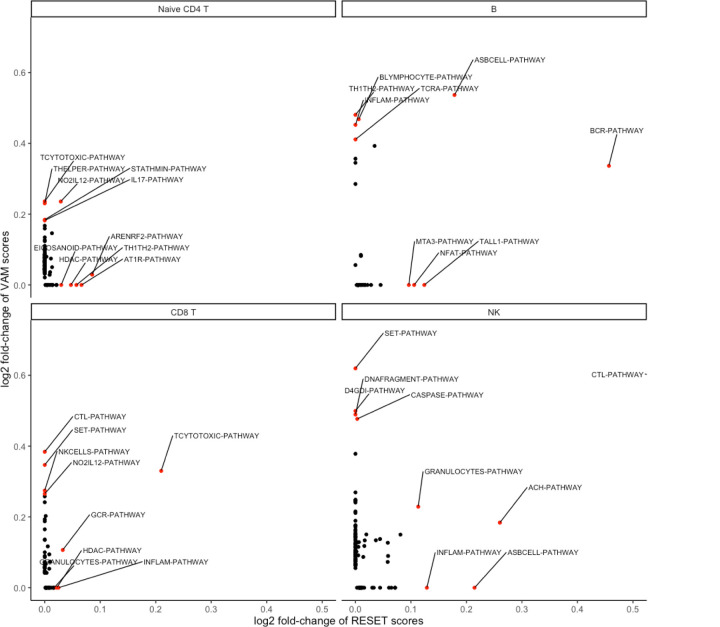
We have developed a new, and analytically novel, single sample gene set testing method called Reconstruction Set Test (RESET). RESET quantifies gene set importance at both the sample-level and for the entire dataset based on the ability of set genes to reconstruct values for all measured genes. RESET addresses four important limitations of current techniques: 1) existing single sample methods are designed to detect mean differences and struggle to identify differential correlation patterns, 2) computationally efficient techniques are self-contained methods and cannot directly detect competitive scenarios where set genes differ from non-set genes in the same sample, 3) the scores generated by current methods can only be accurately compared across samples for a single set and not between sets, and 4) the computational performance of even the fastest existing methods be significant on very large datasets. RESET is realized using a computationally efficient randomized reduced rank reconstruction algorithm (available via the RESET R package on CRAN) that can effectively detect patterns of differential abundance and differential correlation for self-contained and competitive scenarios. As demonstrated using real and simulated scRNA-seq data, RESET provides superior accuracy at a lower computational cost relative to other single sample approaches.
Conflict of interest statement
Conflict of Interest: None declared.
Figures


Similar articles
-
Reconstruction Set Test (RESET): A computationally efficient method for single sample gene set testing based on randomized reduced rank reconstruction error.PLoS Comput Biol. 2024 Apr 29;20(4):e1012084. doi: 10.1371/journal.pcbi.1012084. eCollection 2024 Apr. PLoS Comput Biol. 2024. PMID: 38683883 Free PMC article.
-
A Novel Framework for the Identification of Reference DNA Methylation Libraries for Reference-Based Deconvolution of Cellular Mixtures.Front Bioinform. 2022;2:835591. doi: 10.3389/fbinf.2022.835591. Epub 2022 Mar 21. Front Bioinform. 2022. PMID: 35419567 Free PMC article.
-
A novel graph-based k-partitioning approach improves the detection of gene-gene correlations by single-cell RNA sequencing.BMC Genomics. 2022 Jan 7;23(1):35. doi: 10.1186/s12864-021-08235-4. BMC Genomics. 2022. PMID: 34996359 Free PMC article.
-
The future of Cochrane Neonatal.Early Hum Dev. 2020 Nov;150:105191. doi: 10.1016/j.earlhumdev.2020.105191. Epub 2020 Sep 12. Early Hum Dev. 2020. PMID: 33036834
-
Calculations on noncovalent interactions and databases of benchmark interaction energies.Acc Chem Res. 2012 Apr 17;45(4):663-72. doi: 10.1021/ar200255p. Epub 2012 Jan 6. Acc Chem Res. 2012. PMID: 22225511 Review.
References
-
- Subramanian A., Tamayo P., Mootha V.K., Mukherjee S., Ebert B.L., Gillette M.A., Paulovich A., Pomeroy S.L., Golub T.R., Lander E.S., Mesirov J.P.: Gene set enrichment analysis: A knowledge-based approach for interpreting genome-wide expression profiles. Proc Natl Acad Sci U S A 102(43), 15545–15550 (2005). doi:10.1073/pnas.0506580102 - DOI - PMC - PubMed
Publication types
Grants and funding
LinkOut - more resources
Full Text Sources
Research Materials