[Preprint]. 2023 Apr 6:2023.04.06.535919.
doi: 10.1101/2023.04.06.535919.

Resistance Training Diminishes Mitochondrial Adaptations to Subsequent Endurance Training

Affiliations

Resistance Training Diminishes Mitochondrial Adaptations to Subsequent Endurance Training

Paulo H C Mesquita et al. bioRxiv. .

Update in

Abstract

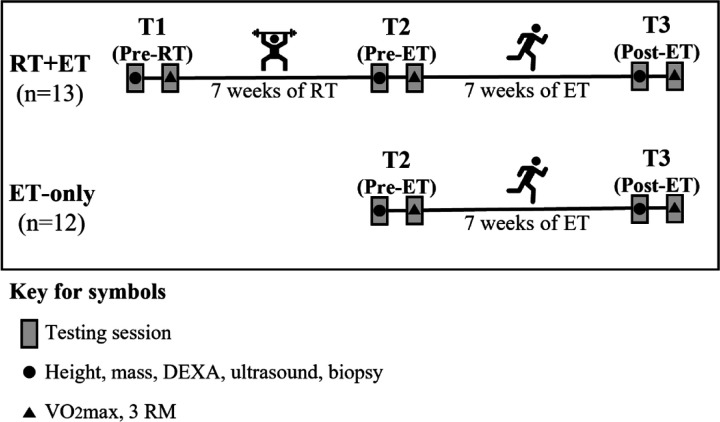
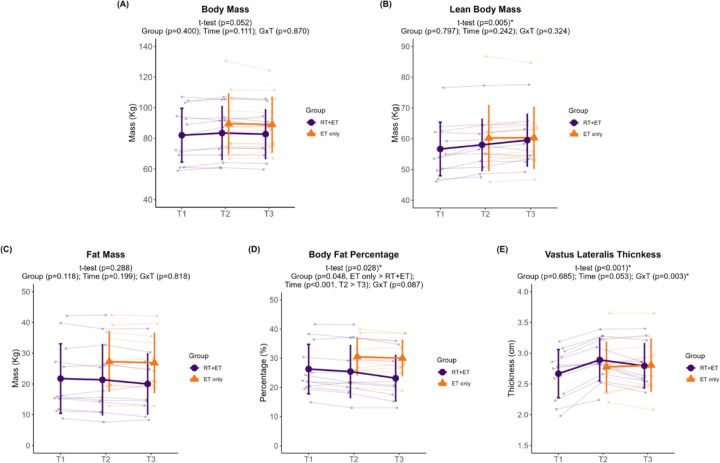
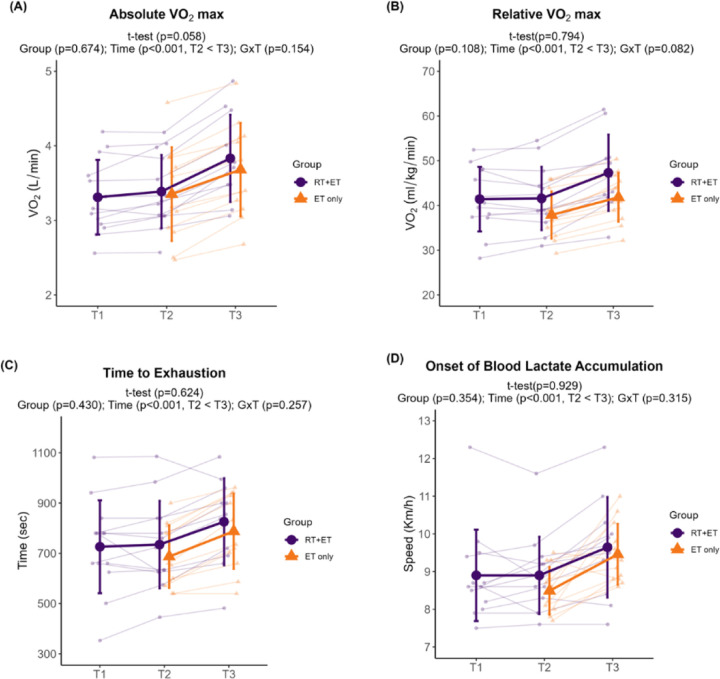
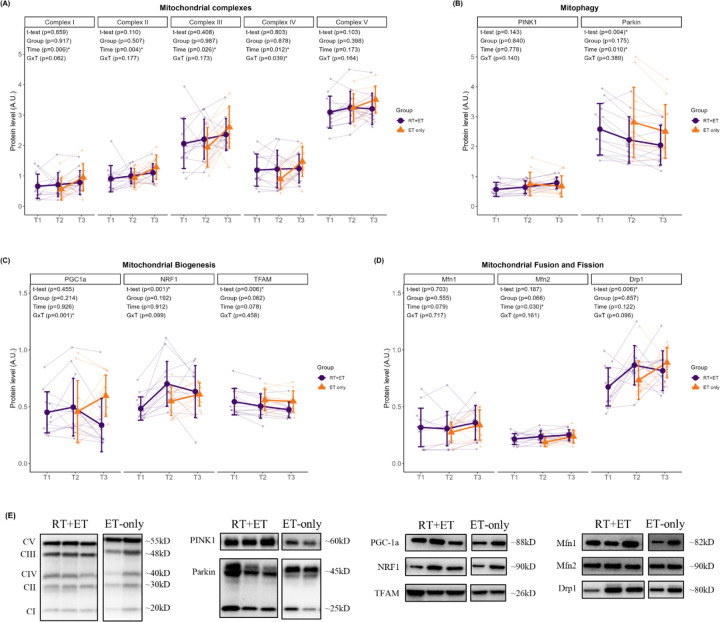
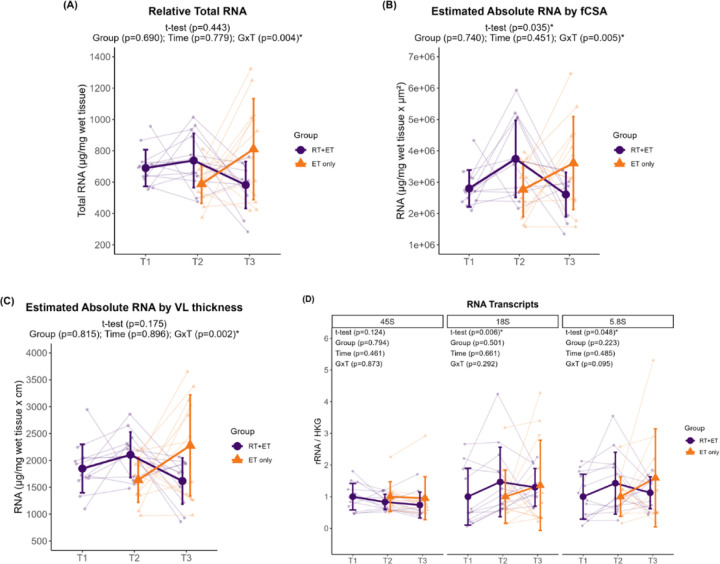
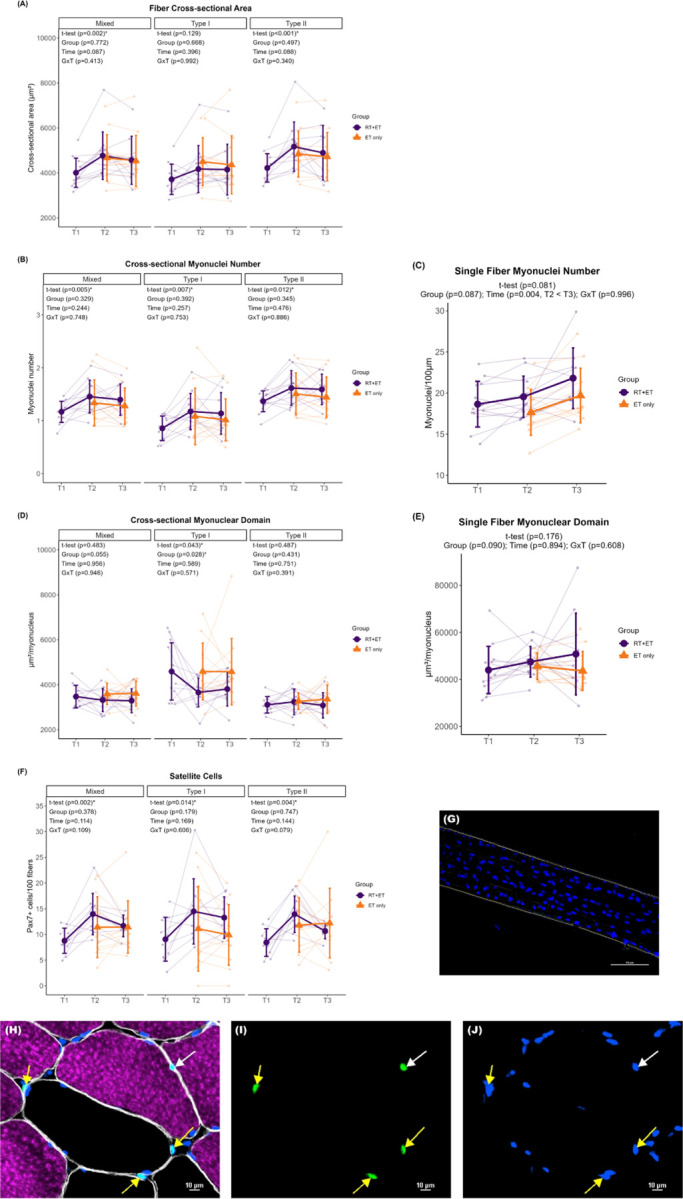
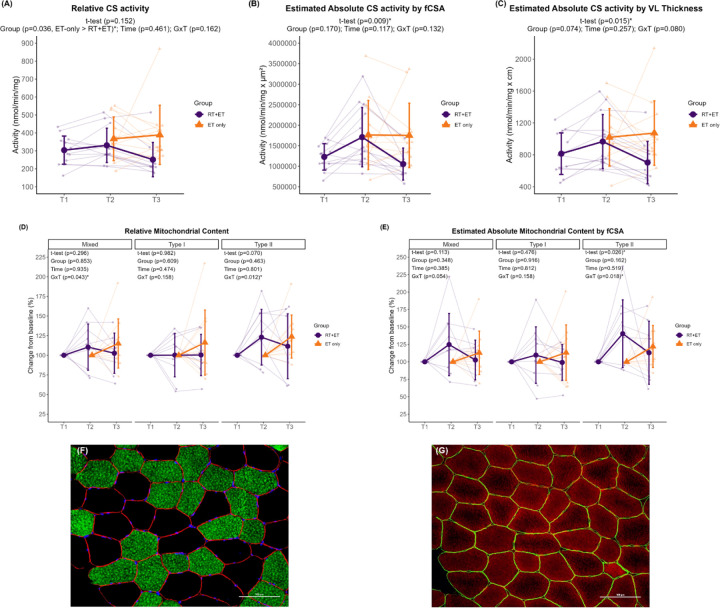
We investigated the effects of performing a period of resistance training (RT) on the performance and molecular adaptations to a subsequent period of endurance training (ET). Twenty-five young adults were divided into RT+ET (n=13), which underwent seven weeks of RT followed by seven weeks of ET, and ET-only (n=12), which performed seven weeks of ET. Body composition, endurance performance, and muscle biopsies were collected before RT (T1, baseline for RT+ET), before ET (T2, post RT for RT+ET and baseline for ET), and after ET (T3). Immunohistochemistry was performed to determine fiber cross-sectional area (fCSA), myonuclear content, myonuclear domain size, satellite cell number, and mitochondrial content. Western blots were used to quantify markers of mitochondrial remodeling. Citrate synthase activity and markers of ribosome content were also investigated. Resistance training improved body composition and strength, increased vastus lateralis thickness, mixed and type II fCSA, myonuclear number, markers of ribosome content, and satellite cell content (p<0.050). In response to ET, both groups similarly decreased body fat percentage and improved endurance performance (e.g., VO 2 max, and speed at which the onset of blood lactate accumulation occurred during the VO 2 max test). Levels of mitochondrial complexes I-IV in the ET-only group increased 32-66%, while the RT+ET group increased 1-11%. Additionally, mixed fiber relative mitochondrial content increased 15% in the ET-only group but decreased 13% in the RT+ET group. In conclusion, RT performed prior to ET had no additional benefits to ET adaptations. Moreover, prior RT seemed to impair mitochondrial adaptations to ET.

Key points summary: Resistance training is largely underappreciated as a method to improve endurance performance, despite reports showing it may improve mitochondrial function.Although several concurrent training studies are available, in this study we investigated the effects of performing a period resistance training on the performance and molecular adaptations to subsequent endurance training.Prior resistance training did not improve endurance performance and impaired most mitochondrial adaptations to subsequent endurance training, but that seemed to be a result of detraining from resistance training.


Conflict of interest statement

None of the authors have financial or other conflicts of interest to report regarding these data.

Figures

Figure 1.
Figure 1.. Experimental Design.
Abbreviations: RT+ET, group that performed 7 weeks of resistance training followed by 7 weeks of endurance training; ET-only, group that performed 7 weeks of endurance training only; RT, Resistance Training; ET, Endurance Training
Figure 2.
Figure 2.. Body composition variables response to RT and ET.
(A) Body mass. (B) Lean body mass. (C) Fat mass. (D) Body fat percentage. (E) Vastus lateralis thickness. T1 = Pre-RT; T2 = Pre-ET; T3 = Post-ET. Data are expressed as mean ± SD, and individual respondent values are also depicted. Abbreviations: RT+ET, group that performed 7 weeks of resistance training followed by 7 weeks of endurance training; ET-only, group that performed 7 weeks of endurance training only; GxT, group x time interaction. Notes: t-test p-values are for the RT period in the RT+ET group, and the two-way ANOVA main effect and interaction p-values are for the ET period in both groups.
Figure 3.
Figure 3.. Endurance performance variables response to RT and ET.
(A) Absolute VO2max. (B) Relative VO2max. (C) Time to exhaustion. (D) Onset of blood lactate accumulation. T1 = Pre-RT; T2 = Pre-ET; T3 = Post-ET. Data are expressed as mean ± SD, and individual respondent values are also depicted. Abbreviations: RT+ET, group that performed 7 weeks of resistance training followed by 7 weeks of endurance training; ET-only, group that performed 7 weeks of endurance training only; GxT, group x time interaction. Notes: t-test p-values are for the RT period in the RT+ET group, and the two-way ANOVA main effect and interaction p-values are for the ET period in both groups.
Figure 4.
Figure 4.. Markers of mitochondrial remodeling response to RT and ET.
(A) Mitochondrial complexes. (B) Mitophagy. (C) Mitochondrial biogenesis. (D) Mitochondrial fusion and fission. (E) Representative Western blots. T1 = Pre-RT; T2 = Pre-ET; T3 = Post-ET. Data are expressed as mean ± SD, and individual respondent values are also depicted. Abbreviations: RT+ET, group that performed 7 weeks of resistance training followed by 7 weeks of endurance training; ET-only, group that performed 7 weeks of endurance training only; GxT, group x time interaction. Notes: t-test p-values are for the RT period in the RT+ET group, and the two-way ANOVA main effect and interaction p-values are for the ET period in both groups.
Figure 5.
Figure 5.. Markers of ribosome content response to RT and ET.
(A) Total RNA concentrations. (B) Estimated absolute RNA content (adjusted for mixed fiber cross-sectional area values). (C) Estimated absolute RNA content (adjusted for VL thickness values) (D) Ribosomal RNA transcripts. T1 = Pre-RT; T2 = Pre-ET; T3 = Post-ET. Data are expressed as mean ± SD, and individual respondent values are also depicted. Abbreviations: RT+ET, group that performed 7 weeks of resistance training followed by 7 weeks of endurance training; ET-only, group that performed 7 weeks of endurance training only; GxT, group x time interaction. Notes: t-test p-values are for the RT period in the RT+ET group, and the two-way ANOVA main effect and interaction p-values are for the ET period in both groups.
Figure 6.
Figure 6.. Fiber cross-sectional area, myonuclei and satellite cell number, and myonuclear domain responses to RT and ET.
(A) Fiber cross-sectional area. (B) Cross-sectional myonuclei number. (C) Single fiber myonuclei number. (D) Cross-sectional myonuclear domain. (E) Single fiber myonuclear domain. (F) Satellite cells content. (G) Single fiber representative image. (H-J) Representative images of cross-sectional staining. (H) Dystrophin (white), MHCI (magenta), DAPI (blue), Pax7 (green). (I) Pax7. (J) Pax7 + DAPI. T1 = Pre-RT; T2 = Pre-ET; T3 = Post-ET. Data are expressed as mean ± SD, and individual respondent values are also depicted. Abbreviations: RT+ET, group that performed 7 weeks of resistance training followed by 7 weeks of endurance training; ET-only, group that performed 7 weeks of endurance training only; GxT, group x time interaction. Notes: t-test p-values are for the RT period in the RT+ET group, and the two-way ANOVA main effect and interaction p-values are for the ET period in both groups.
Figure 7.
Figure 7.. Mitochondrial content responses to RT and ET.
(A) Relative maximal CS activity. (B) Total mitochondrial content estimation (via maximal CS activity and mixed fCSA values). (C) Total mitochondrial content estimation (via maximal CS activity and VL thickness). (D) Relative mitochondrial content (via TOMM20 IHC). (E) Total mitochondrial content estimation (via TOMM20 IHC and mixed fCSA values). (F-G) Representative images of serial cross-sectional staining. (F) Dystrophin (red), MHCI (green), DAPI (blue). (G) Dystrophin (green), TOMM20 (red). T1 = Pre-RT; T2 = Pre-ET; T3 = Post-ET. Data are expressed as mean ± SD, and individual respondent values are also depicted. Abbreviations: RT+ET, group that performed 7 weeks of resistance training followed by 7 weeks of endurance training; ET-only, group that performed 7 weeks of endurance training only; GxT, group x time interaction. Notes: t-test p-values are for the RT period in the RT+ET group, and the two-way ANOVA main effect and interaction p-values are for the ET period in both groups.

References

    1. Bassett D. R. Jr., and Howley E. T. (2000) Limiting factors for maximum oxygen uptake and determinants of endurance performance. Med Sci Sports Exerc 32, 70–84 - PubMed
    1. Joyner M. J., and Coyle E. F. (2008) Endurance exercise performance: the physiology of champions. J Physiol 586, 35–44 - PMC - PubMed
    1. Jacobs R. A., Rasmussen P., Siebenmann C., Diaz V., Gassmann M., Pesta D., Gnaiger E., Nordsborg N. B., Robach P., and Lundby C. (2011) Determinants of time trial performance and maximal incremental exercise in highly trained endurance athletes. J Appl Physiol (1985) 111, 1422–1430 - PubMed
    1. Burgomaster K. A., Howarth K. R., Phillips S. M., Rakobowchuk M., Macdonald M. J., McGee S. L., and Gibala M. J. (2008) Similar metabolic adaptations during exercise after low volume sprint interval and traditional endurance training in humans. J Physiol 586, 151–160 - PMC - PubMed
    1. MacInnis M. J., and Gibala M. J. (2017) Physiological adaptations to interval training and the role of exercise intensity. J Physiol 595, 2915–2930 - PMC - PubMed

Publication types