[Preprint]. 2023 Apr 3:2023.03.31.23287997.
doi: 10.1101/2023.03.31.23287997.

Improved detection of aberrant splicing using the Intron Jaccard Index

Affiliations

Improved detection of aberrant splicing using the Intron Jaccard Index

Ines F Scheller et al. medRxiv. .

Update in

Abstract

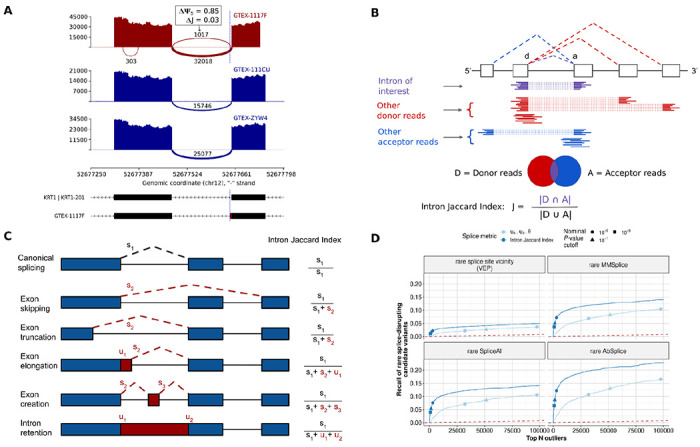
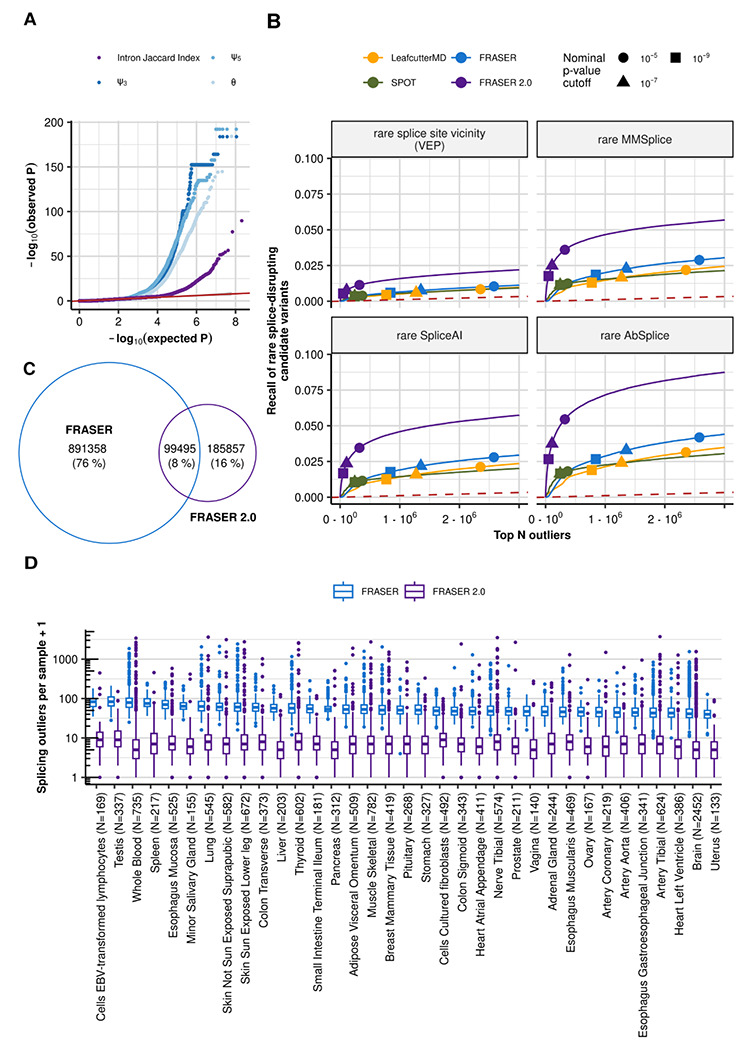
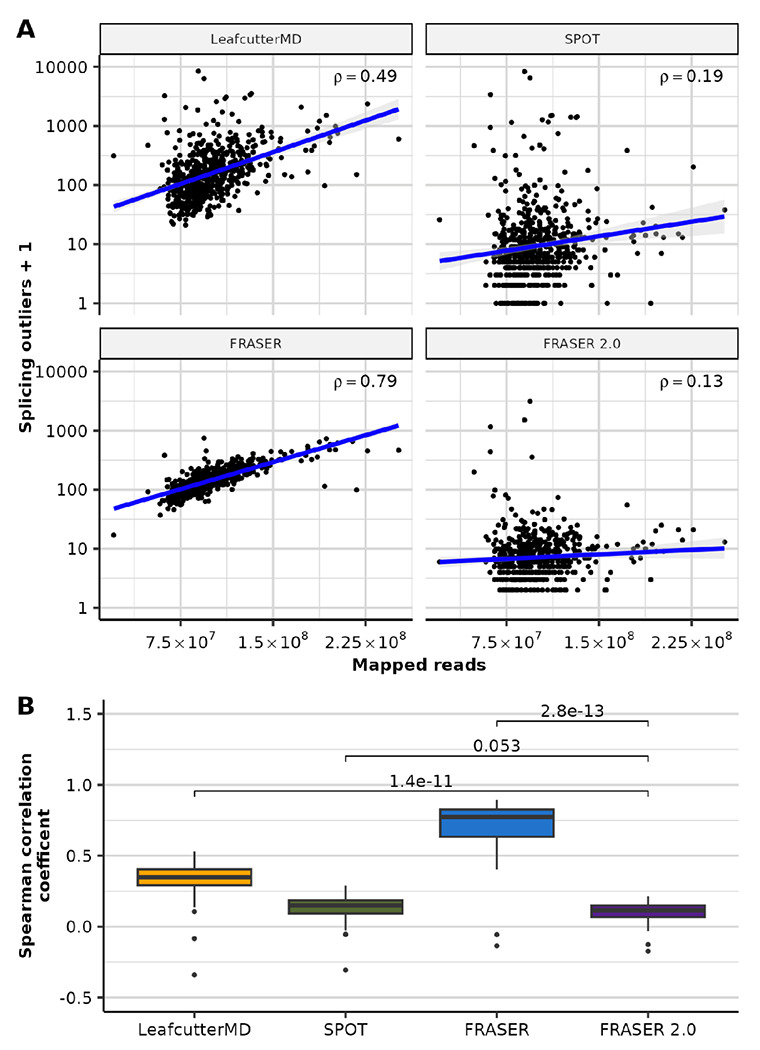
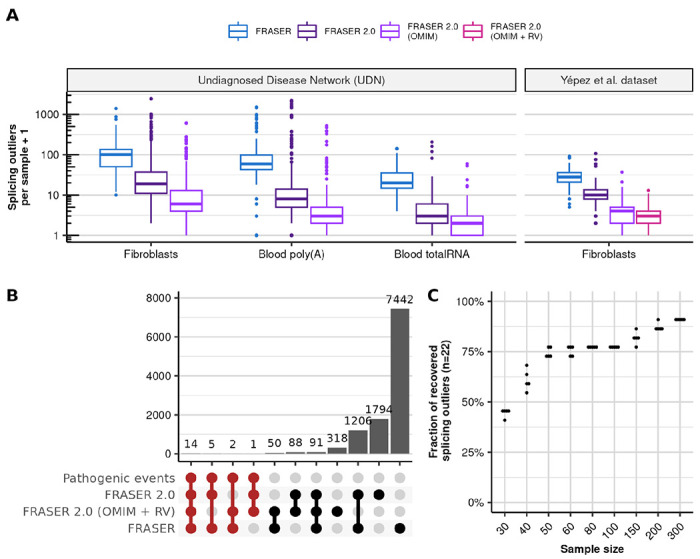
Detection of aberrantly spliced genes is an important step in RNA-seq-based rare disease diagnostics. We recently developed FRASER, a denoising autoencoder-based method for aberrant splicing detection that outperformed alternative approaches. However, as FRASER's three splice metrics are partially redundant and tend to be sensitive to sequencing depth, we introduce here a more robust intron excision metric, the Intron Jaccard Index, that combines alternative donor, alternative acceptor, and intron retention signal into a single value. Moreover, we optimized model parameters and filter cutoffs using candidate rare splice-disrupting variants as independent evidence. On 16,213 GTEx samples, our improved algorithm called typically 10 times fewer splicing outliers while increasing the proportion of candidate rare splice-disrupting variants by 10 fold and substantially decreasing the effect of sequencing depth on the number of reported outliers. Application on 303 rare disease samples confirmed the reduction fold-change of the number of outlier calls for a slight loss of sensitivity (only 2 out of 22 previously identified pathogenic splicing cases not recovered). Altogether, these methodological improvements contribute to more effective RNA-seq-based rare diagnostics by a drastic reduction of the amount of splicing outlier calls per sample at minimal loss of sensitivity.


Figures

Figure 1.
Figure 1.. Intron Jaccard Index metric improves splicing outlier calling.
(A) Sashimi plot of three GTEx skin not-sun-exposed RNA-seq samples showing exons 4 and 5 of the KRT1 gene. A splicing outlier was detected in the top sample using the ψ5 metric of FRASER (red). The position of the donor site of the outlier intron is indicated with a blue dashed line. While this intron is not expressed in most other samples (dark blue) and therefore detected with a high Δψ5 value, its functional impact is probably minor because the canonical intron remains largely dominant. (B) Schematic definition of the Intron Jaccard Index metric. (C) Representation of different types of aberrant splicing events that can be captured with the Intron Jaccard Index metric. The right column contains the formulae to compute the Intron Jaccard Index metric of the canonical intron (black dotted line) from the split (s) and non-split (u) reads of the involved introns in each scenario. (D) Recall of rare splice-disrupting candidate variants (as defined by VEP, MMSplice, SpliceAI and Absplice) versus the rank of nominal P-values from FRASER (light blue) and from an adaptation of FRASER using the Intron Jaccard Index metric (dark blue) on the GTEx skin not-sun-exposed dataset (N=582). Different nominal P-value cutoffs are indicated with shapes.
Figure 2.
Figure 2.. FRASER 2.0 increases recall of rare splice-disrupting candidate variants on GTEx.
(A) Quantile-quantile plots of the P-values for the different splice metrics from FRASER (ψ3, ψ5, θ, shown in shades of blue) and the Intron Jaccard Index metric from FRASER 2.0 (purple) on the GTEx skin not sun exposed dataset. The red line depicts the diagonal and the gray ribbon around it the 95% confidence interval. (B) Recall of rare splice-disrupting candidate variants as defined by the variant annotation tools VEP, MMSplice, SpliceAI, and AbSplice (facets) versus the rank of nominal P-values combined across GTEx tissues for FRASER (blue), FRASER 2.0 (purple), LeafcutterMD (yellow), and SPOT (green). Nominal P-value cutoffs are indicated with shapes. (C) Venn diagram of the overlap of splicing outliers at the gene-level found with FRASER (blue) and FRASER 2.0 (purple). (D) Boxplots of the number of splicing outliers (gene-level) per sample (y-axis) called by FRASER (blue) and FRASER 2.0 (purple) for each GTEx tissue (x-axis). All brain tissues have been combined for readability.
Figure 3.
Figure 3.. FRASER 2.0 is less sensitive to sequencing depth than previous methods.
(A) Scatterplot of the number of splicing outliers at the gene level against the total mapped reads per sample on the GTEx skin not-sun-exposed dataset for LeafcutterMD, SPOT, FRASER and FRASER 2.0 (facets). Spearman correlation coefficients (rho) are shown. All are significant (Spearman test, P < 3 x 10⁻³) (B) Boxplots of the Spearman correlation coefficients (y-axis) between the mapped reads and the number of splicing outliers at the gene level called by LeafcutterMD, SPOT, FRASER and FRASER 2.0 (x-axis) for each GTEx tissue (N=48). P-values of Wilcoxon tests are shown above brackets.
Figure 4.
Figure 4.. Application of FRASER 2.0 to rare disease cohorts.
(A) Distribution of the splicing outliers per sample at the gene level on the UDN (N=391, N=252, N=104 for Fibroblasts, Blood poly(A) and Blood totalRNA) and the Yépez et al. dataset (N=303) for FRASER (blue) and FRASER 2.0 applied to three gene sets considered for FDR-correction: expressed genes (dark purple), expressed OMIM genes (light purple), and expressed OMIM genes with a rare variant (violet red, Methods). (B) Size (bars) of all non-empty intersections (linked dots) between four outlier sets from the Yépez et al dataset: i) the 22 originally reported pathogenic events, ii) the transcriptome-wide significant FRASER 2.0 calls, iii) the significant FRASER 2.0 calls when only considering OMIM genes with a rare variant and iv) the transcriptome-wide significant FRASER calls. (C) Fraction of recovered pathogenic splicing outliers from the Yépez et al. dataset (y-axis, total N=22) when subsampling to different sample sizes (x-axis). Each sample size was randomly sampled 5 times. RV: rare variant.

References

    1. Kelemen O, Convertini P, Zhang Z, Wen Y., Shen M., Falaleeva M. and Stamm S. (2013) Function of alternative splicing. Gene, 514, 1–30. - PMC - PubMed
    1. Vuong C.K., Black D.L. and Zheng S. (2016) The neurogenetics of alternative splicing. Nat. Rev. Neurosci., 17, 265–281. - PMC - PubMed
    1. Rogalska M.E., Vivori C. and Valcárcel J. (2022) Regulation of pre-mRNA splicing: roles in physiology and disease, and therapeutic prospects. Nat. Rev. Genet., 10.1038/S41576-022-00556-8. - DOI - PubMed
    1. López-Bigas N., Audit B., Ouzounis C., Parra G. and Guigó R. (2005) Are splicing mutations the most frequent cause of hereditary disease? FEBS Lett., 579, 1900–1903. - PubMed
    1. Baralle D. and Buratti E. (2017) RNA splicing in human disease and in the clinic. Clin. Sci., 131, 355–368. - PubMed

Publication types