[Preprint]. 2023 Apr 8:2023.04.07.536039.
doi: 10.1101/2023.04.07.536039.

Evolution of neuronal cell classes and types in the vertebrate retina

Affiliations

Evolution of neuronal cell classes and types in the vertebrate retina

Joshua Hahn et al. bioRxiv. .

Update in

  • Evolution of neuronal cell classes and types in the vertebrate retina.
    Hahn J, Monavarfeshani A, Qiao M, Kao AH, Kölsch Y, Kumar A, Kunze VP, Rasys AM, Richardson R, Wekselblatt JB, Baier H, Lucas RJ, Li W, Meister M, Trachtenberg JT, Yan W, Peng YR, Sanes JR, Shekhar K. Hahn J, et al. Nature. 2023 Dec;624(7991):415-424. doi: 10.1038/s41586-023-06638-9. Epub 2023 Dec 13. Nature. 2023. PMID: 38092908 Free PMC article.

Abstract

The basic plan of the retina is conserved across vertebrates, yet species differ profoundly in their visual needs (Baden et al., 2020). One might expect that retinal cell types evolved to accommodate these varied needs, but this has not been systematically studied. Here, we generated and integrated single-cell transcriptomic atlases of the retina from 17 species: humans, two non-human primates, four rodents, three ungulates, opossum, ferret, tree shrew, a teleost fish, a bird, a reptile and a lamprey. Molecular conservation of the six retinal cell classes (photoreceptors, horizontal cells, bipolar cells, amacrine cells, retinal ganglion cells [RGCs] and Muller glia) is striking, with transcriptomic differences across species correlated with evolutionary distance. Major subclasses are also conserved, whereas variation among types within classes or subclasses is more pronounced. However, an integrative analysis revealed that numerous types are shared across species based on conserved gene expression programs that likely trace back to the common ancestor of jawed vertebrates. The degree of variation among types increases from the outer retina (photoreceptors) to the inner retina (RGCs), suggesting that evolution acts preferentially to shape the retinal output. Finally, we identified mammalian orthologs of midget RGCs, which comprise >80% of RGCs in the human retina, subserve high-acuity vision, and were believed to be primate-specific (Berson, 2008); in contrast, the mouse orthologs comprise <2% of mouse RGCs. Projections both primate and mouse orthologous types are overrepresented in the thalamus, which supplies the primary visual cortex. We suggest that midget RGCs are not primate innovations, but descendants of evolutionarily ancient types that decreased in size and increased in number as primates evolved, thereby facilitating high visual acuity and increased cortical processing of visual information.


Conflict of interest statement

Competing interests: The authors declare no competing interests.

Figures
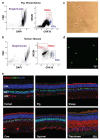
Extended Data Fig. 1 |
Extended Data Fig. 1 |. snRNA-seq data from the fovea/macula and peripheral retina of healthy human donors.
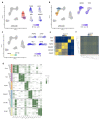
a. UMAP embedding of 184,808 nuclei from the central and peripheral retina of healthy human donors, with individual points colored by cell class. PRs have been divided into rod and cone subclasses, and ACs have been divided into GABAergic and glycinergic subclasses. b. Same as a, with points colored by sample identity. c. UMAP embedding of 80,032 RGC nuclei from the foveal and peripheral retina of healthy human donors, with individual points colored by type identity. Only ON and OFF midget ganglion RGCs are labeled. d. UMAP embedding of 6615 non-midget RGC nuclei from c, with individual points colored by type identity. ON and OFF parasol ganglion cells are labeled. e. UMAP embedding of 9126 BC nuclei from the fovea and peripheral retina of healthy human donors, with individual points colored by type identity. f. Dotplot showing expression of cell class-specific markers (columns) in the human clusters (rows). The size of each dot represents the fraction of cells in the group with non-zero expression, and the color represents expression level. The six classes are MG, HC, PR (subdivided into Rod and Cone), AC (subdivided into Gabaergic ACs (GabaAC) and glycinergic ACs (Gly AC)), BC and RGC. Only BCs and RGCs have been subclustered. Rows corresponding to BC and RGC clusters are ordered based on hierarchical clustering (dendrograms, left). Barplot on the right of the dotplot depicts the relative frequency of each cluster within a class (colors). The rightmost heatmap depicts the distribution of each cluster across biological replicates (columns).
Extended Data Fig. 2 |
Extended Data Fig. 2 |. Nuclear enrichment strategies for retinal ganglion cells (RGCs) and bipolar cells (BCs).
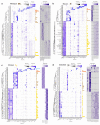
a. Examples of gating strategy in fluorescent activated cell sorting (FACS) experiments for collecting single nuclei labeled with either PE-conjugated NEUN, which enriches RGCs, or APC-conjugated CHX10 (also known as VSX2), which enriches BCs. Data shown are from experiments in the pig retina. NEUN and CHX10-based enrichment resulted in ~90% yield for RGCs and ~95% yield for BCs. b. Same as panel a, for human macular retina samples. NEUN-based enrichment resulted in ~90% yield for RGCs; BCs were not analyzed in this experiment. c. Brightfield image showing the morphology and integrity of FACS-purified nuclei. d. Confocal image of DAPI stained FACS-purified nuclei. e. Retinal sections from six species show that PE-conjugated NEUN (red) and APC- conjugated CHX10/VSX2 labels RGCs and BCs, respectively. Retinal sections were co-stained for DAPI (blue) to visualize nuclei. Scale bar, 50 μm.
Extended Data Fig. 3 |
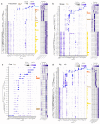
Extended Data Fig. 3 |. Summary of cell type atlases for tree shrew, sheep, cow, and pig.
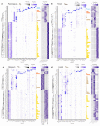
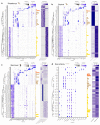
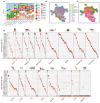
a. Dotplot showing expression of cell class-specific markers (columns) in the tree shrew clusters (rows). The size of each dot represents the fraction of cells in the group with nonzero expression, and the color represents expression level. The six classes are MG, HC, PR (subdivided into Rod and Cone), AC (subdivided into GABAergic AC (GabaAC) and glycinergic AC (Gly AC)), BCs and RGCs. Only BCs and RGCs have been subclassified through a within-species integration and clustering analysis (Methods). Rows corresponding to BC and RGC clusters are ordered based on a hierarchical clustering analysis (dendrograms, left). Barplot on the right of the dotplot depicts the relative frequency of each cluster within a class (colors). The rightmost heatmap depicts the distribution of each cluster across biological replicates (columns). Panels b-d depict the same information as panel a for sheep (b), cow (c), and pig (d).
Extended Data Fig. 4 |
Extended Data Fig. 4 |. Summary of cell type atlases for Peromyscus, ferret, opossum, and brown anolis lizard.
Panels a-d depict the atlases (as in Extended Data Fig. 3) for peromyscus (a), ferret (b), opossum (c), and brown anolis lizard (d).
Extended Data Fig. 5 |
Extended Data Fig. 5 |. Summary of cell type atlases for Rhabdomys, squirrel, marmoset and sea-lamprey.
Panels a-d depict atlases (as in Extended Data Fig. 3) for rhabdomys (a), squirrel (b), marmoset (c), and Sea-lamprey (d).
Extended Data Fig. 6 |
Extended Data Fig. 6 |. Summary of cell type atlases for macaque, mouse, chick and zebrafish.
Panels a-d depict atlases (as in Extended Data Fig. 3) for macaque (a), mouse (b), chick (c), and zebrafish (d). Cluster labels are consistent with published annotations (Kolsch et al., 2021; Peng et al., 2019; Shekhar et al., 2016; Tran et al., 2019; Yamagata et al., 2021).
Extended Data Fig. 7 |
Extended Data Fig. 7 |. Evolutionary conservation of retinal classes.
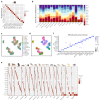
a. Dendrogram showing transcriptional relationships among pseudobulk expression vectors following integration. Each node is a cell class within a particular species. Dendrograms were computed via hierarchical clustering analysis (correlation distance, average linkage). b. Same as Fig. 2d, with cells colored by species of origin. Inset shows a magnified region containing samples from all species. c. Cross-correlation matrix (spearman) of class- and species-specific cell-averaged profiles for all 17 vertebrates (compare with Fig. 2b). Rows and columns are grouped by class, and then ordered by phylogeny within a class. d. Same as panel c, but rows and columns grouped based on species instead of class (compare with Fig. 2c). e. Pairwise cophenetic distance (y-axis) within gene expression dendrograms is correlated with evolutionary distance (x-axis). The dendrograms were computed for each class separately via hierarchical clustering (correlation distance, average linkage) (Methods). The cophenetic distance between two nodes is the height of the dendrogram where the two branches that include the two objects merge into a single branch. Panels correspond to different classes.
Extended Data Fig. 8 |
Extended Data Fig. 8 |. Evolutionary conservation of retinal subclasses.
a. UMAP embedding of integrated cross-species data (as in Fig. 2d), highlighting PR subclasses cones and rods. Insets show feature plots of cone-specific (top) and rodspecific (bottom) transcription factors (TFs). b. Same as panel a, for AC subclasses GABAergic ACs (GabaAC) and glycinergic ACs (GlyAC). Insets show feature plots of a GABAergic TF MEIS2 and a glycinergic TF TCF4. c. Same as panel a, for BC subclasses ON BCs and OFF BCs. Insets show feature plots of OFF BC-specific (top) and ON BC-specific (bottom) transcription factors (TFs). d. Heatmap showing average expression of subclass-specific genes (columns) within the six subclasses across 17 species (rows). Rows are grouped by subclass (annotation bar, left). Within each subclass, species are ordered as in Fig. 1b, with top and bottom nodes in each dendrogram corresponding to lamprey and human, respectively (corresponding to right and left in Fig. 1a). e. Cross-correlation matrix (spearman) of subclass- and species-specific pseudobulk transcriptomic profiles for all 16 jawed vertebrates. Rows and columns are grouped by subclass, and then ordered by phylogeny within a class. Lamprey was excluded due to paucity of shared orthologs. f. Same as panel d, but rows and columns grouped based on species instead of subclass.
Extended Data Fig. 9 |
Extended Data Fig. 9 |. Bipolar Cell OrthoType analysis including non-mammals.
a. Confusion matrix showing the rationale behind naming mammalian BC OTs (rows) based on the mapping patterns of mouse BC types (columns) (Shekhar et al., 2016). Representation as in Fig. 3d, with each column summing to 100%. OT BC8/9 contains mappings from both mouse BC8 and BC9, which are transcriptionally proximal. b. Barplot showing within-species relative frequencies (y-axis) of the 13 cone BC OTs within each mammalian species (x-axis). The foveal and peripheral data from primates are plotted separately. c. Integrated UMAP of BCs from all 16 jawed vertebrates. Cells are colored by species of origin. Lamprey, a jawless vertebrate, was excluded from the analysis due to the paucity of shared orthologous genes. d. Same as c, with cells colored by OT identity. The integration of all jawed vertebrates recovers all the mammalian BC OTs listed in Fig. 3c, but additionally identifies two OTs enriched for non-mammalian BCs from chick, lizard and zebrafish. The two OTs, named NM_OFF and NM_ON, are enriched for OFF and ON BCs from non-mammals (also see panel e). e. Confusion matrices showing the mapping of species-specific BC clusters (columns) to BC OTs (rows) identified by integrating BCs from all jawed vertebrates (panel c). Representation as in Fig. 3d’. Mammalian BC clusters predominantly map to the mammalian OTs (rows 1-14), and the pattern of mapping is similar to Fig. 3d. Chick, Lizard and Zebrafish BCs largely map to the non-mammalian OTs NM_OFF and NM_ON (rows 15-16). f. Dotplot showing species-specific genes (columns) expressed in RBC orthologs in mammals (rows). The size and color of each dot represent the percentage of cells within the species cluster expressing the gene and the average expression level, respectively.
Extended Data Fig. 10 |
Extended Data Fig. 10 |. Retinal Ganglion Cell OrthoType analysis including non-mammals.
a. Barplot showing within-species relative frequencies (y-axis) of the 21 RGC OTs within mammalian species (x-axis) (Fig. 4b). The foveal and peripheral data from primates are shown separately. b. Integrated UMAP of RGCs from all 15 jawed vertebrates (excluding cow). Cells are colored by species of origin. For primates, fovea and periphery are plotted separately. c. Same as b, with cells colored by RGC OT. OTs 1-21 map 1:1 to the mammalian OTs in Fig. 4b, but we recover an additional OT (NM) predominantly containing non-mammalian RGCs from chick, lizard and zebrafish (also see panel d). d. Confusion matrices showing the mapping of species RGC clusters (columns) to RGC OTs (rows) identified by integrating RGCs from all jawed vertebrates (panel c). Representation as in Fig. 4d. Mammalian RGC clusters predominantly map to the mammalian OTs (rows 1-21), and the pattern of mapping is similar to Fig. 4d. With the exception of ipRGCs, chick, lizard and zebrafish RGCs largely map the NM OT (row 22).
Extended Data Fig. 11 |
Extended Data Fig. 11 |. Midget and Parasol OTs
a. Dotplot showing examples of DE genes across OT1-4 and their expression across orthologous species-specific clusters. The size and color of each dot represent the percentage of cells within the species cluster expressing the gene and the average expression level, respectively. Column order as in Fig. 5a. b. FLDA workflow and eigenvalue analysis. The gene expression matrices of primate and mouse RGCs were combined by their shared orthologous genes. Highly variable genes were selected, and PCA was applied to remove multicollinearity. FLDA was performed on different combinations of mouse RGC candidates with known polarity and kinetics listed Supplementary Table 2. The combinations were ranked based on their FLDA eigenvalues, which measures the variance along each attribute captured in the projection. c. Visualization of the FLDA projection (Fig. 5c) along the 2D subspace corresponding to polarity (x-axis) and kinetics (y-axis) d. Relative proportion of parasol RGC orthologs in mammalian species based on the frequencies of cells in oRGC2 and oRGC5.
Fig. 1 |
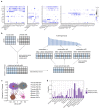
Fig. 1 |. Conserved retinal structure across vertebrates.
a. Cartoon of a section through a vertebrate retina showing the arrangement of its six major cell classes – photoreceptors (PRs), horizontal cells (HCs), bipolar cells (BCs), amacrine cells (ACs), retinal ganglion cells (RGCs), and Muller glia (MG). PRs include rods (r) and cones (c). Outer and inner nuclear layers (ONL and INL) and ganglion cell layer (GCL), which contain cell somata, are indicated as are the outer and inner plexiform (synaptic) layers (OPL, IPL). b. Phylogeny of the 17 vertebrate species analyzed in this work. For Linnaean names, see Supplementary Table 1. Scale bar on the right indicates estimated divergence time in “millions of years ago” (MYA). c. Sections from retinas of eight species immunostained for RBPMS (a pan-RGC marker), CHX10/VSX2 (a pan-BC marker), AP2A/TFAP2A (a pan-AC marker), and DAPI (a nuclear stain). Colors of the labeled cell classes as in a. Scale bars, 25 μm.
Fig. 2 |
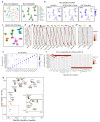
Fig. 2 |. Class- and subclass-specific transcriptomic signatures.
a. Heatmap showing average expression of marker genes (columns) within each major cell class in 17 species (rows). Rows are grouped by cell class (annotation bar, left). Within each class, species are ordered as in Fig. 1b, with top and bottom nodes in each dendrogram corresponding to lamprey and human, respectively (corresponding to right and left in Fig. 1b). Colors indicating cell class are uniform across panels (e.g. RGC is pink). b. Cross-correlation matrix (Spearman) of pseudobulk transcriptomic profiles for the 16 jawed vertebrates. Rows and columns are grouped by class, and then ordered by phylogeny within a class. c. Same as b, with rows and columns grouped by species instead of class. Matrices including lamprey (a jawless vertebrate) are shown in Extended Data Fig. 7c,d. d. UMAP embedding of integrated cross-species data, with points indicating class identity. d’. Same as d, with panels showing cells colored by their expression levels of subclass-specific markers. Within each panel, the gene and labeled cell subclass are indicated. The left, middle and right panel columns correspond to subclasses of PRs (Cones, upper; Rods, lower), ACs (Glycinergic ACs, upper; GABAergic ACs, lower) and BCs (OFF BCs, upper; ON BCs, lower). GAD1, a marker for GABAergic ACs among ACs, is also expressed by some HCs, and ISL1, a marker for ON BCs among BCs, is also expressed by some RGCs, HCs, and ACs. Details of gene expression by species are shown in Extended Data Fig. 8d. e. Pairwise correlation coefficients of class-specific cell-averaged profiles between species (y-axis) decreases with evolutionary divergence (x-axis) for each cell class. Gray shaded regions demarcate pairwise comparisons involving a non-mammalian vertebrate. In each panel, the trendlines were estimated using locally estimated scatterplot smoothing regression (LOESS). The y vs. x relationship for x < 100 MYA can be described well by a linear fit, with R2 values in the range 0.81-0.85. The linear fit (black line), equation and R2 values are shown for RGCs. MYA, million years ago.
Fig. 3 |
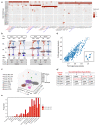
Fig. 3 |. Multispecies integration of bipolar cells
a. UMAP of mammalian BCs computed with the raw (left) and integrated (right) gene expression matrices. Cells are colored by species of origin. b. Feature plots showing expression within the integrated space of a rod BC marker PRKCA (left), an ON BC marker ISL1 (middle) and an OFF BC marker GRIK1 (right). c. Same as the right panel of a, but with cells colored based on OrthoType (OT) identity as documented in Extended Data Fig. 9a. d. Confusion matrix showing specific mapping between mouse BC types and mammalian BC OTs. Each element represents the percentage of cells from a mouse BC type (column) that maps to a mammalian BC OT (row; see scale on the right of panel d”). Each column sums to 100%. See Extended Data Fig. 9a for a higher magnification view. d’. Confusion matrix showing specific mapping between species-specific BC clusters (Extended Data Figs. 3–6) and mammalian BC OTs. Representation as in panel d. Columns are grouped by mammalian species demarcated by vertical black lines. d’’. Confusion matrices showing the mapping of BC clusters (columns) in lizard, chick and zebrafish to the mammalian BC OTs. Mapping that includes non-mammalian OTs is shown in Extended Data Fig. 9e. e. Dotplot showing differentially expressed genes (columns) within each BC OT (rows). The size of the dot represents the number of mammalian species (out of 13) that express the gene in at least 30% of cells mapping to the correspond OT, while the color represents normalized expression level. f. Confusion matrix showing the species BC clusters (columns) that map specifically to the OTs oRBC and oBCIB. BC types are named based on their species of origin and within-species BC cluster ID (Extended Data Figs. 3–6). For example, Peromyscus BC cluster 1 is called “Per_1”. g. Scatter plot showing the relative frequencies of rods among PRs (y-axis) vs. rod BCs among BCs (x-axis) for all jawed vertebrate species in this study (points, icons). For primates, data from fovea and periphery are plotted as separate points. The region demarcated by the dashed red box near the origin is expanded in the inset. RBC proportions were calculated from the atlases (Extended Data Fig. 3–6), while rod proportions were obtained from literature (see Supplementary Note 1).>
Fig. 4 |
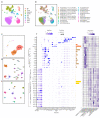
Fig. 4 |. Multispecies integration of retinal ganglion cells.
a. Integrated UMAP of RGCs from 12 mammals (Cow was excluded due to paucity of RGC data.). Cells are labeled by species of origin. For primates, cells from fovea and periphery are plotted separately. b. Same as a, with RGCs labeled by OT. c. Dotplot showing differentially expressed genes (columns) within each RGC OT (rows). Representation as in Fig. 3e. d. Confusion matrices showing that species-specific RGC clusters (Extended Data Fig. 3–6) map to mammalian RGC OTs in a specific fashion. Representation as in Fig. 3d’ except that clusters from Fovea (F) and Periphery (P) are mapped separately for primates. d’. Confusion matrices showing the mapping of RGC clusters (columns) in lizard, chick and zebrafish to the 21 mammalian RGC OTs. Mapping to the single non-mammalian RGC OT is shown in Extended Data Fig. 10d. e. Confusion matrix showing the species-specific RGC clusters (columns) that map to the oRGC8 and 9, corresponding to ipRGCs. Representation as in Fig. 3f. Annotation bar (bottom) highlights species-specific RGC clusters that express OPN4 and EOMES, a transcription factor expressed selectively by ipRGCs (Rheaume et al., 2018; Tran et al., 2019). f. Confusion matrix showing that mouse RGC types (rows; naming as in ref. 19) belonging to TF-based subsets (Shekhar et al., 2022) (colors) map to the same OTs (columns). f’. Dotplot showing specific expression patterns of subclass-specific TFs (Shekhar et al., 2022) in OTs. Representation as in Fig. 3e.
Fig. 5 |
Fig. 5 |. Mammalian orthologs of midget and parasol RGCs.
a. Confusion matrix showing RGC clusters from each species (columns) that map specifically to oRGC1, oRGC4, oRGC5 and oRGC2, which respectively contain OFF and ON midget RGCs (MG), and OFF and ON parasol RGCs (PG). Representation as in Fig. 3f. Columns corresponding to primate midget and parasol types are shown in red, and mouse α-RGC types are shown in blue. b. Schematic delineating morphological and physiological similarities between primate/midget RGCs and their α-RGC orthologs. OrthoTypes of each pair as well as the orthology among BC types that innervate them is also shown. Morphologies of neuronal types were created based on published data (Supplementary Note 2). Within each pair, the left column corresponds to primate types and the right column corresponds to mouse types. c. FLDA projection of the scRNA-seq data for primate midget and parasol, and mouse α-RGC types onto the corresponding three-dimensional space with axes representing species, polarity and kinetics. d. Scatter plot of the FLDA eigenvalues for the kinetics (y-axis) vs. polarity (x-axis), measuring the magnitude of the variance corresponding to these attributes captured in the projection. Inset highlights the top four matches. d’. Mouse RGC types present within the top four matching combinations with primate midget and parasol RGCs. e. Relative proportion of OFF and ON midget RGC orthologs in mammalian species based on the frequencies of cells in oRGC1 and oRGC4.

References

    1. Alfoldi J., and Lindblad-Toh K. (2013). Comparative genomics as a tool to understand evolution and disease. Genome Res 23, 1063–1068. 10.1101/gr.157503.113. - DOI - PMC - PubMed
    1. Baden T., Euler T., and Berens P. (2020). Understanding the retinal basis of vision across species. Nat Rev Neurosci 21, 5–20. 10.1038/s41583-019-0242-1. - DOI - PubMed
    1. Becht E., McInnes L., Healy J., Dutertre C.-A., Kwok I.W., Ng L.G., Ginhoux F., and Newell E.W. (2019). Dimensionality reduction for visualizing single-cell data using UMAP. Nature biotechnology 37, 38–44. - PubMed
    1. Berson D. (2008). Retinal ganglion cell types and their central projections.
    1. Cajal S.R.Y. (1893). La retine des vertebres. Cellule 9, 119–255.

Publication types