[Preprint]. 2024 Jan 17:2023.04.03.535495.
doi: 10.1101/2023.04.03.535495.

Single cell 'omic profiles of human aortic endothelial cells in vitro and human atherosclerotic lesions ex vivo reveals heterogeneity of endothelial subtype and response to activating perturbations

Affiliations

Single cell 'omic profiles of human aortic endothelial cells in vitro and human atherosclerotic lesions ex vivo reveals heterogeneity of endothelial subtype and response to activating perturbations

Maria L Adelus et al. bioRxiv. .

Update in

Abstract

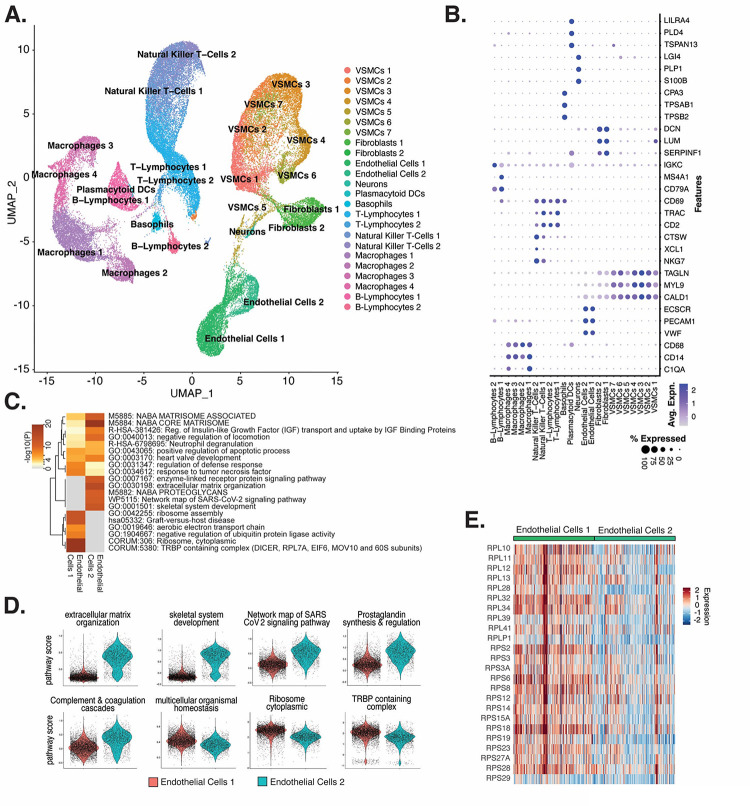
Objective: Endothelial cells (ECs), macrophages, and vascular smooth muscle cells (VSMCs) are major cell types in atherosclerosis progression, and heterogeneity in EC sub-phenotypes are becoming increasingly appreciated. Still, studies quantifying EC heterogeneity across whole transcriptomes and epigenomes in both in vitro and in vivo models are lacking.

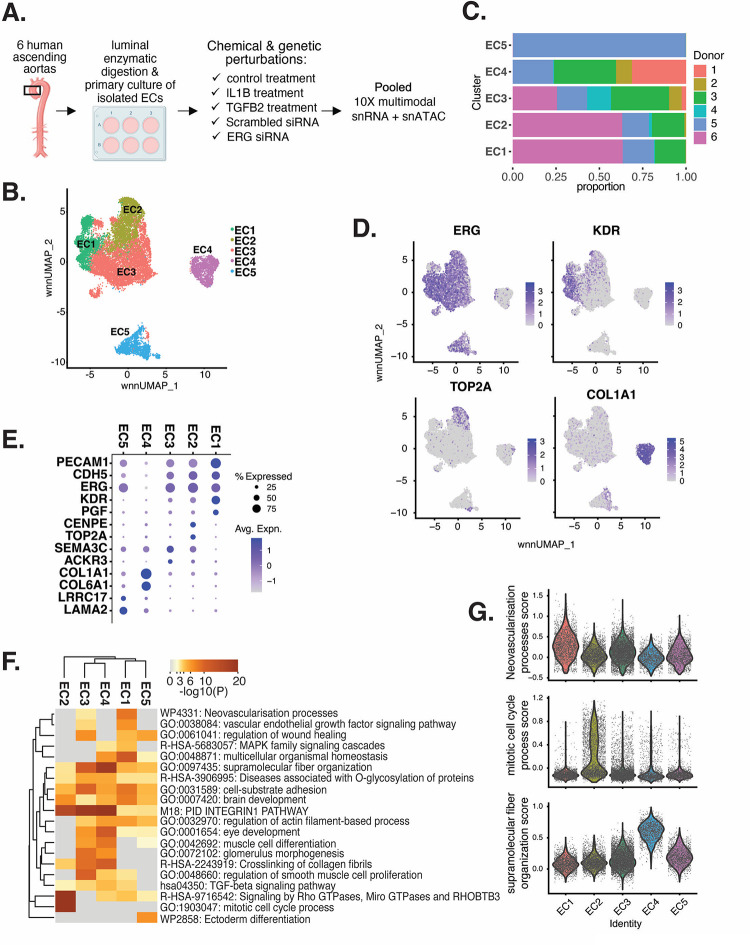
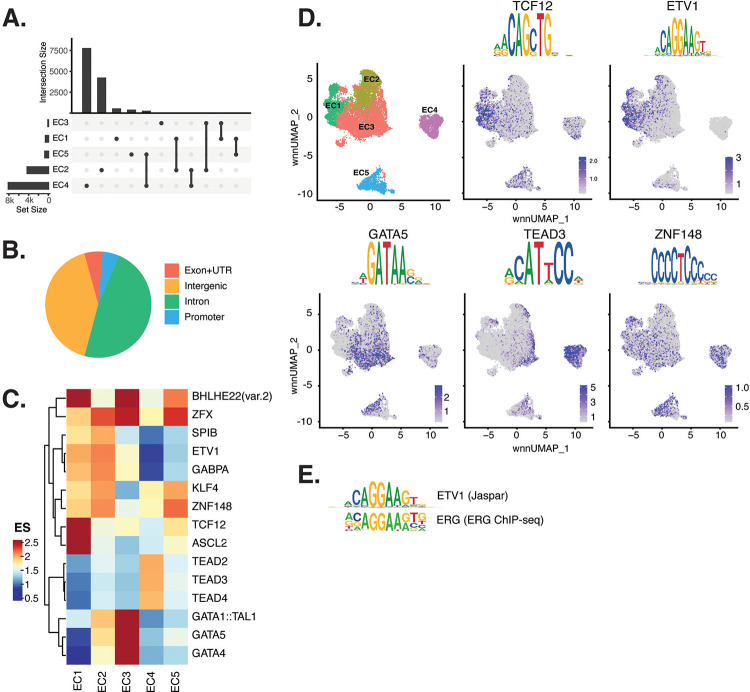
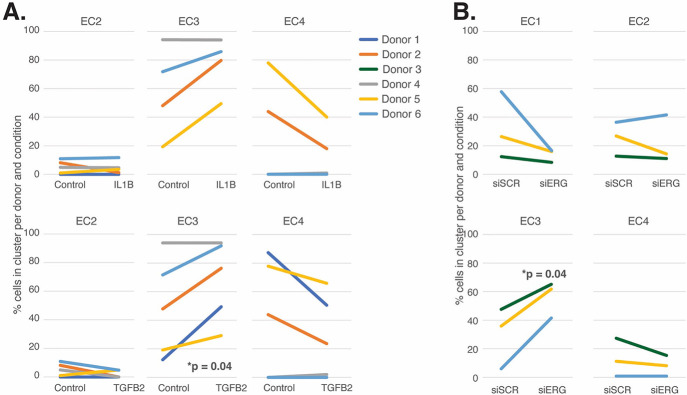
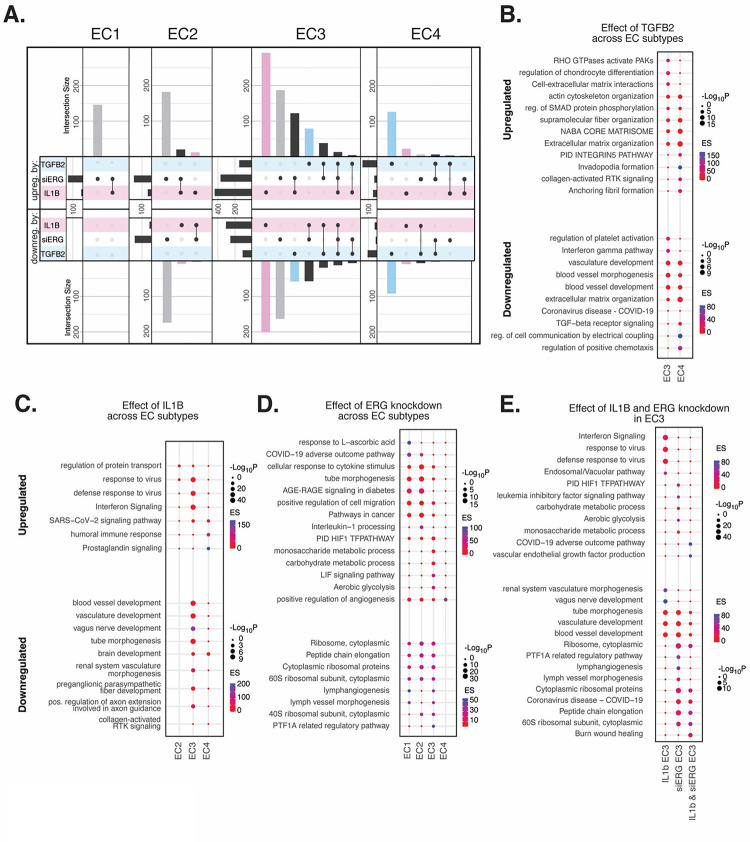
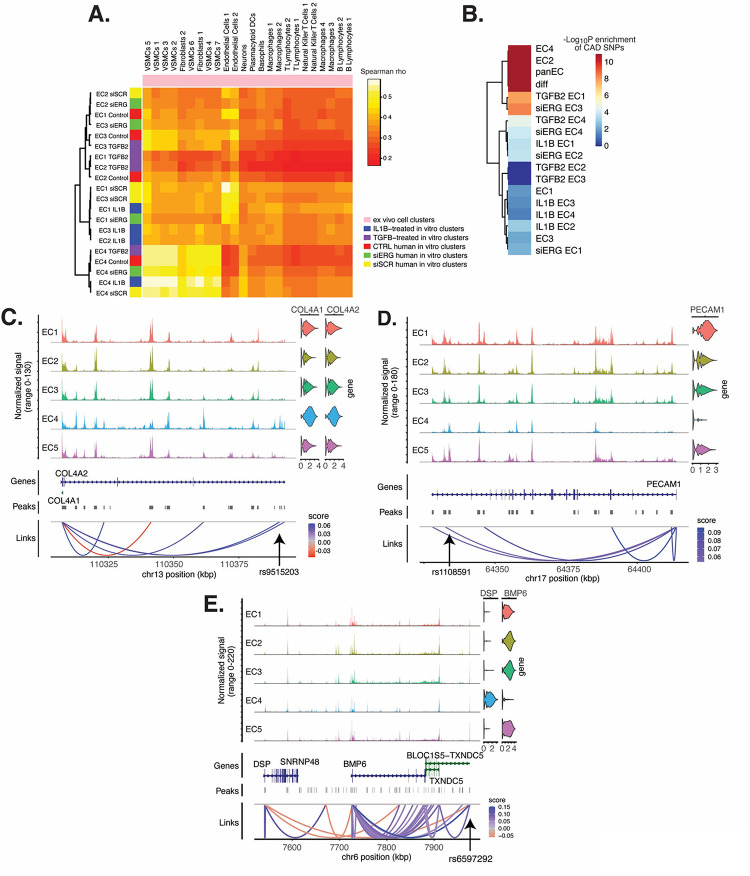
Approach and results: To create an in vitro dataset to study human EC heterogeneity, multiomic profiling concurrently measuring transcriptomes and accessible chromatin in the same single cells was performed on six distinct primary cultures of human aortic ECs (HAECs). To model pro-inflammatory and activating environments characteristic of the atherosclerotic microenvironment in vitro, HAECs from at least three donors were exposed to three distinct perturbations with their respective controls: transforming growth factor beta-2 (TGFB2), interleukin-1 beta (IL1B), and siRNA-mediated knock-down of the endothelial transcription factor ERG (siERG). To form a comprehensive in vivo/ex vivo dataset of human atherosclerotic cell types, meta-analysis of single cell transcriptomes across 17 human arterial specimens was performed. Two computational approaches quantitatively evaluated the similarity in molecular profiles between heterogeneous in vitro and in vivo cell profiles. HAEC cultures were reproducibly populated by 4 major clusters with distinct pathway enrichment profiles: EC1-angiogenic, EC2-proliferative, EC3-activated/mesenchymal-like, and EC4-mesenchymal. Exposure to siERG, IL1B or TGFB2 elicited mostly distinct transcriptional and accessible chromatin responses. EC1 and EC2, the most canonically 'healthy' EC populations, were affected predominantly by siERG; the activated cluster EC3 was most responsive to IL1B; and the mesenchymal population EC4 was most affected by TGFB2. Quantitative comparisons between in vitro and in vivo transcriptomes confirmed EC1 and EC2 as most canonically EC-like, and EC4 as most mesenchymal with minimal effects elicited by siERG and IL1B. Lastly, accessible chromatin regions unique to EC2 and EC4 were most enriched for coronary artery disease (CAD)-associated SNPs from GWAS, suggesting these cell phenotypes harbor CAD-modulating mechanisms.

Conclusion: Primary EC cultures contain markedly heterogeneous cell subtypes defined by their molecular profiles. Surprisingly, the perturbations used here, which have been reported by others to be involved in the pathogenesis of atherosclerosis as well as induce endothelial-to-mesenchymal transition (EndMT), only modestly shifted cells between subpopulations, suggesting relatively stable molecular phenotypes in culture. Identifying consistently heterogeneous EC subpopulations between in vitro and in vivo models should pave the way for improving in vitro systems while enabling the mechanisms governing heterogeneous cell state decisions.


Conflict of interest statement

CONFLICT OF INTEREST STATEMENT The authors declare that there is no conflict of interest.

Figures

Figure 1 |
Figure 1 |. HAEC transcriptomic profiling discover a heterogenous cell population.
(A), Schematic diagram of the experimental design. ECs were isolated from six human heart transplant donor’s ascending aortic trimmings and treated with IL1B, TGFB2, or siERG (ERG siRNA) for 7 days (B), Weighted Nearest Neighbor UMAP (WNNUMAP) of aggregate cells from all perturbations and donors is shown. Each dot represents a cell, and the proximity between each cell approximates their similarity of both transcriptional and epigenetic profiles. Colors denote cluster membership. (C), The proportion of cells from each donor for each EC subtype. (D), Gene expression across top markers for each cluster including pan EC (ERG), EC1 (KDR), EC2 (TOP2A), and EC4 (COL1A1). (E), Top markers for pan EC (PECAM1, CDH5, ERG), EC1 (KDR, PGF), EC2 (CENPE, TOP2A), EC3 (SEMA3C, ACKR3), EC4 (COL1A1, COL6A1), and EC5 (LRRC17, LAMA2). The size of the dot represents the percentage of cells within each EC subtype that express the given gene, while the shade of the dot represents the level of average expression (“Avg. Expn.” in the legend). (F), Heatmap of pathway enrichment analysis (PEA) results from submitting top 200 differentially expressed genes (DEGs; by ascending p-value) between EC subtypes. Rows (pathways) and columns (EC subtypes) are clustered based on −Log10(P) (G), Violin plots of top Metascape pathway module scores across EC subtypes. Module scores are generated for each cell barcode with the Seurat function AddModuleScore().
Figure 2 |
Figure 2 |. ECs have epigenetically distinct cell states.
(A), Upset plot of differential peaks across EC subtypes. Intersection size represents the number of genes at each intersection, while set size represents the number of genes for each EC subtype. (B), Genomic annotation for the complete peak set. (C), Heatmap of top transcription factors (TFs) from motif enrichment analysis for marker peaks in each EC subtype. Top TFs for each EC subtype are selected based on ascending p-value. Rows (TFs) and columns (EC subtype) are clustered based on enrichment score (ES). (D), Feature plots and position weight matrices (PWMs) for top TF binding motifs for EC1 (TCF12), EC2 (ETV1), EC3 (GATA5), and EC4 (TEAD3). Per-cell motif activity scores are computed with chromVAR, and motif activities per cell are visualized using the Signac function FeaturePlot. (E), PWMs comparing Jaspar 2020 ETV1 motif to ERG motif reported in Hogan et al.
Figure 3 |
Figure 3 |. EC activating perturbations modestly shift cells into the EC3 subtype.
(A), The proportion of cells in 7-day control and 7-day IL1B treatment are shown per HAEC donor and cluster on the top and for 7-day control and 7-day TGFB2 on the bottom (B), The proportion of cells in 7-day siSCR control and 7-day siERG knock-down are shown per HAEC donor and cluster. EC1 was omitted in A due to lack of cells in both conditions.
Figure 4 |
Figure 4 |. EC activating perturbations in vitro elicit EC subtype-specific transcriptional responses.
(A), Upset plots of up- and down-regulated DEGs across EC subtypes with siERG (grey), IL1B (pink), and TGFB2 (blue). Upset plots visualize intersections between sets in a matrix, where the columns of the matrix correspond to the sets, and the rows correspond to the intersections. Intersection size represents the number of genes at each intersection. (B), PEA for EC3–4 up- and down-regulated DEGs with TGFB2 compared to control media. (C), PEA for EC2–4 up- and down-regulated DEGs with IL1B compared to control media. (D), PEA for EC1–4 up- and down-regulated DEGs with siERG compared to siSCR. (E), PEA comparing up- and down-regulated DEGs that are mutually exclusive and shared between IL1B and siERG in EC3.
Figure 5 |
Figure 5 |. ECs from ex vivo human atherosclerotic plaques show two major populations.
(A), scRNA-seq UMAP of different cell subtypes across 17 samples of ex vivo human atherosclerotic plques. (B), Dot plot of top markers for each cell type. (C), Heatmap of pathway enrichment analysis (PEA) results generated from submitting 200 differentially expressed genes (DEGs) between Endothelial Cells 1 (Endo1) and Endothelial Cells 2 (Endo2). Rows (pathways) and columns (cell subtypes) are clustered based on −Log10(P). (E), Heatmap displaying expression of genes belonging to ribosome cytoplasmic pathway for Endo1 and Endo2.
Figure 6 |
Figure 6 |. EC subtype is a major determinant in the ability to recapitulate ‘omic profiles seen in atherosclerosis.
(A), Heatmap displaying average expression between in vitro perturbation-subtype combinations and ex vivo cell subtypes using all up- and down-regulated genes between IL1B, TGFB2, or siERG versus respective controls. Spearman correlation was used as the distance metric. Rows (in vitro EC subtypes) and columns (ex vivo cell subtypes) are clustered using all significant genes (adjusted p-value < 0.05) induced and attenuated across all in vitro EC subtypes for each perturbation versus its respective control. (B), Heatmap of CAD-associated SNP enrichments across in vitro EC subtypes and perturbation-subtype combinations. Rows (EC subtypes and perturbation-subtype combinations) are clustered using −Log10(P) for enrichment in significant CAD-associated SNPs (p-value < 5×10⁻⁸). Note that “diff” represents peaks common to more than one EC subtype; it is found by subtracting EC1–5 subtype-specific peaks from the entire in vitro peak set (termed “panEC”). (C), Coverage plots displaying links for COL4A1/COL4A2 genes to EC4-specific peaks, including one overlapping with CAD-associated SNP rs9515203. (D), Coverage plot showing links for PECAM1 gene to EC4-specific peaks, including one overlapping with CAD-associated SNP rs1108591. (E), Coverage plot showing links for BMP6 gene to EC4-specific peaks, including one overlapping with CAD-associated SNP rs6597292.

References

    1. Brown JC, Gerhardt TE, Kwon E. Risk factors for coronary artery disease. StatPearls; [Internet]. 2020. - PubMed
    1. Hajra L, Evans AI, Chen M, Hyduk SJ, Collins T, Cybulsky MI. The NF-κB signal transduction pathway in aortic endothelial cells is primed for activation in regions predisposed to atherosclerotic lesion formation. Proceedings of the National Academy of Sciences. 2000;97(16):9052–7. - PMC - PubMed
    1. Birdsey GM, Shah AV, Dufton N, Reynolds LE, Almagro LO, Yang Y, et al. The endothelial transcription factor ERG promotes vascular stability and growth through Wnt/β-catenin signaling. Developmental cell. 2015;32(1):82–96. - PMC - PubMed
    1. Marenberg ME, Risch N, Berkman LF, Floderus B, de Faire U. Genetic susceptibility to death from coronary heart disease in a study of twins. New England Journal of Medicine. 1994;330(15):1041–6. - PubMed
    1. Aragam KG, Jiang T, Goel A, Kanoni S, Wolford BN, Atri DS, et al. Discovery and systematic characterization of risk variants and genes for coronary artery disease in over a million participants. Nature Genetics. 2022;54(12):1803–15. - PMC - PubMed

Publication types