[Preprint]. 2023 Apr 5:rs.3.rs-2644705.
doi: 10.21203/rs.3.rs-2644705/v1.

Dermis resident macrophages orchestrate localized ILC2-eosinophil circuitries to maintain their M2-like properties and promote non-healing cutaneous leishmaniasis

Affiliations

Dermis resident macrophages orchestrate localized ILC2-eosinophil circuitries to maintain their M2-like properties and promote non-healing cutaneous leishmaniasis

Sang Hun Lee et al. Res Sq. .

Update in

Abstract

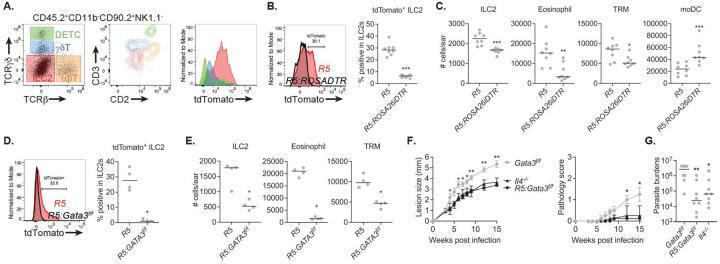
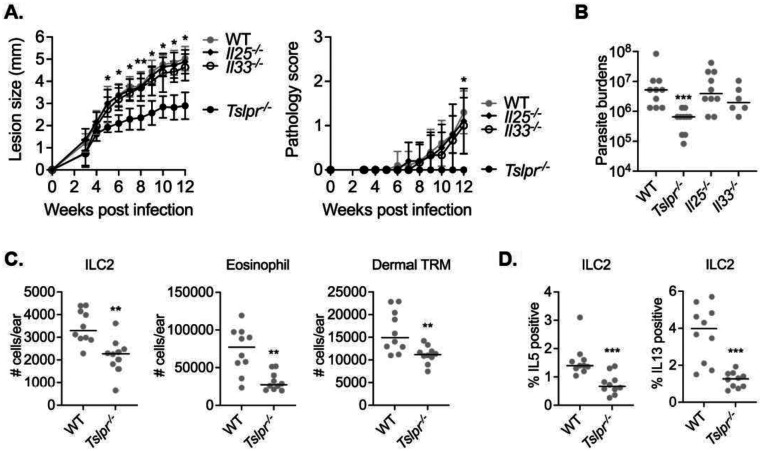
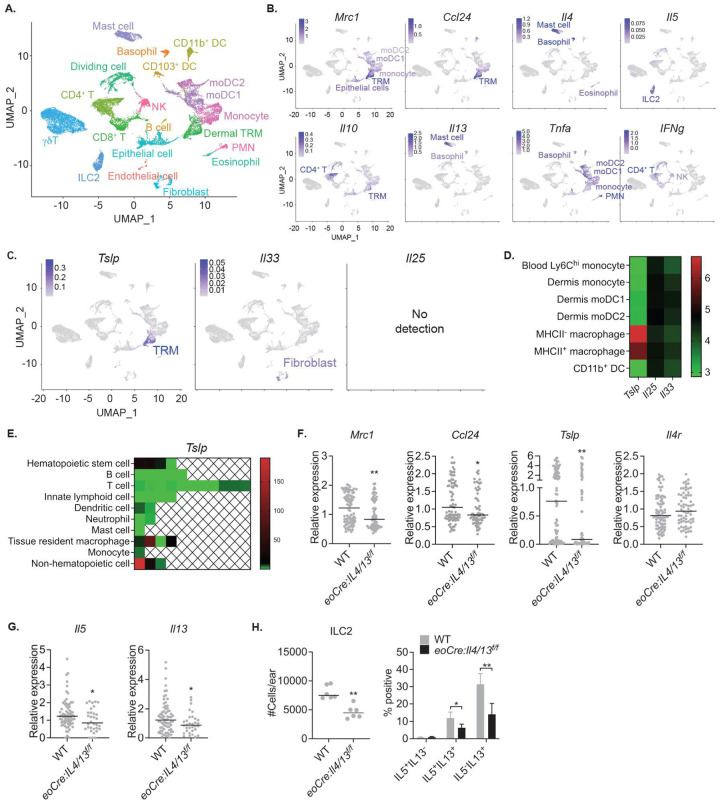
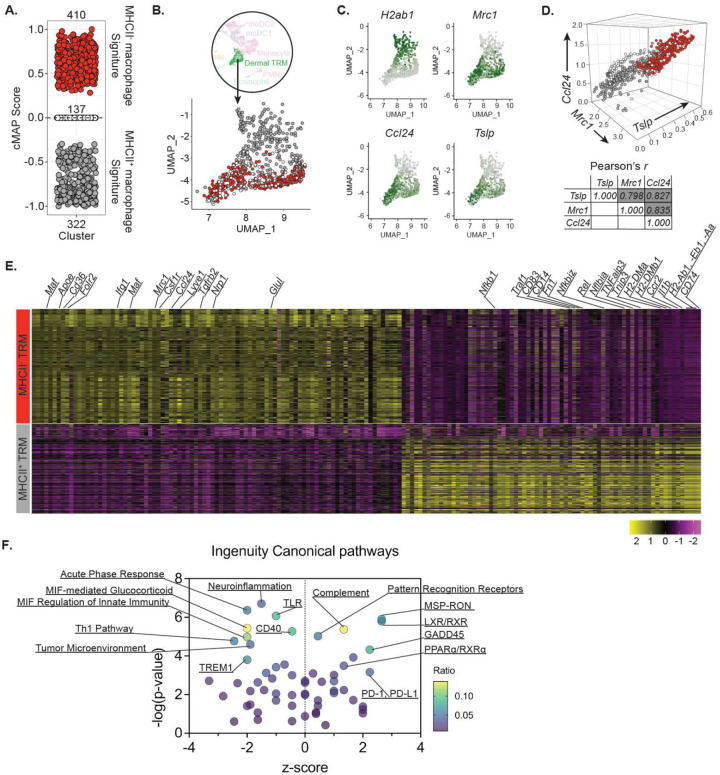
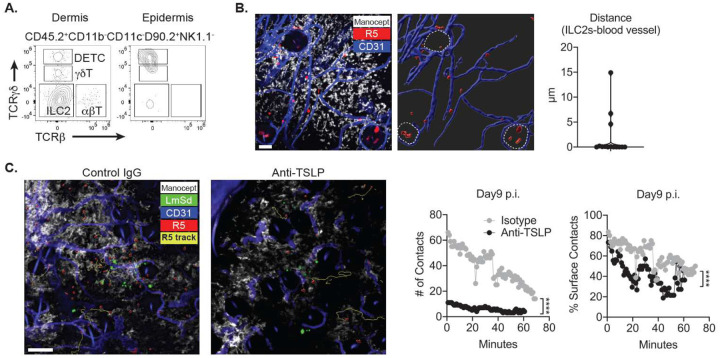
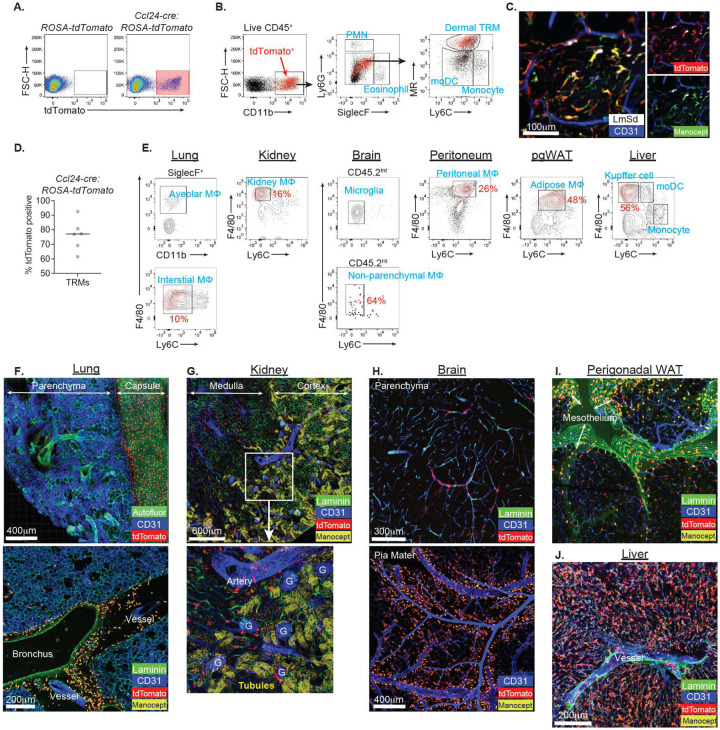
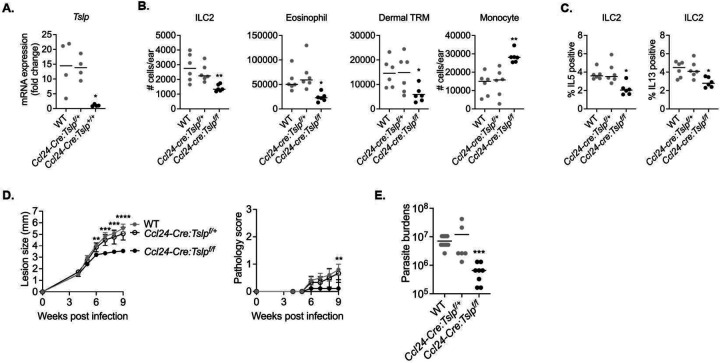
Tissue-resident macrophages (TRMs) are critical for tissue homeostasis/repair. We previously showed that dermal TRMs produce CCL24 (eotaxin2) which mediates their interaction with IL-4 producing eosinophils, required to maintain their number and M2-like properties in the TH1 environment of the Leishmania major infected skin. Here, we unveil another layer of TRM self-maintenance involving their production of TSLP, an alarmin typically characterized as epithelial cell-derived. Both TSLP signaling and IL-5+ innate lymphoid cell 2 (ILC2s) were shown to maintain the number of dermal TRMs and promote infection. Single cell RNA sequencing identified the dermal TRMs as the sole source of TSLP and CCL24. Development of Ccl24-cre mice permitted specific labeling of dermal TRMs, as well as interstitial TRMs from other organs. Genetic ablation of TSLP from dermal TRMs reduced the number of dermal TRMs, and disease was ameliorated. Thus, by orchestrating localized type 2 circuitries with ILC2s and eosinophils, dermal TRMs are self-maintained as a replicative niche for L. major.

Keywords: CCL24; IL-4; IL-5; ILC2; Leishmania major; TSLP; Tissue-resident macrophages; eosinophil.


Conflict of interest statement

Declaration of interests The authors declare no competing interests.

Figures

Figure 1.
Figure 1.. IL5+ ILC2s are required to maintain M2-like dermal TRMs which play a critical role in non-healing L. major infection.
(A) Representative flow cytometric analysis of ear isolates prepared from naive R5 : ROSA26-LSLtdTomato mice. CD45.2+CD11bCD90.2+NK1.1-gated cells were analyzed for the expression of TCRb and TCRgd, and subdivided into DETCs (green; TCRgdhighTCRb), gdT cells (blue; TCRgdintTCRb), ILC2s (Red; TCRgdTCRb), and abT cells (orange; TCRgdTCRb+). Both CD2/CD3 and tdTomato expression were shown by overlaying color-coded populations in CD2-CD3 axes and histogram respectively. (B) tdTomato expression in ILC2s and (C) the absolute numbers of indicated cells recovered from ears of R5 vs. R5 : ROSA26iDTR mice were measured at 12 days p.i. with 2×10⁵ LmSd followed by DT treatment. (D and E) The same parameters as above in ear isolates prepared from R5 : Gata3f/f mice at day 12 p.i. with 2×10⁵ LmSd are shown. (F) Lesion development and pathology score over the course of infection with 103 LmSd metacyclic promastigotes in the ear dermis of Gata3f/f, Il4−/−, and R5 : Gata3f/f animals (n = 8). (G) Parasite burdens were quantified at 12 weeks p.i.. Values represent mean +/− standard deviation. *P < 0.05, **P < 0.01, and ***p <0.01 by non-parametric Mann-Whitney test (B-E) and one-way ANOVA with Dunn’s posttest compared with Gata3f/f (F and G). Data are representative of two independent experiments (A-G).
Figure 2.
Figure 2.. TSLP receptor signaling promotes non-healing L. major infection.
(A) Lesion development and pathology score over the course of infection with 103 LmSd metacyclic promastigotes in the ear dermis of WT, Il25−/−, Il33−/−, and Tslpr−/− mice (n = 6 to 10). (B) Parasite burdens were quantified at 12 weeks p.i.. (C) The absolute numbers of indicated cells and (D) IL5/IL13 expressions in ILC2s from ear isolates of WT and Tslpr−/− mice were compared at 12 days p.i. with 2×10⁵ LmSd. Values represent mean +/− standard deviation. *P < 0.05, **P < 0.01, and ***P < 0.001 by one-way ANOVA with Dunn’s posttest compared with Tslpr−/− (A) and non-parametric Mann-Whitney test (B-D). Data are representative of two independent experiments (A-D).
Figure 3.
Figure 3.. TSLP is expressed by dermal TRMs during L. major infection.
(A) UMAP plot representing of 17,355 cells combined from 4 samples; naïve WT (4,592 cells) and eoCre : Il4/13f/f (5,913 cells), and infected WT (3,728 cells) and eoCre : Il4/13f/f (3,552 cells) mice, 12 days post-challenge with 2 × 10⁵ LmSd in the ear dermis. (B and C) Selected gene expression UMAP plots. The identities of expressing cells were labeled and color-coded as the magnitude of expressions in scale. (D) Heat map to visualize Tslp, Il25, and Il33 expression of indicated dermal myeloid cells, generated from Expression (GEO) database (Tamoutounour et al., 2013). (E) Comparison of Tslp transcription from various immune cells published by Immgen (Gautier et al., 2012). The relative expression of Tslp gene is shown as a heat map among the indicated populations. Each square represents either a specified subset or population of the specified cell isolated from different organs. (F) Dot plots of expressed transcripts within dermal TRMs and (G) ILC2s from infected WT and eoCre : Il4/13f/f animals. (H) The absolute numbers and % IL4/IL13+ ILC2s from ear isolates of WT and eoCre : Il4/13f/f mice at 12 days p.i. with 2 × 10⁵ LmSd. Values represent mean +/− standard deviation. *P < 0.05 and **P < 0.01 non-parametric Mann-Whitney test (F-H). Data are representative of two independent experiments (H). See also supplemental Figure 1, 2, and 3.
Figure 4.
Figure 4.. Characterization of MHCII+ and MHCII subpopulation of dermal TRMs in scRNA-seq.
(A) cMAP analysis of dermal TRMs showing their enrichment for either MHCII+ (gray) or MHCII (red) dermal macrophage transcriptomes (Ly6ClowCD64highMerTK+) which were previously published (Tamoutounour et al., 2013). Cells having transcriptional similarity to neither subset are marked as zero cMAP score (clear). (B) UMAP of dermal TRMs overlayed by MHCII+ (gray) and MHCII (red) subsets color-coded by cMAP analysis in (A). (C) Selected gene expression UMAP plots of dermal TRMs. (D) 3-dimensional scatter plot showing statistical correlation between Mrc1, Tslp, and Ccl24 gene expressions in MHCII+ (gray) or MHCII (red) dermal TRMs. (E) The heatmap of DEGs (absolute logFC > 0.5 and p_val_adj < 0.05) and (F) IPA analysis between MHCII+ (gray) and MHCII (red) dermal TRMs. See also supplemental Figure 4.
Figure 5.
Figure 5.. TSLP promotes ILC2 infiltration and interaction with dermal TRMs during L. major infection.
(A) Representative flow cytometric analysis of isolates from epidermal and dermal layers of a naive ear skin to determine the tissue distribution of DETC, gdT, ILC2, and abT cells. (B) Image obtained from an IVM of the ear of R5 : ROSA26-LSL-tdTomato reporter mouse intravenously injected with efluor450 anti-CD31 Abs to label blood vessels, and its 3-dimensional surface rendering (right panel). Hair follicles are demarcated by dotted lines. The closest distance between dermal ILC2 and blood vessel was measured and plotted in the right panel. (C) Image obtained from an IVM of the ear of R5 : ROSA26-LSL-tdTomato reporter mouse infected intradermally with 1 × 10³ LmSd-GFP parasites and treated with either TSLP-neutralizing Abs or control IgG for 9 days. R5 : ROSA26-LSLtdTomato mice were injected with Cy5-Manocept to label MRhigh dermal TRMs and efluor450 anti-CD31 Abs for blood vessels. Yellow-colored “R5 track” show the paths followed by tdTomato+ ILC2s. Both the number and % surface of contacts per timepoint between ILC2s and dermal TRMs were analyzed and plotted in right panels. ****P < 0.0001 by nonparametric Mann-Whitney test. Data are representative of more than 4 independent mouse experiments (A-C).
Figure 6.
Figure 6.. Ccl24-cre transgenic mice target MHCIIMRhigh dermal TRMs and TRMs in multiple tissues.
(A) Representative flow cytometric analysis of ear isolates from ROSA26-LSL-tdTomato mice vs. Ccl24-cre : ROSA26-LSL-tdTomato mice infected with LmSd-GFP for 8 days. (B) Live CD45.2+ singlets were gated into eosinophils, PMNs, inflammatory monocytes, moDCs, and dermal TRMs. The tdTomato+ cells in red were overlayed onto gatings. (C) Representative confocal image of ear dermis of infected Ccl24-cre : ROSA26-LSL-tdTomato mice which were intravenously injected with efluor450 anti-CD31 Abs and Cy5-Manocept. (D) Quantification of percent tdTomato positive of dermal TRMs in (B). (E) Flow cytometric analysis of tdTomato+ cells in Ccl24-cre : ROSA26-LSL-tdTomato mice which were overlayed onto gatings for indicated organs. pgWAT; perigonadal white adipose tissue. The complete gating strategies are shown in sFigure 6. Percent tdTomato positive of TRMs are labeled in red. (F-J) Immunohistochemistry analysis of Alexa488-Laminin Abs stained tissue sections or whole mount from Ccl24-cre : ROSA26-LSL-tdTomato mice which were intravenously injected with efluor450 anti-CD31 Abs and Cy5-Manocept. G; glomerulus. Tubules; Renal tubules which were visualized with filtered Cy5-Manocept. Data are representative of more than 3 independent mouse experiments (A-C). See also supplemental Figure 5 and 6.
Figure 7.
Figure 7.. TSLP from dermal TRMs promotes non-healing L. major infection.
(A) Quantification of Tslp expression from the sorted MRhigh dermal TRMs of WT, Ccl24-cre : Tslpf/+, Ccl24-cre : Tslpf/f animals at 12 days p.i. with 2 × 10⁵ parasites. (B) The absolute numbers of indicated cells and (C) % IL-5+ or IL-13+ ILC2s recovered from ears of WT, Ccl24-cre : Tslpf/+, Ccl24-cre : Tslpf/f animals were measured at 12 days p.i. with 2×10⁵ LmSd. (D) Lesion development and pathology scores over the course of infection with 103 LmSd metacyclic promastigotes in the ear dermis of WT, Ccl24-cre : Tslpf/+, Ccl24-cre : Tslpf/f animals (n = 5 – 9). (E) Parasite burdens were quantified at 9 weeks p.i. Values represent mean +/− standard deviation. *P < 0.05, **P < 0.01, ***P < 0.001, and ****P <0.0001 by one-way ANOVA with Dunn’s post-test compared to Ccl24-cre : Tslpf/f animals (A-E). Data are representative of two independent experiments (A-E).

Similar articles

References

    1. Davies L.C., Jenkins S.J., Allen J.E. & Taylor P.R. Tissue-resident macrophages. Nat Immunol 14, 986–995 (2013). - PMC - PubMed
    1. Davies L.C. & Taylor P.R. Tissue-resident macrophages: then and now. Immunology 144, 541–548 (2015). - PMC - PubMed
    1. Guilliams M. et al. Alveolar macrophages develop from fetal monocytes that differentiate into long-lived cells in the first week of life via GM-CSF. J Exp Med 210, 1977–1992 (2013). - PMC - PubMed
    1. Sabatel C. et al. Exposure to Bacterial CpG DNA Protects from Airway Allergic Inflammation by Expanding Regulatory Lung Interstitial Macrophages. Immunity 46, 457–473 (2017). - PubMed
    1. Tamoutounour S. et al. Origins and functional specialization of macrophages and of conventional and monocyte-derived dendritic cells in mouse skin. Immunity 39, 925–938 (2013). - PubMed

Publication types

LinkOut - more resources