A glycine zipper motif is required for the translocation of a T6SS toxic effector into target cells
- PMID: 37066763
- PMCID: PMC10240207
- DOI: 10.15252/embr.202356849
A glycine zipper motif is required for the translocation of a T6SS toxic effector into target cells
Abstract
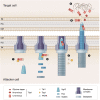
Type VI secretion systems (T6SSs) can deliver diverse toxic effectors into eukaryotic and bacterial cells. Although much is known about the regulation and assembly of T6SS, the translocation mechanism of effectors into the periplasm and/or cytoplasm of target cells remains elusive. Here, we use the Agrobacterium tumefaciens DNase effector Tde1 to unravel the mechanism of translocation from attacker to prey. We demonstrate that Tde1 binds to its adaptor Tap1 through the N-terminus, which harbors continuous copies of GxxxG motifs resembling the glycine zipper structure found in proteins involved in the membrane channel formation. Amino acid substitutions on G39 xxxG43 motif do not affect Tde1-Tap1 interaction and secretion but abolish its membrane permeability and translocation of its fluorescent fusion protein into prey cells. The data suggest that G39 xxxG43 governs the delivery of Tde1 into target cells by permeabilizing the cytoplasmic membrane. Considering the widespread presence of GxxxG motifs in bacterial effectors and pore-forming toxins, we propose that glycine zipper-mediated permeabilization is a conserved mechanism used by bacterial effectors for translocation across target cell membranes.
Keywords: Agrobacterium tumefaciens; DNase effector; Type VI secretion system; glycine zipper; translocation.
© 2023 The Authors. Published under the terms of the CC BY 4.0 license.
Figures
- A
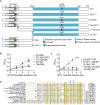
Schematic domain organization of Tde1 protein and its variants. The N‐terminal repeated glycine zipper motifs (12–51) overlapping a predicted transmembrane domain (22–42) and Ntox15 DNase domain (99–247) are indicated. Tde1 and its variants with truncation or amino acid substitutions were illustrated.
- B, C
(B) Growth inhibition assay of E. coli DH10B cells harboring pTrc200 vector or each of its derivatives expressing Tde1 variants with IPTG induction. (C) Growth inhibition assay of E. coli DH10B cells co‐expressing the Tde1 variants expressed from pTrc200 plasmid and Tdi1 immunity gene expressed from pRL662 plasmid. Growth curve was determined at OD600. Graphs of panels B and C show mean ± SD of three biological replicates (n = 3), each averaged with 3 technical repeats. One‐way ANOVA was used for the analysis of statistical significance followed by the Tukey's multiple comparison. Different letters indicate statistically different groups of strains (P value, 4.6 × 10⁻⁵ and 5.19 × 10⁻⁸ for panels B and C, respectively).
- D
Multiple sequence alignment of N‐Tde1 homologs were presented with highly conserved amino acid residues highlighted in yellow. The bacterial species, strain name, and locus number of Tde1 orthologs (Agrobacterium/Rhizobium) or tape measure proteins (Paraburkholderia/Burkholderia) are indicated on the left and right of aligned sequences. Two conserved glycine residues (G39, G43) subjected to mutagenesis were indicated by the arrows above the sequences.

Western blot for the detection of the expression of HA‐tagged Tde1 variants expressed in E. coli. *Other HA‐tagged truncated bands, related to Fig 1B.
Western blot for the detection of Tdi1 from E. coli cells co‐expressing HA‐tagged Tde1 variants and strep‐tagged Tdi1, related to Fig 1C. The loading control is a nonspecific band from the western blot of anti‐strep.
- A
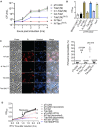
Growth inhibition assay of E. coli DH10B cells harboring pTrc200 vector or each of its derivatives expressing Tde1 variants with IPTG‐inducible expression. The growth of E. coli was monitored by CFU counting every 1 h.
- B, C
For membrane permeabilization assays, BW25113 WT alone or ∆lacY(pYTA‐lacZ) cells harboring pTrc200 vector or each of its derivatives expressing Tde1 variants were carried out for (B) β‐galactosidase activity assay to determine ONPG uptake, (C) propidium iodide permeability with cells treated with propidium iodide and Hoechst for detection by fluorescence microscope (Scale bar = 5 μm). For the quantification of cells with PI signals, a total of 6 randomly selected images obtained from two biological repeats were used to quantify the number of PI‐stained cells/number of Hoechst‐stained cells as indicated.
- D
Bacteriostatic activity assay. E. coli DH10B cells harboring pTrc200 vector or each of its derivatives expressing Tde1 variants were cultured with or without IPTG induction for 1 h. The IPTG‐induced cells were further centrifuged and resuspended in the fresh medium with or without IPTG. Cell density was measured again before continuous growth for additional 1 h.
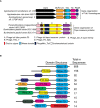
Genetic organizations of genes encoding representative Tde1 orthologues and Tape Measure Proteins (TMPs) with sequence similarity to the N‐terminus of Tde1. The proteins encoded from the upstream and downstream of tde1 and tmp genes are shown with their identified domain organizations.
Domain architecture of the Ntox15‐containing proteins. Top 10 classes of the Ntox15‐containing proteins are shown with the identifiable domains (not to scale). The number of proteins in each class was indicated on the right based on the information on June 29, 2022. The Agrobacterium tumefaciens Tde1 belonged to the first class where the N‐terminal region lacks an identifiable domain.

Growth inhibition assay of E. coli DH10B cells harboring pTrc200 vector or each of its derivatives expressing Tde1 variants with IPTG‐inducible expression, monitored by OD600, related to Fig 2A. Graphs show mean ± SD of three biological replicates (n = 3), each averaged with 3 technical repeats.
Growth curve and western blot analyses of A. tumefaciens C58 ∆tde1 carrying pTrc200 or its derivatives expressing HA‐tagged Tde1 variants. The growth curve was detected every 2 h in 523 media supplemented with 1 mM IPTG. Graphs show mean ± SD of three biological replicates (n = 3), each averaged with 3 technical repeats. One‐way ANOVA was used for the analysis of statistical significance followed by the Tukey's multiple comparison. Different letters indicate statistically different groups of strains (P value = 6.47 × 10⁻¹¹). The proteins collected at the end point (6 h) were analyzed for western blotting with antibodies against HA. Representative results of three biological repeats were shown. Protein markers are indicated in kDa.
Viability assay for E. coli cells derived from the ONPG uptake assay after 1 h IPTG induction, related to Fig 2B.
The growth curve analysis of E. coli cells used for in vivo plasmid DNA degradation assay. The turbidity of E. coli BW25113 expressing Tde1 and its variants carried out for the in vivo plasmid DNA degradation assay was measured. The E. coli cells were supplemented with 0.5% glucose (glu) or 0.2% L‐arabinose (ara) for the repression or induction of Tde1 and its variants. The OD600 values were measured by DEN‐600 photometer (Biosan, Latvia) every hr.
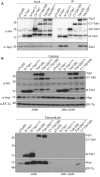
Co‐immunoprecipitation (Co‐IP) in Agrobacterium tumefaciens. A. tumefaciens C58 ∆tde1 harboring pTrc200 vector or its derivatives expressing HA‐tagged Tde1 variants. Anti‐HA resin was used to co‐precipitate the Tde1 variants and Tap1.
Secretion assay for HA‐tagged Tde1 variants. Western blot for the cellular and extracellular fractions of A. tumefaciens C58 ∆tdei and ∆tdei∆tssK expressing the HA‐tagged Tde1 variants. Hcp secretion was detected as a positive control for active T6SS secretion. Representative western blot results of three biological repeats were shown with antibody against HA, Hcp, or EF‐Tu where EF‐Tu serves as a loading and nonsecreted protein control. Protein markers are indicated in kDa.
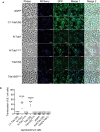
Fluorescence microscopy for Tde1 translocation. A. tumefaciens C58 ∆tdei expressing Tde1 variants fused with sfGFP (in green) and E. coli DH10B carrying mCherry (false colored in blue) were co‐cultured for 20 h. A cyan fluorescence with merged blue and green signals represented the translocation of Tde1 variants from A. tumefaciens to E. coli (Scale bar = 5 μm).
The number of cells with overlayed GFP and mCherry fluorescence was quantified from a total of 6 randomly selected images obtained from three biological repeats (number of cells with cyan fluorescence/total E. coli cells counted).

Secretion assay for Tde1 variants fused with sfGFP. Western blot for the cellular and extracellular fractions of Agrobacterium tumefaciens C58 ∆tdei and ∆tdei∆tssK expressing the Tde1 variants fused with sfGFP were detected by anti‐GFP antibody. Representative western blot results of three biological repeats were shown with antibody against GFP, Hcp, or EF‐Tu where EF‐Tu served as a loading and nonsecreted protein control. Hcp secretion served as a positive control for active T6SS secretion. Protein markers are indicated in kDa.
A. tumefaciens C58 ∆tdei∆tssK expressing N‐Tde1‐sfGFP or Tde1(M)‐sfGFP (in green) and E. coli DH10B carrying mCherry (false colored in blue) were co‐cultured for 20 h. No cyan fluorescence with merged blue and green signals could be detected when attacker cells are T6SS‐inactive, which served as negative controls for the translocation assay (Scale bar = 5 μm).
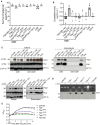
Interbacterial competition of Agrobacterium tumefaciens C58 ∆tdei and ∆tdei∆tssK expressing the Tde1 variants against E. coli cells was carried out on LB medium and E. coli survival rate was quantified by CFU counting.
Interbacterial competition between various A. tumefaciens C58 strains and A. tumefaciens 1D1609 on AK medium and the competition outcome was shown by competitive index.
Secretion assay for Tde1 and its variants co‐expressed with its immunity protein Tdi1 in A. tumefaciens C58 ∆tdei and ∆tdei∆tssK.
In vivo plasmid DNA degradation assay. E. coli BW25113 carrying pJN105 empty vector or the derivatives expressing different variants of Tde1 was supplemented with 0.5% glucose (“−”) or 0.2% L‐arabinose (“+”) for 3 h to either repress or induce Tde1 production. The plasmids were then extracted to observe the DNA degradation, and the bottom panel showed western blots of specific Tde1 protein bands.
Growth inhibition assay of Tde1 and its variants. E. coli BW25113 cells were induced by adding 0.2% L‐arabinose for Tde1 production. The OD600 values were measured every 15 min. The OD600 values of the 4 h post‐L‐arabinose induction were analyzed for statistical analysis. Graphs show mean ± SD of three biological repeats.
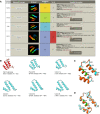
Predicted results of N‐terminal Tde1 (1–97) as a query reveal structural similarity to pyocin S5 and colicin Ia with high confidence.
N‐terminal Tde1 with structural similarity to pore‐forming domain of the pyocin S5, colicines, and other membrane perturbing proteins based on Phyre2 prediction.
Cartoon model of the Tde1 (residue 10–62) by using on the basis of the crystal structure of Pyocin S5 (PDB 6THK) with 77.3% of confidence level. All glycine residues of the predicted glycine zipper motif of Tde1 were indicated.
Superimposition of N‐Tde1 and pore‐forming domain of pyocin S5. Tde1 N‐terminus is in red, and the partially pore‐forming domain of pyocin S5 is in teal; G39 and G43 in the putative glycine zipper motif are highlighted in green.
References
-
- Ali J, Lai EM (2022) Distinct TssA proteins converge in coordinating tail biogenesis of the type VI secretion systems. Bioessays 45: e2200219 - PubMed
Publication types
MeSH terms
Substances
LinkOut - more resources
Full Text Sources
Research Materials

