. 2023 May 23;147(21):1606-1621.
doi: 10.1161/CIRCULATIONAHA.122.061940. Epub 2023 Apr 17.

SOX17 Enhancer Variants Disrupt Transcription Factor Binding And Enhancer Inactivity Drives Pulmonary Hypertension

Affiliations

SOX17 Enhancer Variants Disrupt Transcription Factor Binding And Enhancer Inactivity Drives Pulmonary Hypertension

Rachel Walters et al. Circulation. .

Abstract

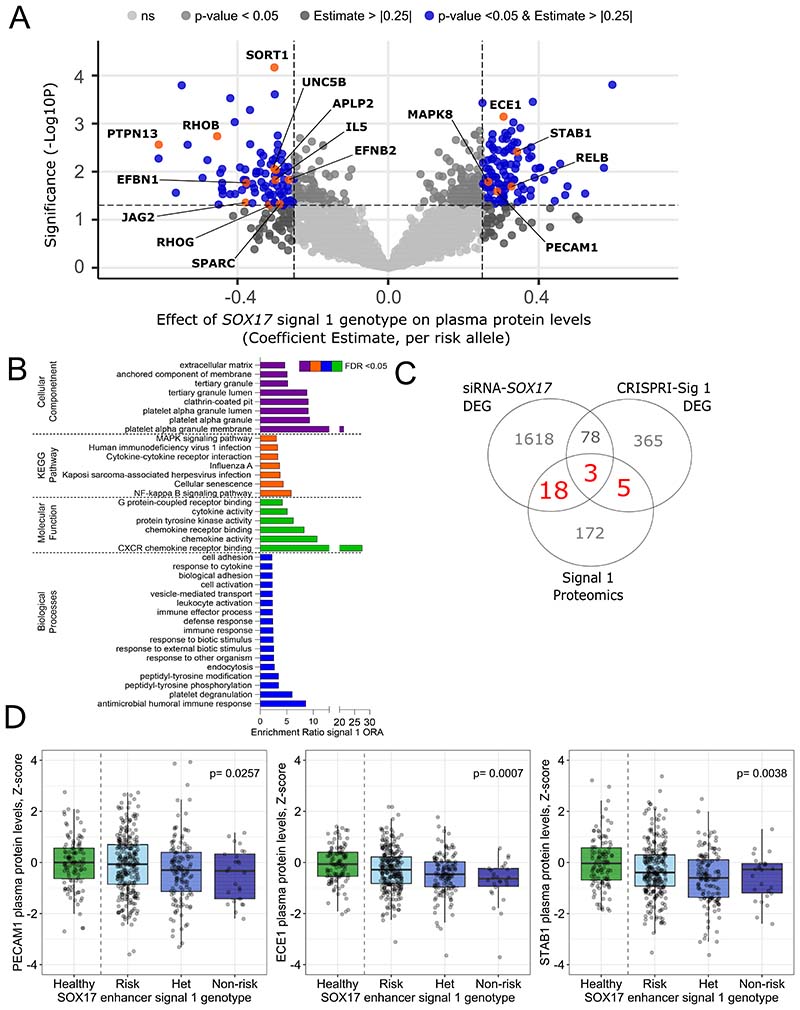
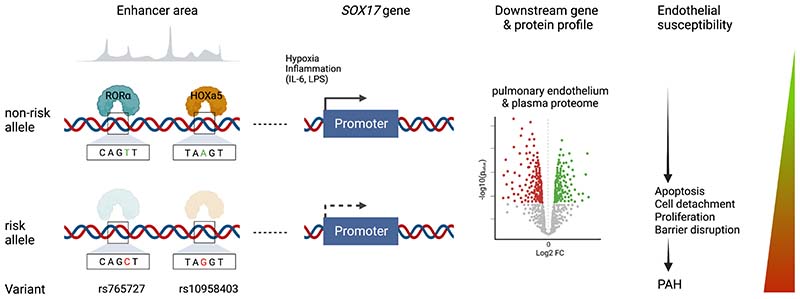
Background: Pulmonary arterial hypertension (PAH) is a rare disease characterized by remodeling of the pulmonary arteries, increased vascular resistance, and right-sided heart failure. Genome-wide association studies of idiopathic/heritable PAH established novel genetic risk variants, including conserved enhancers upstream of transcription factor (TF) SOX17 containing 2 independent signals. SOX17 is an important TF in embryonic development and in the homeostasis of pulmonary artery endothelial cells (hPAEC) in the adult. Rare pathogenic mutations in SOX17 cause heritable PAH. We hypothesized that PAH risk alleles in an enhancer region impair TF-binding upstream of SOX17, which in turn reduces SOX17 expression and contributes to disturbed endothelial cell function and PAH development.

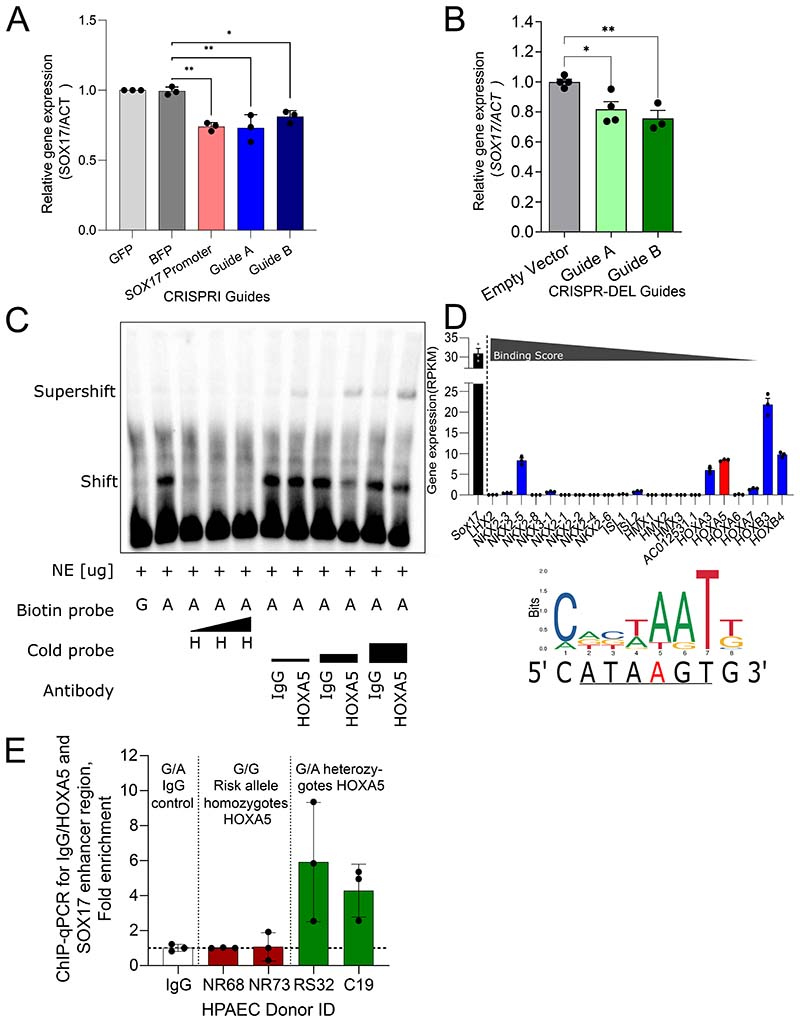
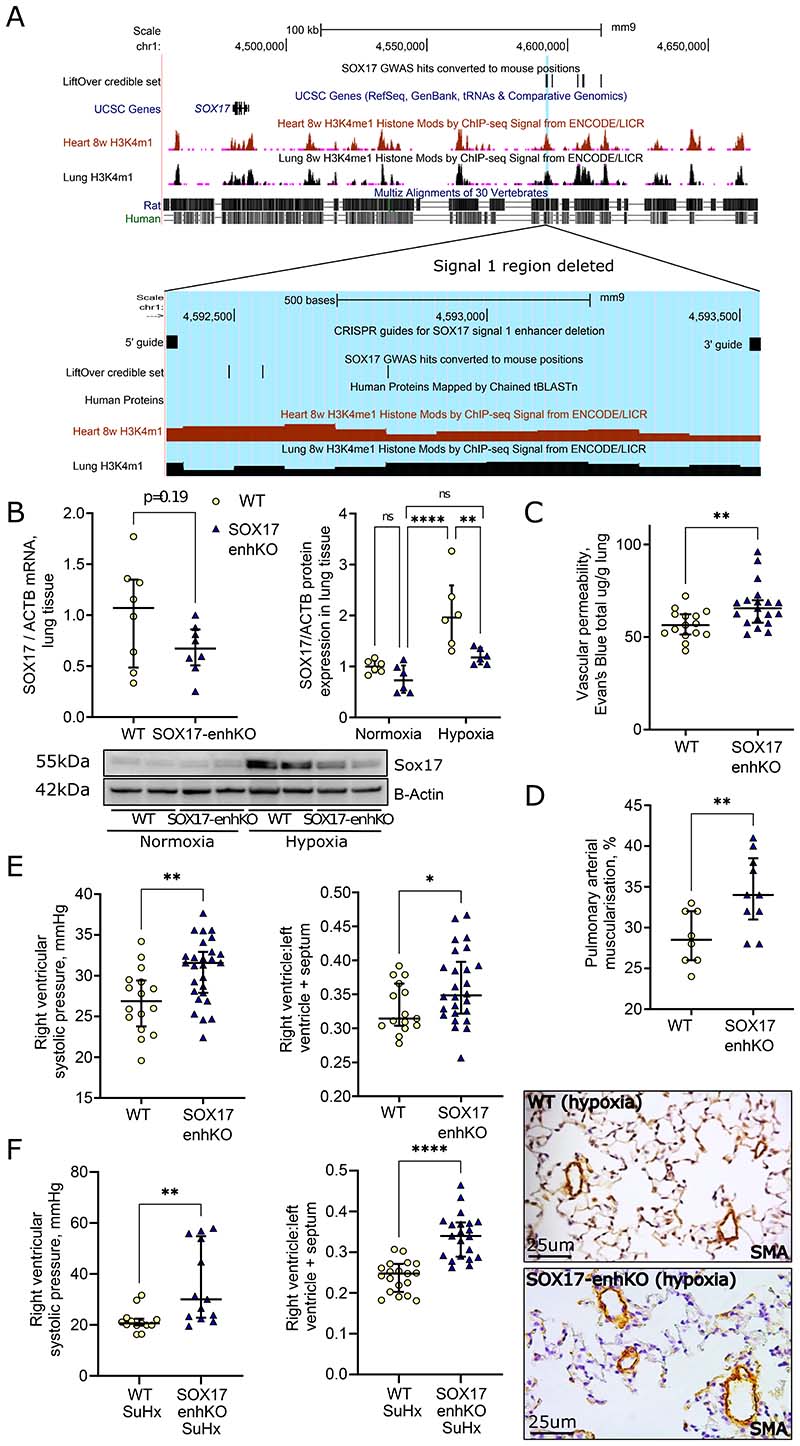
Methods: CRISPR manipulation and siRNA were used to modulate SOX17 expression. Electromobility shift assays were used to confirm in silico-predicted TF differential binding to the SOX17 variants. Functional assays in hPAECs were used to establish the biological consequences of SOX17 loss. In silico analysis with the connectivity map was used to predict compounds that rescue disturbed SOX17 signaling. Mice with deletion of the SOX17-signal 1 enhancer region (SOX17-4593/enhKO) were phenotyped in response to chronic hypoxia and SU5416/hypoxia.

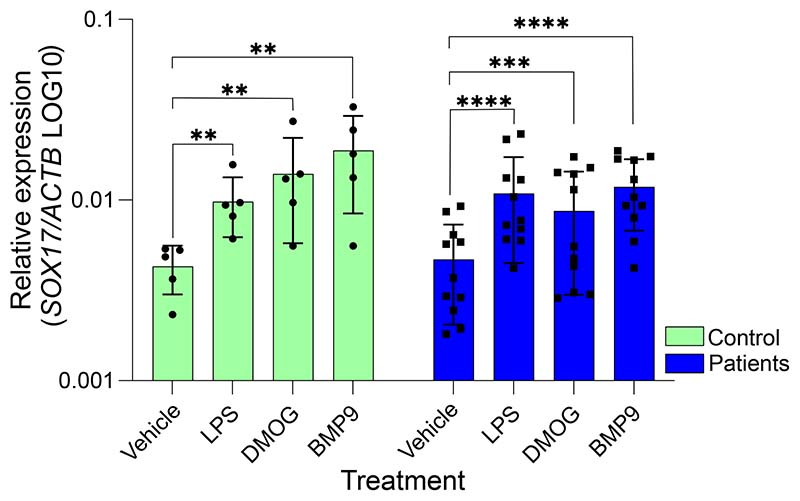
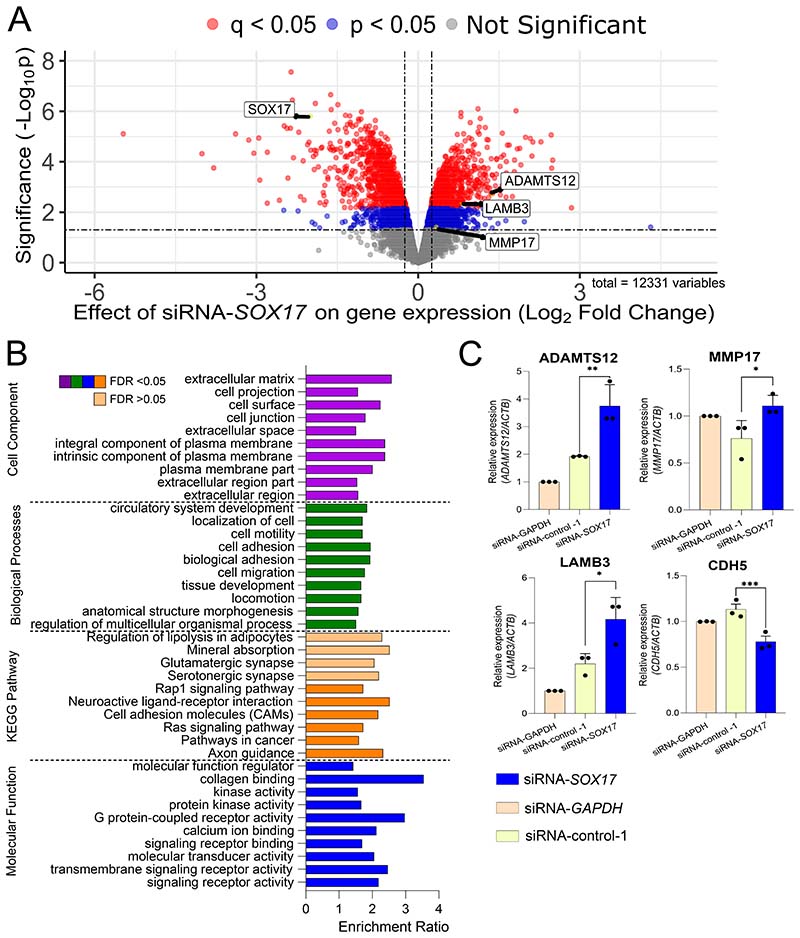
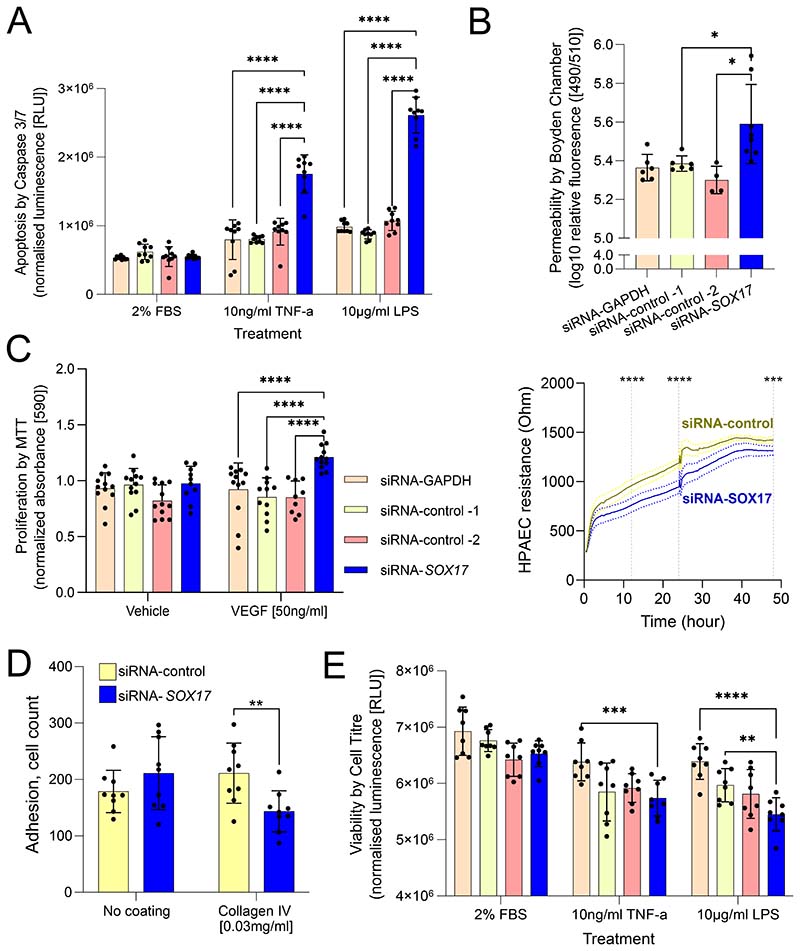
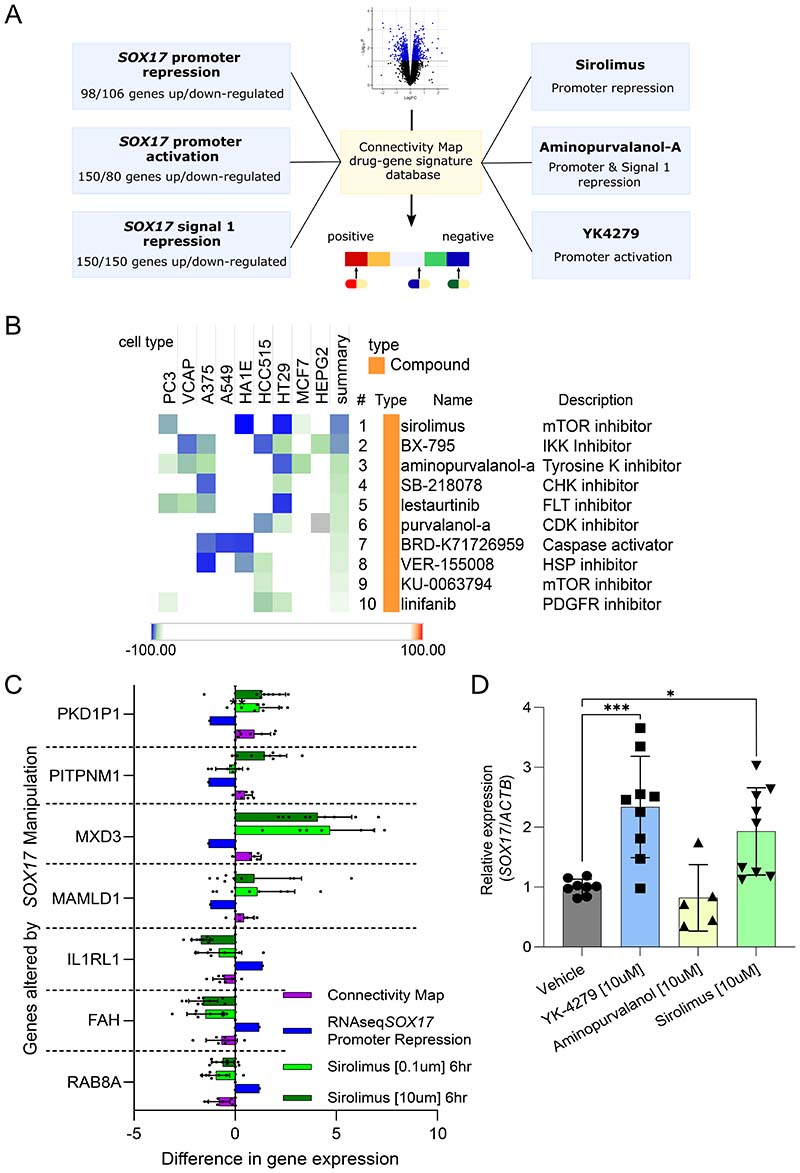
Results: CRISPR inhibition of SOX17-signal 2 and deletion of SOX17-signal 1 specifically decreased SOX17 expression. Electromobility shift assays demonstrated differential binding of hPAEC nuclear proteins to the risk and nonrisk alleles from both SOX17 signals. Candidate TFs HOXA5 and ROR-α were identified through in silico analysis and antibody electromobility shift assays. Analysis of the hPAEC transcriptomes revealed alteration of PAH-relevant pathways on SOX17 silencing, including extracellular matrix regulation. SOX17 silencing in hPAECs resulted in increased apoptosis, proliferation, and disturbance of barrier function. With the use of the connectivity map, compounds were identified that reversed the SOX17-dysfunction transcriptomic signatures in hPAECs. SOX17 enhancer knockout in mice reduced lung SOX17 expression, resulting in more severe pulmonary vascular leak and hypoxia or SU5416/hypoxia-induced pulmonary hypertension.

Conclusions: Common PAH risk variants upstream of the SOX17 promoter reduce endothelial SOX17 expression, at least in part, through differential binding of HOXA5 and ROR-α. Reduced SOX17 expression results in disturbed hPAEC function and PAH. Existing drug compounds can reverse the disturbed SOX17 pulmonary endothelial transcriptomic signature.

Keywords: SOX17 protein; human; hypertension; pulmonary.


Conflict of interest statement

Disclosures None.

Figures

Figure 1)
Figure 1). Defining Upstream Regulators of SOX17 & Effects of Common Variation at the SOX17 Locus in PAH.
A) Knockdown of SOX17 through CRISPR-Inhibition of SOX17-signal 2. Relative gene expression of SOX17 compared to ACTβ in hPAEC. Ordinary 1-way ANOVA of conditions compared to BFP condition with Dunnett’s multiple comparisons test. n=3 experiments performed in triplicate. B) Knockdown of SOX17 through CRISPR-deletion of SOX17-signal 1 region. Relative gene expression of SOX17 compared to ACTβ in hPAEC. CRISPR-deletion guides A/B target SOX17-signal 1. Ordinary 1-way ANOVA of conditions compared to BFP condition with Dunnett’s multiple comparisons test. n=3. C) EMSA assay showing binding of hPAEC nuclear proteins to 21bp DNA probes containing the sequence at the rs1098403 region. Shift and supershift are highlighted. H indicates cold probes containing a putative HOXa5 binding site. Biotin-probe, biotin-labelled probe (G/A, alleles of SOX17 enhancer variant included in probe sequence). Cold-Probe, unlabelled probe. H, HOXa5 competitive probe. IgG, Mouse IgG. The black triangles show increasing molecular excess from left to right. D) RNAseq expression in hPAECs (RPKM) of potential TFs of interest for rs1098403. HOXa5 is shown in red. SOX17 is shown in black for reference. All other transcription factors are shown in blue and were found through CIS-BP. The binding score (taken from CIS-BP) refers to the predicted likelihood of the transcription factor binding to the given sequence and decreases from left to right. The underlined sequence refers to the potential binding location of HOXa5 and the A in red font is the site of rs1098403. The consensus binding sequence of HOXA5 was taken from JASPAR (jaspar.genereg.net) and is shown with the sequence of the region surrounding rs1098403 and rs765727 were taken from https://genome.ucsc.edu/. *-p<0.05, **-p<0.01. n=3. E) ChIP-qPCR for HOXA5 at rs10958493. Results of a quantitative PCR (triplet measurements per donor, n=3) performed on precipitated fraction of chromatin immunoprecipitation (ChIP) with IgG or HOXa5 antibody in 4 HPAEC donors. The ChIP with IgG control was performed in HPAEC donor C19.
Figure 2)
Figure 2). Defining the effect of upstream regulators and PAH-relevant stimuli on SOX17.
Relative gene expression of SOX17 compared to ACTβ in control and patient ECFC following exposure to known PAH stimuli. Individual data points represent individuals, n=5 controls, n=11 patients. Vehicle/treatments in 2% FBS EC media. LPS, lipopolysaccharide (2µg/ml). DMOG, Dimethyloxalylglycine (100µM), BMP9, bone morphogenetic protein-9 (10ng/ml). Ordinary 1-way ANOVA within groups compared to baseline condition with Dunnett’s multiple comparisons test. **-p<0.01, ***-p<0.005, ****-p<0.001.
Figure 3)
Figure 3). Analysis of Sox17 Manipulation in Pulmonary Vascular Cells.
A) Differentially Expressed Genes following SOX17-siRNA in hPAECs. Volcano plot of the Log2 fold change (FC) between siRNA-SOX17 and siRNA-negative control and the negative log10 p-value. Differentially expressed genes shown in blue met the cut-off points: p<0.05 and Log2 fold change <-0.25 or >0.25. Genes shown in red also met the cut-off of q<0.05. Genes of interest are highlighted in black boxes. n=4, 12196 variables. B) Over-representation Analysis for enriched pathways and functions following SOX17-siRNA. Gene ontology analysis of Cell component (purple), biological process (green), KEGG pathway (orange) and molecular function (blue) enrichment following SOX17-siRNA in hPAECs. Darker colours indicate f<0.05. Lighter colours indicate f>0.05. Enrichment ratios were obtained from WebGestalt. C) Relative gene expression of gene ontology target genes by qPCR. The change in target gene expression is normalised to ACTβ and all siRNA conditions are relative to the GAPDH-targeting siRNA control. Target genes are ADAMTS12, MMP17, LAMB3, CDH5. All statistical tests shown are paired, one-way, student’s t-test. *-p<0.05. n=3. All in hPAECs following SOX17-siRNA treatment for 48 hours.
Figure 4)
Figure 4). Effect of SOX17 enhancer variant genotype on patient proteomics.
A) Linear regression for the effect of SOX17-signal 1 on the levels of serum proteins in patient sample. Volcano plot of the coefficient estimate and the negative log10 p-value. Corrected for age and sex. Protein shown in blue met threshold b-estimate > |0.25| and p < 0.05. Proteins of interest are labelled and shown in orange n=431. B) GO analysis for the significantly affected by signal 1 genotype proteins. Gene ontology analysis of Cell component (purple), biological process (green), KEGG pathway (orange) and molecular function (blue) enrichment. Proteins met the threshold b-estimate > |0.25| and p < 0.05. Enrichment ratios were obtained from WebGestalt. C) Comparisons of transcriptomic and proteomic analysis. Venn diagram showing overlapping differentially expressed genes and proteins from transcriptomic and proteomic analysis from CRISPRi of SOX17-signal 1, siRNA-SOX17 and SOX17-signal 1 enhancer variant genotype on patient proteomics. DEG, differentially expressed genes. Numbers in red show genes and proteins which are in common between all analyses. D) Z-scored proteins in healthy controls versus patients with different genotypes in proteins of interest. Proteins included are PECAM1, ECE1 and STAB1. Risk, homozygous for risk allele, n=271. Non-risk, homozygous for non-risk allele, n=26. Het, heterozygotes, n=134. Control, n=108.
Figure 5)
Figure 5). Functional Analysis of Sox17 loss in hPAEC.
All following siRNA treatment for 48hrs with scrambled controls, targeting SOX17 or unrelated gene GAPDH, with relevant stimuli as indicated. A) Caspase 3/7 apoptosis assay. 2% FBS was used as a proliferation control. TNFα and LPS were used as pro-apoptotic inflammatory stimuli. B) Permeability barrier function assays. Upper, Boyden chamber FITC dextran. Lower, Electrical cell Substrate Impedance Sensing (ECIS) measurements at 0-48h. C) MTT proliferation assay. Vehicle, 0.1% BSA in PBS. Vascular endothelial growth factor (VEGF) was used as a pro-proliferative stimulus. D) Adhesion cell counting assay. Adhesion was compared between cells in wells with no coating or pre-coated with collagen IV. E) Cell Titre viability assay. Performed under same conditions as caspase assay. TNFα, tumour necrosis factor-α; LPS, lipopolysaccharide. Statistical tests used in A, C and D are ordinary two-way ANOVA with Dunnett’s multiple comparisons test. The statistical test used in B is an ordinary one-way ANOVA with Dunnett’s multiple comparison test. *-p<0.05. **-p<0.01. ***-p<0.005. ****-p<0.001. Minimum n=3 experiments for all, culture replicates plotted.
Figure 6)
Figure 6). Repurposing of Compounds to Rescue loss of SOX17 Function in PAH.
A) Summary diagram showing the prediction of compounds from omics signatures using connectivity map (CMap) database signatures of drug or gene manipulation in reference cell lines. Omics signatures used to query the Cmap database are shown on the left. Predicted compounds are shown on the right. B) Cmap analysis results for SOX17 promoter repression using CRISPR-inhibition in human pulmonary artery endothelial cells (hPAEC). Cell types are shown. Tau scores within heatmap indicate percentage of all possible compounds in CMAP and cell lines tested the specific result is more connected than. Sirolimus overall is negatively connected more strongly than other compounds, with a summary Tau of -96.94. C) Relative gene expression of target genes in the sirolimus perturbagen signature. Target genes were PKD1P1, PITPNM1, MXD3, MAMLD1, IL1RL1, FAH and RAB8A. Connectivity map, perturbagen z-score taken from the Cmap. RNAseq SOX17 promoter repression via CRISPRI (n=3), fold change from RNAseq analysis of DEG following CRISPRI of the SOX17 promoter (n=3). Sirolimus [0.1μm/10μm] (n=3), the change in target gene expression is normalised to ACTβ and all siRNA conditions are relative to the GAPDH-targeting siRNA control in hPAECs following sirolimus exposure at the stated concentrations. D) Relative expression of SOX17 following CMap compound exposure by qPCR in hPAEC. The change in SOX17 expression is normalised to ACTβ and all compounds are relative to the vehicle control. Ordinary 1-way ANOVA of conditions compared to vehicle with Dunnett’s multiple comparisons test. *-p<0.05, ***-p<0.005. n=3.
Figure 7)
Figure 7). SOX17-signal 1 enhancer knockout mice develop more severe PH in hypoxia.
A) Map of PAH SOX17 enhancers in mouse genome. Black bars labelled ‘Enhancer and GWAS hits LiftOver’ and ‘User track’ indicate conserved genomic regions from the human SOX17 enhancer peaks. Lines indicate positions of variants associated with PAH in the human GWAS. Mouse epigenomic H3K4m1 data show that this area is also likely to be an active regulatory region in mice. Blue region highlights enhancer targeted for deletion. B) SOX17 mRNA and protein expression. Taken from lung tissue following 3 weeks hypoxia and compared to beta-actin (ACTB) housekeeping gene/protein. *-p<0.05, **-p<0.01 versus WT (unpaired t-tests). n=6 and n=8. C) Lung vascular permeability. Determined by Evan’s blue dye in wildtype (WT) and SOX17 enhancer knockout lung tissue following 1 week of hypoxia. *-p<0.05, **-p<0.01 versus WT (unpaired t-tests). n=15 and n=18. D) Pulmonary vascular muscularisation. Determined from smooth muscle actin (SMA) and Elastic Van Gieson (EVG) staining. *-p<0.05, **-p<0.01 versus WT (unpaired t-tests). n=7 and n=10. E) Right ventricular systolic pressure (RVSP) and RV hypertrophy (RVH) indices of PH severity in WT and SOX17 enhancer knockout mice following chronic hypoxia (10% O2 3 weeks). *-p<0.05, **-p<0.01 versus WT (unpaired t-tests). F) Right ventricular systolic pressure (RVSP) and RV hypertrophy (RVH) indices of PH severity in WT and SOX17 enhancer knockout mice following SUGEN 5 mg/kg and 12% O2 for 3 weeks (SuHx). **-p<0.01, ****-p<0.001 versus WT SuHx (unpaired t-tests).
Figure 8)
Figure 8). Summary figure.
Schematic depicting overall study findings from identification of RORα and HOXa5 as transcription factors binding PAH-associated variants in enhancers upstream of SOX17, through regulation of SOX17 by PAH stimuli, downstream effects of SOX17 on gene and protein expression profiles and endothelial cell behaviour, culminating in worsened PAH in SOX17-enhancer knockout mice.

Comment in

References

    1. Nakhleh MK, Haick H, Humbert M, Cohen-Kaminsky S. Volatolomics of breath as an emerging frontier in pulmonary arterial hypertension. The European respiratory journal. 2017;49(2):1601897. doi: 10.1183/13993003.01897-2016. - DOI - PubMed
    1. Thenappan T, Shah SJ, Rich S, Gomberg-Maitland M. A USA-based registry for pulmonary arterial hypertension: 1982-2006. The European respiratory journal. 2007;30(6):1103–1110. doi: 10.1183/09031936.00042107. - DOI - PubMed
    1. Schermuly RT, Ghofrani HA, Wilkins MR, Grimminger F. Mechanisms of disease: pulmonary arterial hypertension. Nature Reviews Cardiology. 2011;8(8):443–455. doi: 10.1038/nrcardio.2011.87. - DOI - PMC - PubMed
    1. Lan N, Massam B, Kulkarni S, Lang C. Pulmonary Arterial Hypertension: Pathophysiology and Treatment. Diseases. 2018;6(2):38. doi: 10.3390/diseases6020038. - DOI - PMC - PubMed
    1. Vaillancourt M, Ruffenach G, Meloche J, Bonnet S. Adaptation and remodelling of the pulmonary circulation in pulmonary hypertension. Canadian Journal of Cardiology. 2015:407–415. doi: 10.1016/j.cjca.2014.10.023. - DOI - PubMed

Publication types

MeSH terms