. 2023 Apr 17:12:e85202.
doi: 10.7554/eLife.85202.

Global change in brain state during spontaneous and forced walk in Drosophila is composed of combined activity patterns of different neuron classes

Affiliations

Global change in brain state during spontaneous and forced walk in Drosophila is composed of combined activity patterns of different neuron classes

Sophie Aimon et al. Elife. .

Abstract

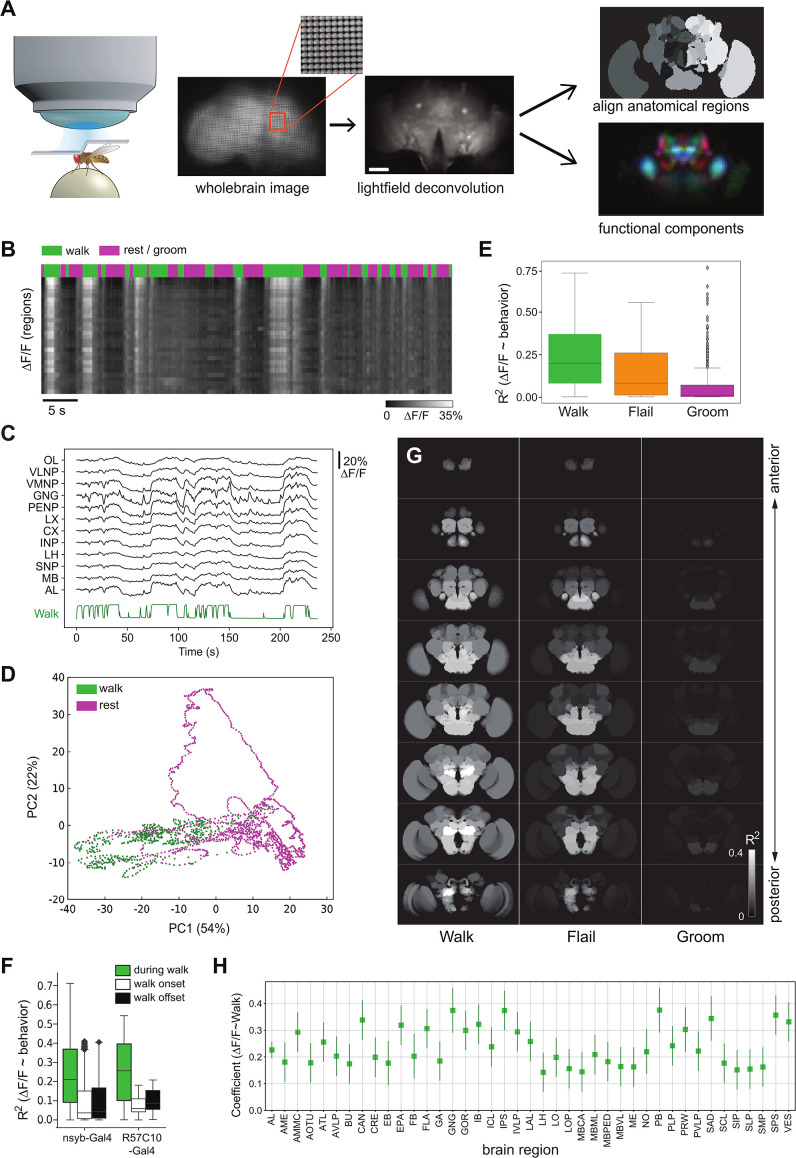
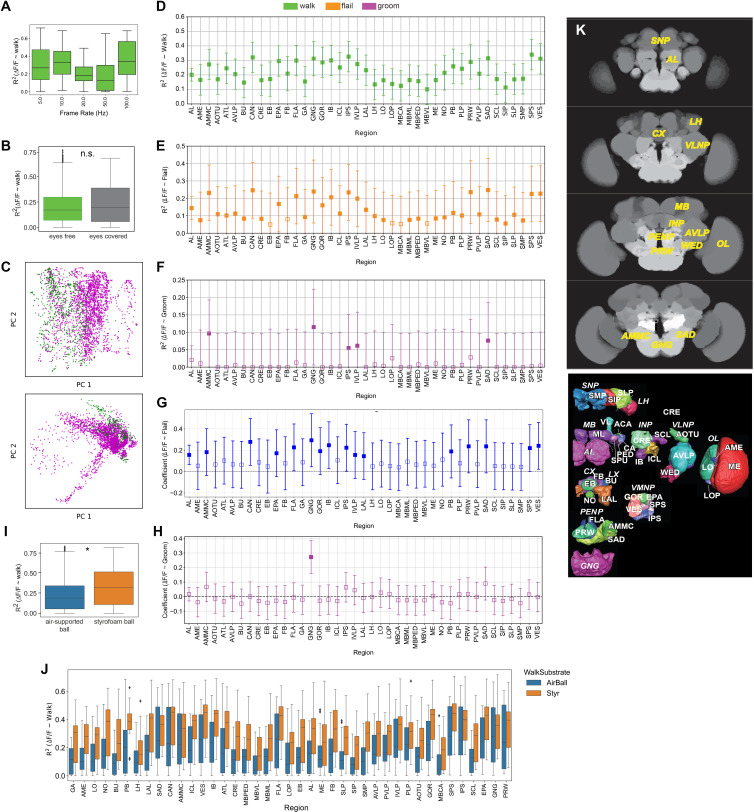
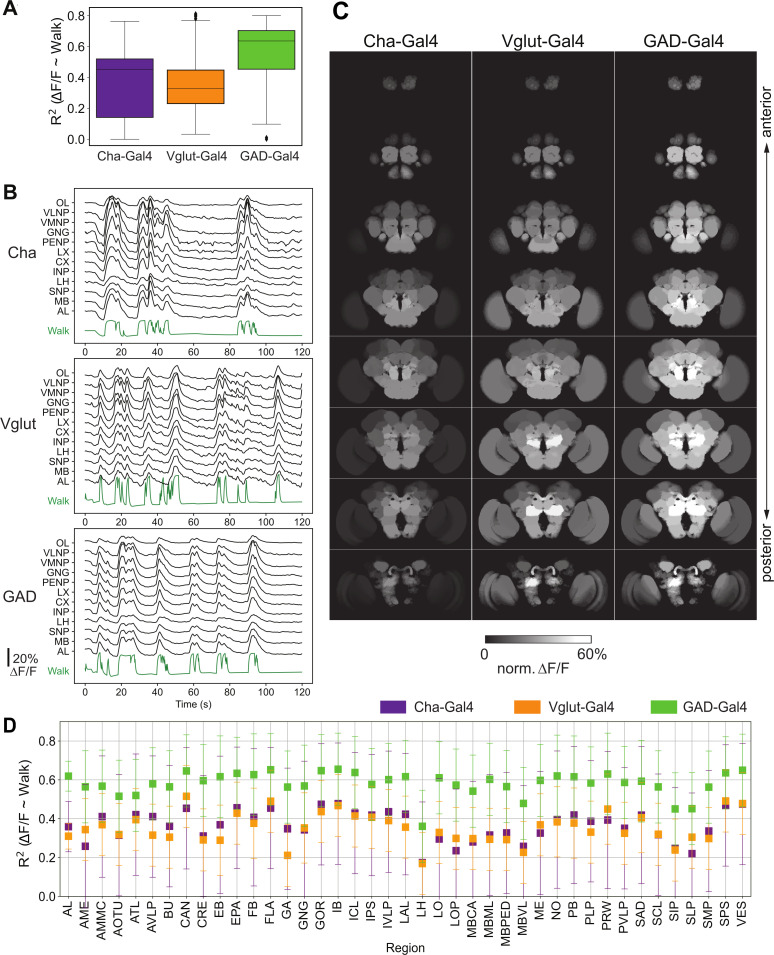
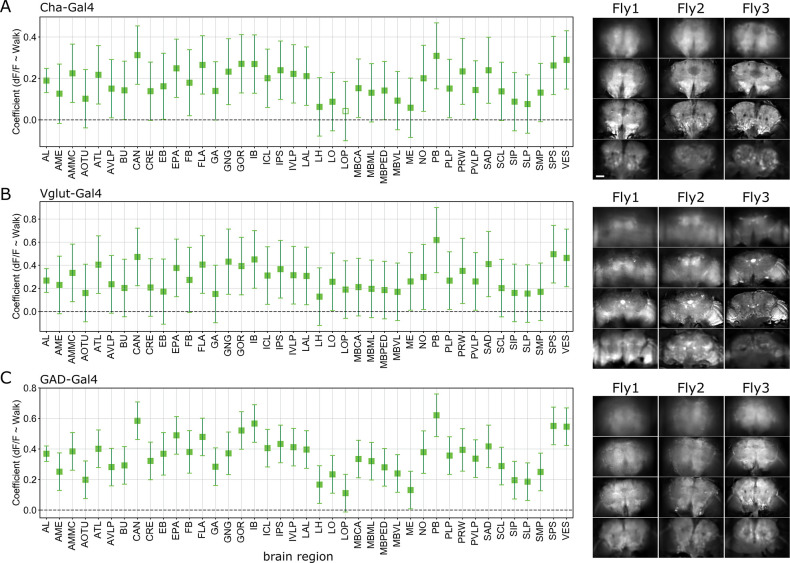
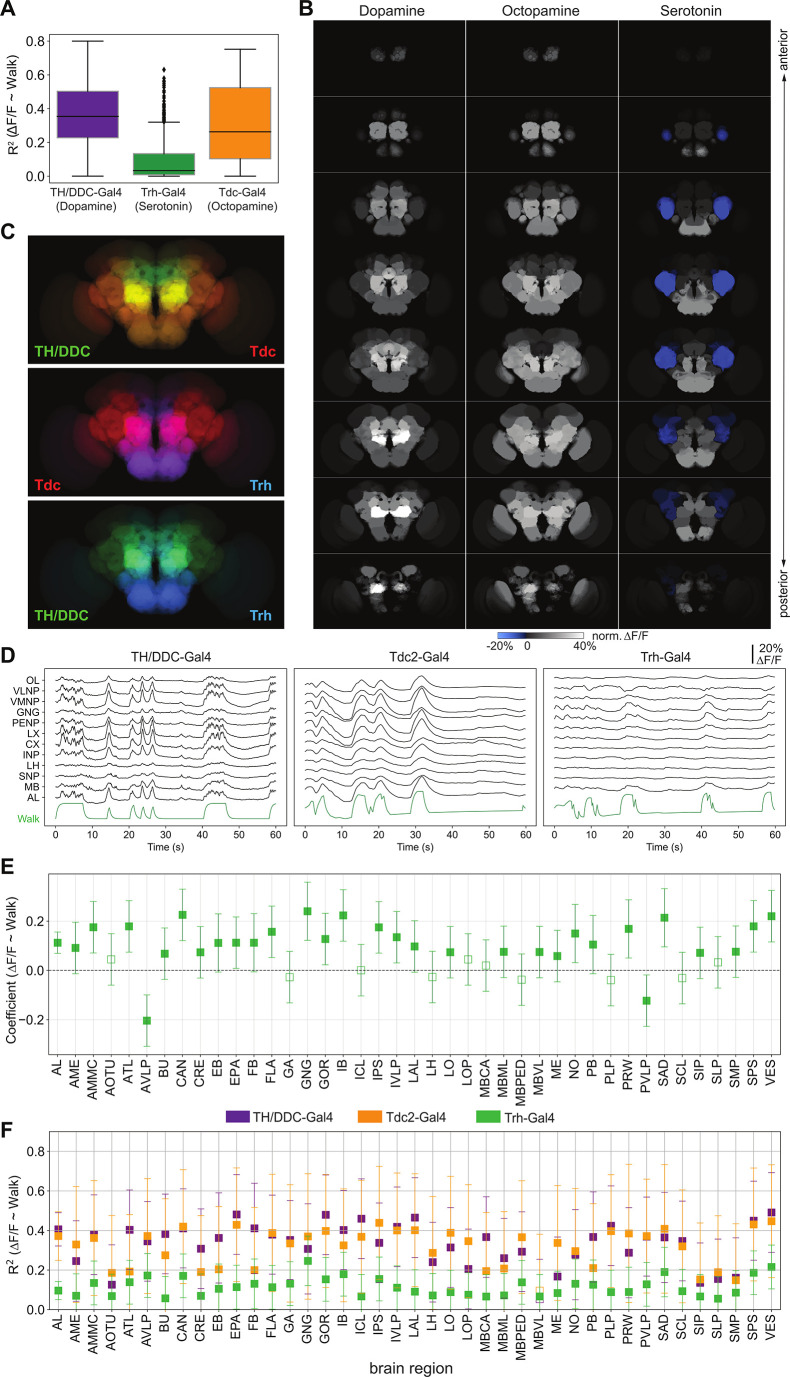
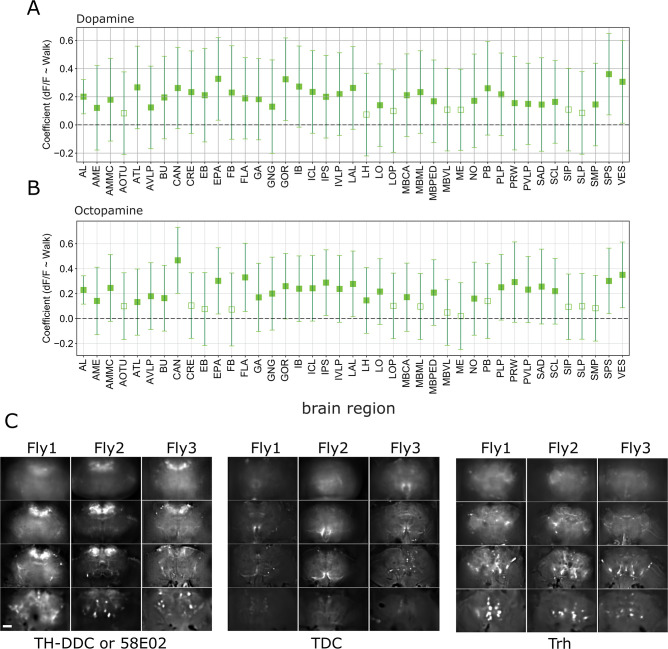
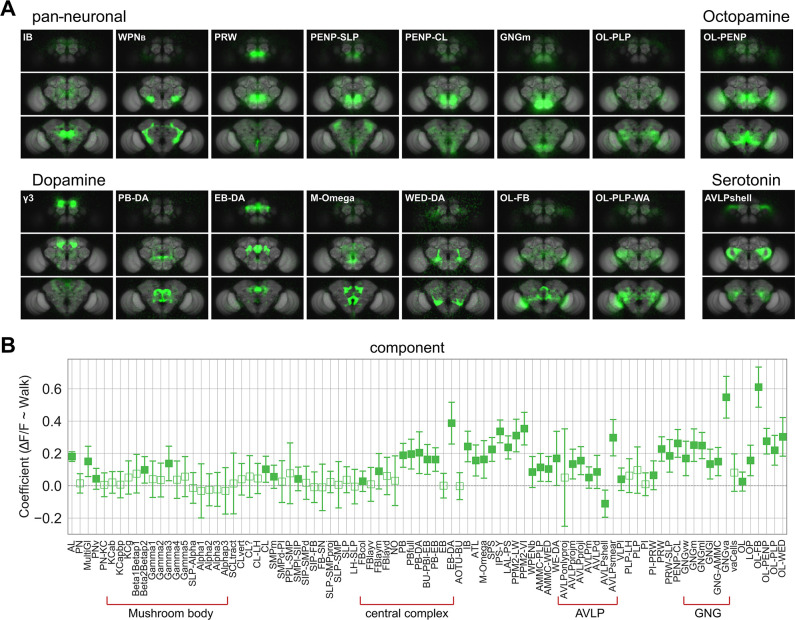
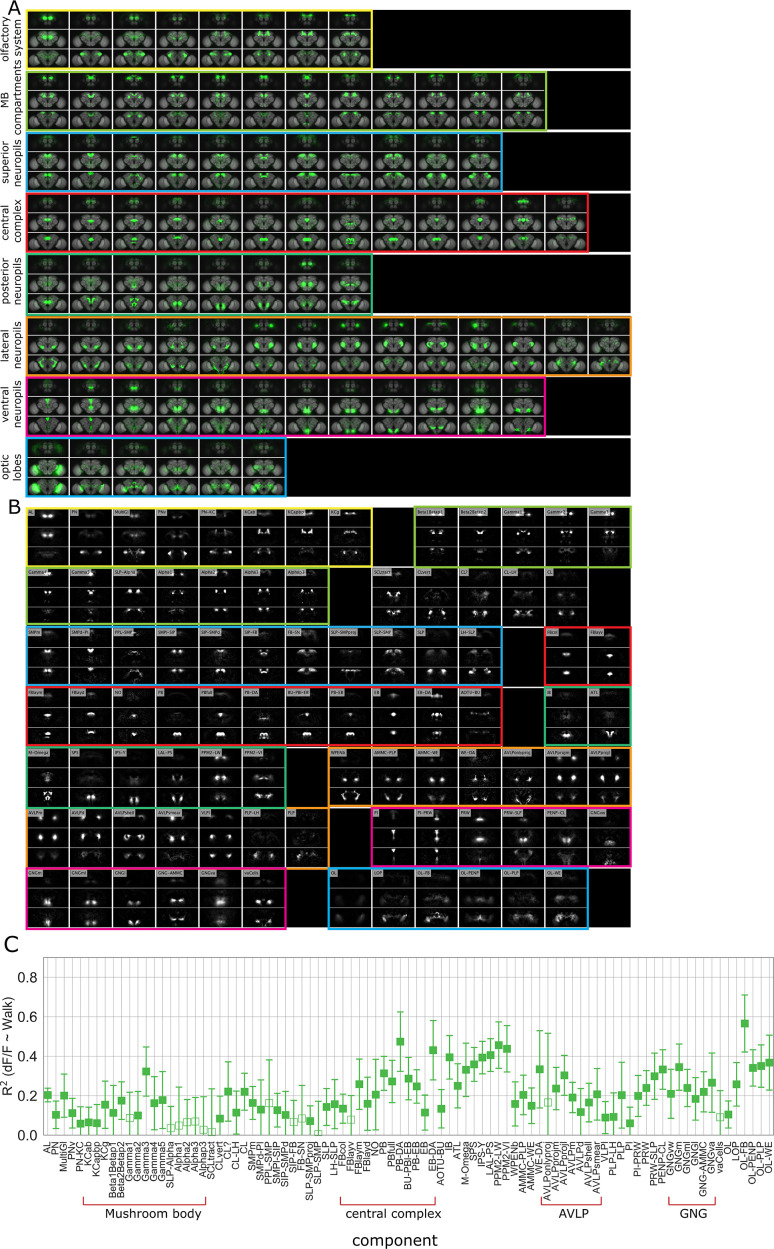
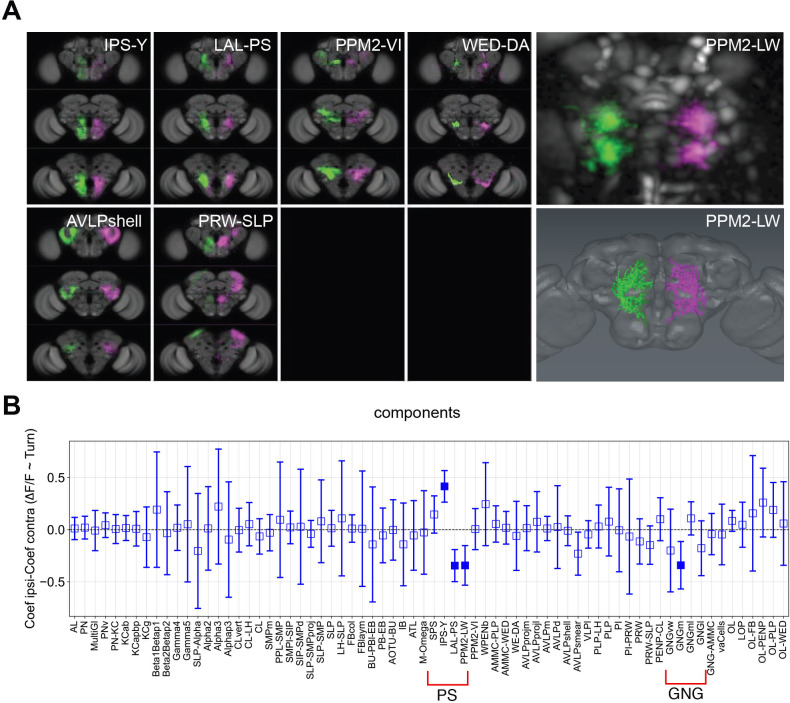
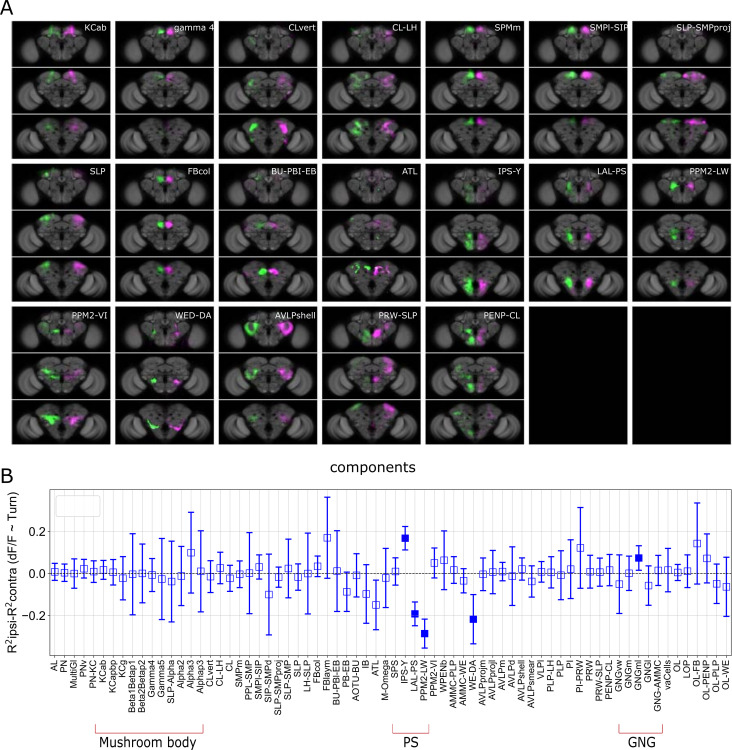
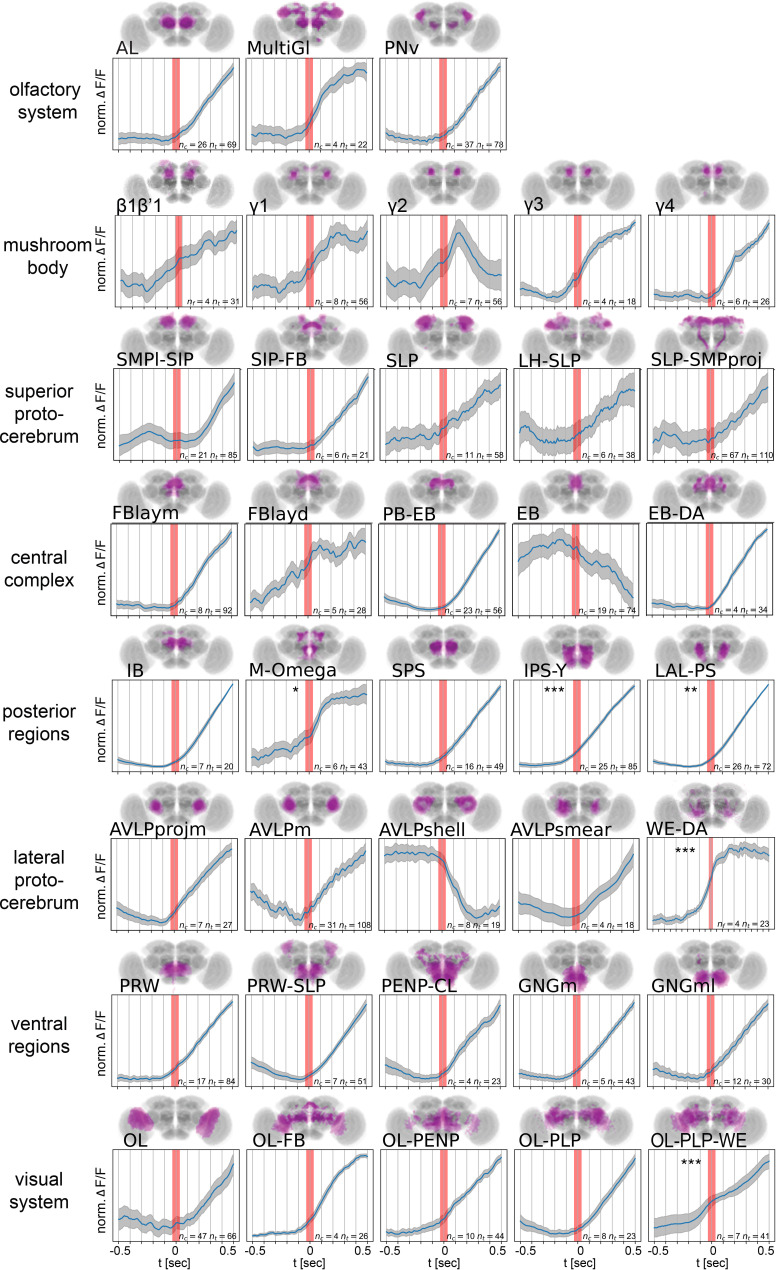
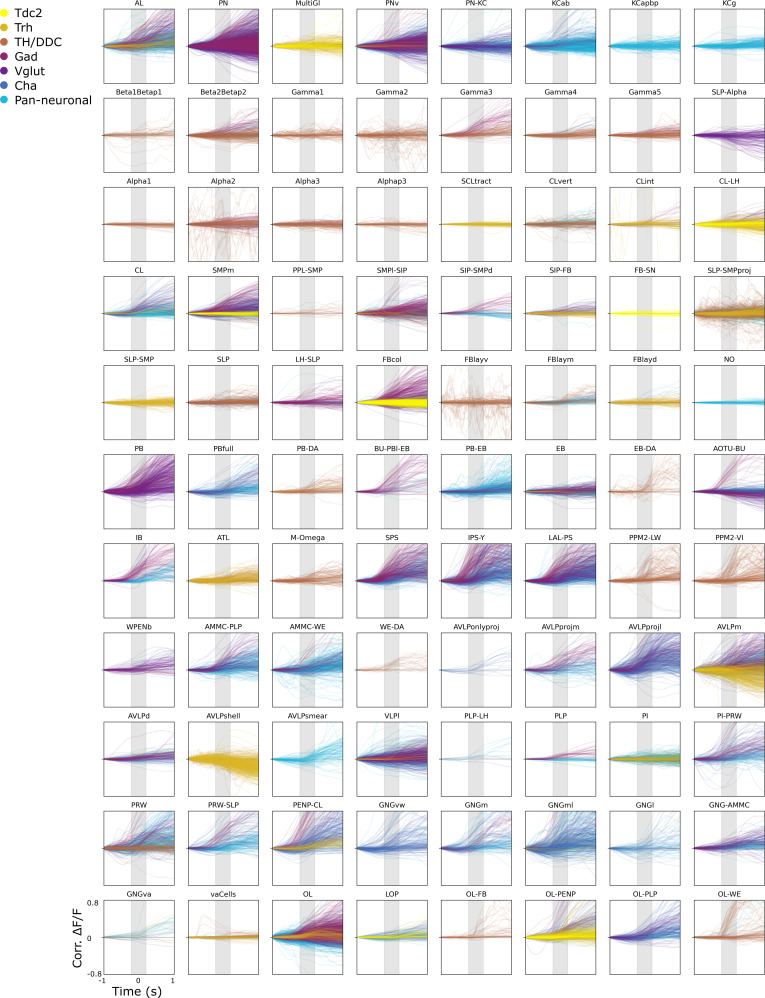
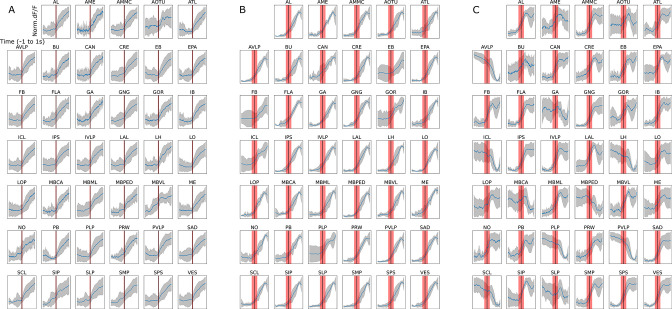
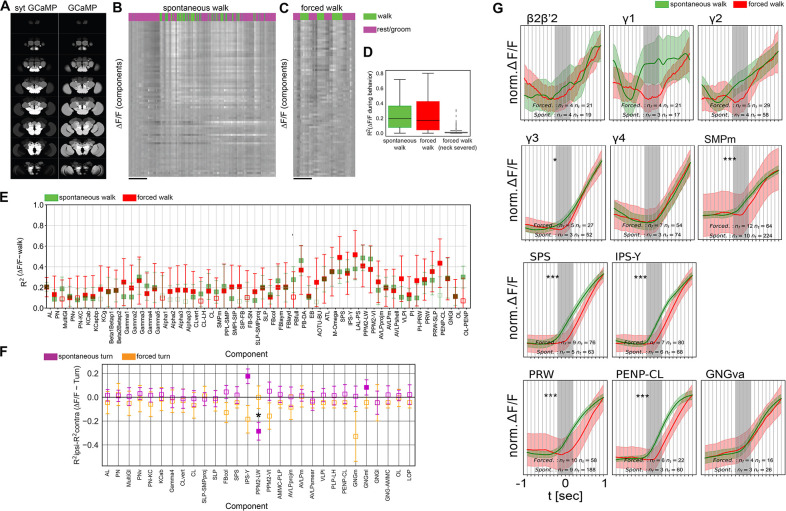
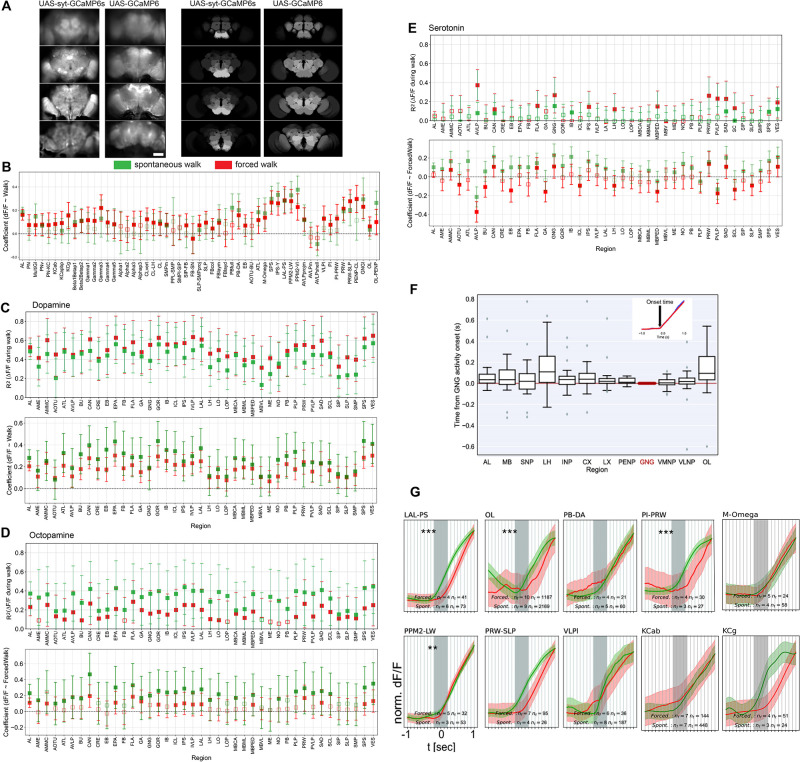
Movement-correlated brain activity has been found across species and brain regions. Here, we used fast whole brain lightfield imaging in adult Drosophila to investigate the relationship between walk and brain-wide neuronal activity. We observed a global change in activity that tightly correlated with spontaneous bouts of walk. While imaging specific sets of excitatory, inhibitory, and neuromodulatory neurons highlighted their joint contribution, spatial heterogeneity in walk- and turning-induced activity allowed parsing unique responses from subregions and sometimes individual candidate neurons. For example, previously uncharacterized serotonergic neurons were inhibited during walk. While activity onset in some areas preceded walk onset exclusively in spontaneously walking animals, spontaneous and forced walk elicited similar activity in most brain regions. These data suggest a major contribution of walk and walk-related sensory or proprioceptive information to global activity of all major neuronal classes.

Keywords: AVLP; D. melanogaster; PCA/ICA; behavior; dopamine; neuromodulators; neuroscience; serotonin; spontaneous behavior; walk; whole brain activity.


Conflict of interest statement

SA, KC, JG No competing interests declared, IG Reviewing editor, eLife

Figures

Figure 1.
Figure 1.. Global brain activation during walk.
(A) Schematic overview of the preparation and analysis method. Please see methods for details. (B) Raster plot of the activity of regions. Top panels depict walking bouts in green and rest or grooming in magenta. Lower panel shows calcium activity elicited throughout the experiment. The brighter the higher the calcium transients. Mean forward speed: 5.6 mm/s, mean angular velocity: 0.4 rad/s. Bar is 60 μm. (C) Sample traces (ΔF/F) for different brain regions relative to walk (green). (D) First two principal components from whole brain activity color coded with behavior (see additional examples in Figure 1—figure supplement 1). (E) R2 for regression of single regions with single behaviors (all regions were pooled, but p-values are obtained after averaging regions for each fly. Walk: N = 16, Flail: N = 7, Groom: N = 6). Mann–Whitney U-test Bonferroni adjusted p-values: Walk vs. Flail: 0.085, Walk vs. Groom: 0.011, Flail vs. Groom: 0.26. Center line, median; box limits, upper and lower quartiles; whiskers, ×1.5 interquartile range; points, outliers. (F) R2 of single region activity regression with walk, walk onset and walk offset (all regions were pooled, nsyb-Gal4: N = 16, GMR57C10-Gal4: N = 4). Regressors for walk onset or offset are Dirac functions convolved with the GCaMP response (see Methods). Box plots show: center line, median; box limits, upper and lower quartiles; whiskers, ×1.5 interquartile range; points, outliers. Mann–Whitney U-test for the two genotypes grouped (comparison of fly-wise averages): walk vs. walk onset: p = 3 × 10⁻⁵, walk vs. walk offset: p = 6 × 10⁻⁵. (G) Z-stack map of R2 median (Walk: N (flies) = 16, Flail: N = 7, Groom: N = 6) for regression between single region activity and walk, flail or groom (see values in Figure 1—figure supplement 1D-F). (H) Coefficient of single region’ activity regression with walk. All regions’ 95% CI ( bars) are above zero and all adjusted p-values <0.001 (Benjamini–Hochberg correction). N = 16.
Figure 1—figure supplement 1.
Figure 1—figure supplement 1.. Correlation of regional activity with walk.
(A) R2 during walk at different recording frequencies for pan-neuronally expressed GCaMP6f or GCaMP6m (all regions were pooled). No significant difference was found for walk between the different frequencies. Box plots show: center line, median; box limits, upper and lower quartiles; whiskers, ×1.5 interquartile range; points, outliers. (B) R2 for walking with eyes free (not painted, N = 5) and eyes covered (painted, N = 5, p-value: 0.34). Box plots show: center line, median; box limits, upper and lower quartiles; whiskers, ×1.5 interquartile range; points, outliers. (C) Additional examples (two different flies) of whole brain activity reduced to the two first principal component space. (D) R2 obtained with regressing activity of individual regions with walk (pan-Gal4;UAS-GCaMP). Adjusted p-values (Benjamini–Hochberg correction) were all <0.01. Bars are 95% CI. (E) R2 obtained with regressing activity of individual regions with flail (pan-Gal4;UAS-GCaMP). Empty markers correspond to adjusted (Benjamini–Hochberg correction) p-value >0.05 for comparison to 0. Bars are 95% CI. (F) R2 obtained with regressing activity of individual regions with groom (pan-Gal4;UAS-GCaMP). Bars are 95% CI. (G) Correlation coefficient obtained with regressing activity of individual regions with flail (pan-Gal4;UAS-GCaMP). Bars are 95% CI. (H) Correlation coefficient obtained with regressing activity of individual regions with grooming behavior (pan-Gal4;UAS-GCaMP). Bars are 95% CI. (I) R2 obtained with regressing activity of individual regions with walking on an air-supported (N = 19) vs. a styrofoam ball (N = 13), p-value = 0.02. Box plots show: center line, median; box limits, upper and lower quartiles; whiskers, ×1.5 interquartile range; points, outliers. (J) R2 obtained with regressing activity of individual regions with walking on an air-supported (N = 19) vs. a Styrofoam ball (N = 13). Box plots show: center line, median; box limits, upper and lower quartiles; whiskers, ×1.5 interquartile range; points, outliers. (K) Top: Examples of brain activity maps (R2 as z-stacks) and names of individual brain regions. Bottom: Schematic showing brain regions in adult fly brain adapted from Ito et al., 2014.
Figure 2.
Figure 2.. Activity of neurons releasing the three major neurotransmitters, glutamate, GABA, and acetylcholine, during walk.
N = 5 flies for each genotype. (A) R2 for regression of single region activity with walk for different genotypes (all regions were pooled). No pairwise comparison of fly-wise averages is significantly different (Mann–Whitney U-test). Box plot: center line, median; box limits, upper and lower quartiles; whiskers, ×1.5 interquartile range; points, outliers. (B) Maps of activation during walk (regression coefficient of single region activity with walk) for Cha-Gal4, GAD-Gal4, and Vglut-Gal4 expressing neurons. See Figure 2—figure supplement 1 for values and statistical tests. Cosine similarity: Cha vs. Vglut: 0.98, Vglut vs. GAD: 0.98, Cha vs. GAD: 0.99. (C) Sample traces (ΔF/F) for different brain regions relative to forward walk (green). See Figure 2—figure supplement 1 for values. (D) R2 for regression of single region activity with walk for Cha-Gal4, GAD-Gal4, and Vglut-Gal4. 95% CI is shown. All values are significantly above zero (Benjamini–Hochberg adjusted t-test p-values <0.001).
Figure 2—figure supplement 1.
Figure 2—figure supplement 1.. Correlation coefficients for regression of single region activity with walk.
N = 5 flies for each genotype. Empty markers correspond to adjusted (Benjamini–Hochberg correction) p-value >0.05 for comparison to 0. Right, expression pattern for three example flies per genotype (baseline fluorescence at z = −60, −18, 24, and 66 µm). (A) Cholinergic neurons (Cha-Gal4;UAS-GCaMP6). (B) Glutamatergic neurons (Vglut-Gal4;UAS-GCaMP6). (C) GABAergic neurons (GAD-Gal4;UAS-GCaMP6). 95% CI. Bar is 60 µm.
Figure 3.
Figure 3.. Neuromodulatory neurons are strongly and differentially activated during walk.
TH/DDC-Gal4: N = 9, Tdc2-Gal4: N = 7, Trh-Gal4: N = 6 flies. (A) R2 for regression of single region activity with walk for different genotypes (all regions were pooled). Mann–Whitney U-test Bonferroni adjusted p-values: TH vs. Trh: 0.032, TH vs. TDC: ns, Trh vs. TDC: 0.040. Box plot: center line, median; box limits, upper and lower quartiles; whiskers, ×1.5 interquartile range; points, outliers. (B) Maps of activation during walk (regression coefficient of single region activity with walk) for TH-Gal4 and DDC-Gal4 or GMR58E04-Gal4 (dopaminergic neurons), TDC2-Gal4 (octopaminergic neurons), and Trh-Gal4 (serotonergic neurons) expressing neurons. Blue indicates inhibition. (C) Overlay of activity maps of two neuromodulators in each panel. Cosine similarity: TH vs. Trh: 0.69, TH vs. TDC: 0.93, TDC vs. Trh: 0.69. (D) Sample traces (ΔF/F) for different brain regions relative to forward walk (green). (E) Coefficient during walk for different brain regions for Trh-Gal4 expressing serotonergic neurons. All regions are significantly correlated. (F) R2 of regression of fluorescence vs. walk for TH/DDC(58E02)-Gal4, Tdc2-Gal4, and Trh-Gal4 expressing neurons. Bars are 95% CI.
Figure 3—figure supplement 1.
Figure 3—figure supplement 1.. Correlation coefficients for regression of single region activity with walk.
Empty markers correspond to adjusted (Benjamini–Hochberg correction) p-value >0.05 (null hypothesis is 0). TH/DDC-Gal4: N = 9, Tdc2-Gal4: N = 7. (A) Dopaminergic neurons (TH/DDC-Gal4 or GMR58E04-Gal4;UAS-GCaMP6). (B) Octopaminergic neurons (Tdc2-Gal4;UAS-GCaMP6). Bars are 95% CI. (C) Expression pattern for three example flies per genotype (baseline fluorescence at z = −60, −18, 24, and 66 µm).
Figure 4.
Figure 4.. Whole brain analysis pinpoints specific subregions responding to walk.
(A) Images of example components that are significantly correlated with walk (coefficient or R2 95% CI above zero). Upper left: Components derived from imaging with a pan-neuronal driver. Upper right: Components derived with Tdc2-Gal4. Lower left: Components derived with TH/DDC or GMR58E02-Gal4. Lower right: Components derived with Trh-Gal4. (B) Correlation coefficient for component activity vs. walk. N = 58 flies of different genotypes, see table in methods for details. Empty markers correspond to adjusted (Benjamini–Hochberg correction) p-value >0.05 for comparison to 0. Bars are 95% CI.
Figure 4—figure supplement 1.
Figure 4—figure supplement 1.. Component maps and correlation with walk.
(A) Z-stacks of functional components for walk mapped onto the adult fly brain. (B) Functional components for walk and their names or acronyms. See Table 2 for definition of acronyms. (C) R2 for regression of components activity with walk. See Table 2 for definition of acronyms. N = 58 flies of different genotypes; see table in methods for details. Bars are 95% CI.
Figure 5.
Figure 5.. Turning activates specific components and candidate neurons.
(A) Examples of components present in both the left and right hemispheres labeled in different colors (magenta and green). Panels on the right present an example component that could be mapped to a single neuron. Upper right panel: Turning-correlated component, lower right panel: reconstruction of neuron that this functional component was mapped to. (B) Difference between the correlation coefficient (normalized ∆F/F) for turning on the ipsilateral side and the coefficient on the contralateral side is displayed as a function of the identified components. Positive and negative correlations correspond to components being active more during turn on the ipsilateral side than the contralateral side and the reverse, respectively. See Table 2 for definition of acronyms. N = 58 flies of different genotypes, see table in methods for details. Empty markers correspond to adjusted (Benjamini–Hochberg correction) p-value >0.05 for comparison to 0. Bars are 95% CI.
Figure 5—figure supplement 1.
Figure 5—figure supplement 1.. Turning activates specific components and candidate neurons.
(A) Examples of components present in both the left and right hemispheres labeled in different colors (magenta and green). (B) R2 of regression coefficients during turn for all genotypes. The value for the contralateral side was subtracted from the ipsilateral side and plotted for every component. N = 58 flies of different genotypes, see table in methods for details. Empty markers correspond to adjusted (Benjamini–Hochberg correction) p-value >0.05 for comparison to 0. Bars are 95% CI.
Figure 6.
Figure 6.. Onset dynamics of activity in multiple functional components across the brain at start of walk.
Walk-onset triggered average activity for pan-neuronal data in individual active components at 30 Hz or higher temporal resolution. Trials were normalized individually before averaging (see Figure 6—figure supplement 1 for non-normalized traces and all recording frame rates). Red band indicates walk onset. Note that while most components are activated after walk onset, several components show activity before start of walk. Stars correspond to an above zero significance for integrated traces from −0.5 s to start of walk (Wilcoxon one-sided test). Multiple comparison adjusted p-values (Benjamini–Hochberg): *p < 0.05, **p < 0.01, ***p < 0.001. See Table 2 for definition of acronyms. N = 30 flies of different genotypes, see table in methods for details.
Figure 6—figure supplement 1.
Figure 6—figure supplement 1.. Graphs show onset of walk trials for all flies and all transgenic lines at all recording speeds.
The gray band represents the uncertainty of walk-onset time due to lower temporal resolution in some recordings. A corrective factor based on regression coefficient with walk (fluorescence response to walk = coeff × UAS-GCaMP version: GCaMP7f: 0.6, GCaMP6f: 1, GCaMP6M: 1.1, GCaMP7s: 1.2, GCaMP6s: 1.4) was applied for direct comparison between experiments with different reporter versions. The average value for the first 50 ms was taken as baseline and subtracted. Gray shaded area represents walk onset.
Figure 6—figure supplement 2.
Figure 6—figure supplement 2.. Normalized trials ∆F/F GCaMP fluorescence in brain regions 1 s before to 1 s after walk onset for different anatomically defined brain regions: (A) dopaminergic neurons (TH/DDC-Gal4;UAS-GCaMP), (B) octopaminergic neurons (Tdc2-Gal4;UAS-GCaMP), and (C) serotonergic neurons (Trh-Gal4;UAS-GCaMP).
Gray shading corresponds to the standard deviation. Red band is the onset of walk.
Figure 7.
Figure 7.. Forced and spontaneous walk elicit highly similar global brain activity.
(A) Z-stacks of map of brain regions activated by walk in flies expressing cytosolic GCaMP (pan-Gal4;UAS-GCaMP6m) or synaptically tagged GCaMP (pan-Gal4;UAS-sytGCaMP6m) (R2 of FF=f(walk)). (B) Time series of components during spontaneous walk (green) or rest (magenta). Box plots show: center line, median; box limits, upper and lower quartiles; whiskers, ×1.5 interquartile range; points, outliers. (C) Time series of active components during forced walk (green) or forced rest (magenta). (D) R2 for behavior regression at different conditions (all regions were pooled, spontaneous, forced, forced with severed connection between ventral nerve cord (VNC) and brain). (E) R2 for behavior regression for different active components for forced (red) vs. spontaneous (green) walk. Empty markers correspond to adjusted (Benjamini–Hochberg correction) p-value >0.05 for comparison to 0. Bars are 95% CI. (F) R2 difference between brain region activity during forced turn on the ipsilateral side and forced turn on the contralateral side (orange). Forced turning speeds ranged from 0.3 to 2 rad/s. Only data with N ≥ 4 components were analyzed. Lilac shows the difference for spontaneous turns. N = 58 flies for spontaneous walk/turn of different genotypes and N = 26 flies for forced walk/turn, see table in methods for details. Empty markers correspond to adjusted (Benjamini–Hochberg correction) p-value >0.05 for comparison to 0. Star corresponds to a significant difference between spontaneous and forced turns: Mann–Whitney U-test adjusted p-value <0.05 (Benjamini–Hochberg correction). Box plots show: center line, median; box limits, upper and lower quartiles; whiskers, ×1.5 interquartile range; points, outliers. Bars are 95% CI. (G) Comparison between activity at walk onset for spontaneous (green) and forced (red) walk for additional components. Individual trials were normalized and averaged for each component. Shaded regions represent the trial SEM (standard error of the mean), nf: number of flies, nt: total number of trials. Gray shaded area indicate walk onset. Stars show the significance of difference in the integral between −0.5 s and the start of walk, and is corrected for multiple comparison (Benjamini–Hochberg): *p < 0.05, ***p < 0.001.
Figure 7—figure supplement 1.
Figure 7—figure supplement 1.. Additional evidence for most activity being induced by walk.
(A) Comparison of activity during walk for cytosolic and synaptically tagged GCaMP. Left: expression patterns (baseline fluorescence), Right: Coefficient in linear models of regional activity as a function of walk. (B) Regression coefficients with forced or spontaneous walk for components. Bar is 60 µm. (C) R2 and coefficient for ∆F/F regression with forced and spontaneous walk for different brain regions for dopaminergic neurons. (D) R2 and coefficient for ∆F/F regression with forced and spontaneous walk for different brain regions for octopaminergic neurons. (E) R2 and coefficient for ∆F/F regression with forced and spontaneous walk for different brain regions for serotonergic neurons. TH/DDC-Gal4: spontaneous, N = 9, forced, N = 5; Tdc2-Gal4: spontaneous, N = 7, forced, N = 6; Trh-Gal4: spontaneous, N = 6, forced, N = 6 flies. (B-E): Empty markers correspond to adjusted (Benjamini–Hochberg correction) p-value >0.05 for comparison to 0. Bars are 95% CI. (F) Panel showing GCaMP-fluorescence relative to onset of walk for pan-neuronally expressed GCaMPs in different regions relative to the GNG. Piece-wise linear curves were fitted to fluorescence traces 0.5 s before to 0.5 s after the onset of walk. The onset time was determined as the point of change from one linear piece to the next. Note that all medians are positive. Inset: Fit of activity onset. TH/DDC-Gal4: N = 9, Tdc2-Gal4: N = 7, Trh-Gal4: N = 6 flies. (G) Comparison between activity at walk onset for spontaneous (green) and forced (red) walk for additional components. Individual trials were normalized and averaged for each component. Shaded regions represent the trial SEM, nf: number of flies, nt: total number of trials. Stars show the significance of difference in the integral between −500 ms to start of walk, and is corrected for multiple comparison (Benjamini–Hochberg): **p < 0.01, ***p < 0.01.

Update of

  • doi: 10.1101/2022.01.17.476660

Similar articles

Cited by

References

    1. Ache JM, Namiki S, Lee A, Branson K, Card GM. State-Dependent decoupling of sensory and motor circuits underlies behavioral flexibility in Drosophila. Nature Neuroscience. 2019;22:1132–1139. doi: 10.1038/s41593-019-0413-4. - DOI - PMC - PubMed
    1. Afelt Z. Functional significance of ventral descending tracts of the spinal cord in the cat. Acta Neurobiologiae Experimentalis. 1974;34:393–407. - PubMed
    1. Agrawal S, Dickinson ES, Sustar A, Gurung P, Shepherd D, Truman JW, Tuthill JC. Central processing of leg proprioception in Drosophila. eLife. 2020;9:e60299. doi: 10.7554/eLife.60299. - DOI - PMC - PubMed
    1. Aimon S, Grunwald Kadow IC. Studying complex brain dynamics using Drosophila. Journal of Neurogenetics. 2019;1:7. doi: 10.1080/01677063.2019.1706092. - DOI - PubMed
    1. Aimon S, Katsuki T, Jia T, Grosenick L, Broxton M, Deisseroth K, Sejnowski TJ, Greenspan RJ. Fast near-whole-brain imaging in adult Drosophila during responses to stimuli and behavior. PLOS Biology. 2019;17:e2006732. doi: 10.1371/journal.pbio.2006732. - DOI - PMC - PubMed

Publication types

LinkOut - more resources