Editorial
. 2023 May 4;13(5):1084-1099.
doi: 10.1158/2159-8290.CD-23-0208.

Opportunities for Achieving the Cancer Moonshot Goal of a 50% Reduction in Cancer Mortality by 2047

Affiliations
Editorial

Opportunities for Achieving the Cancer Moonshot Goal of a 50% Reduction in Cancer Mortality by 2047

Meredith S Shiels et al. Cancer Discov. .

Abstract

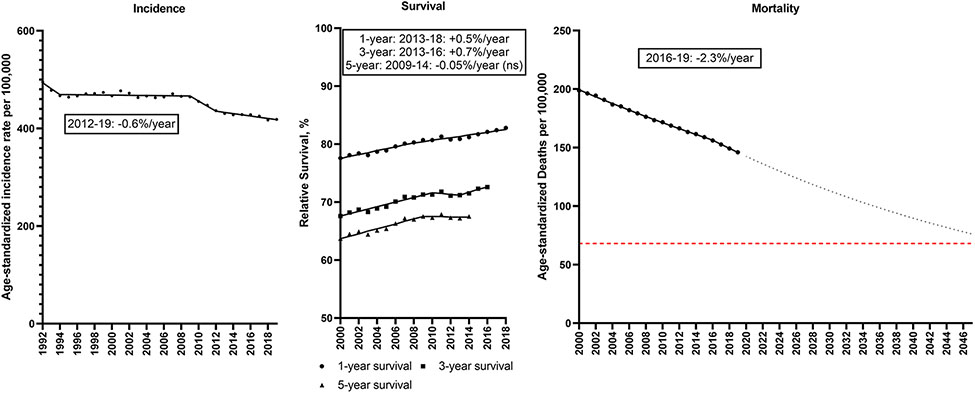
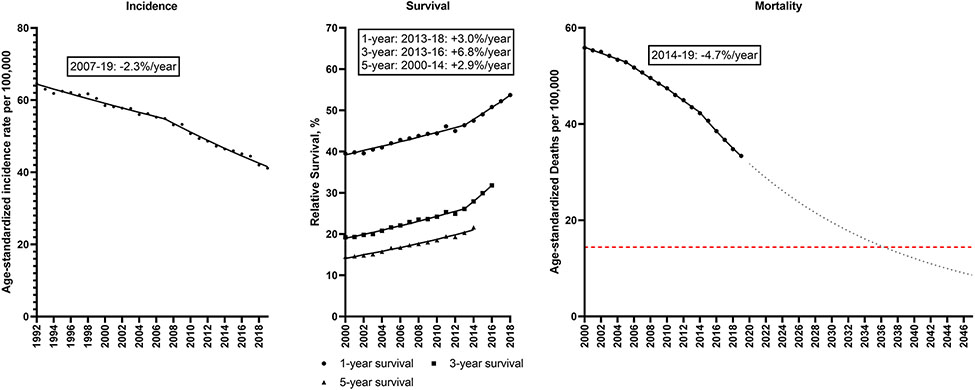
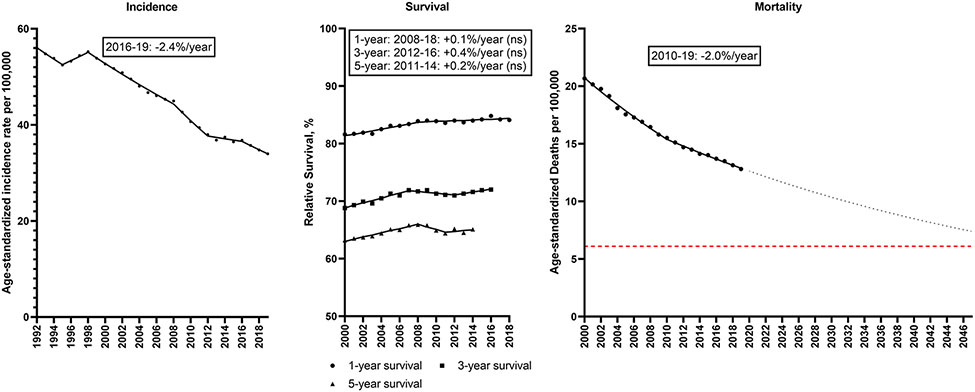
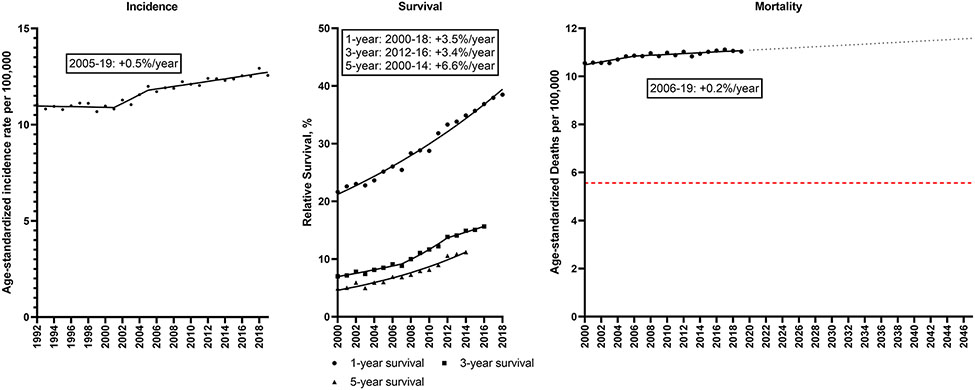
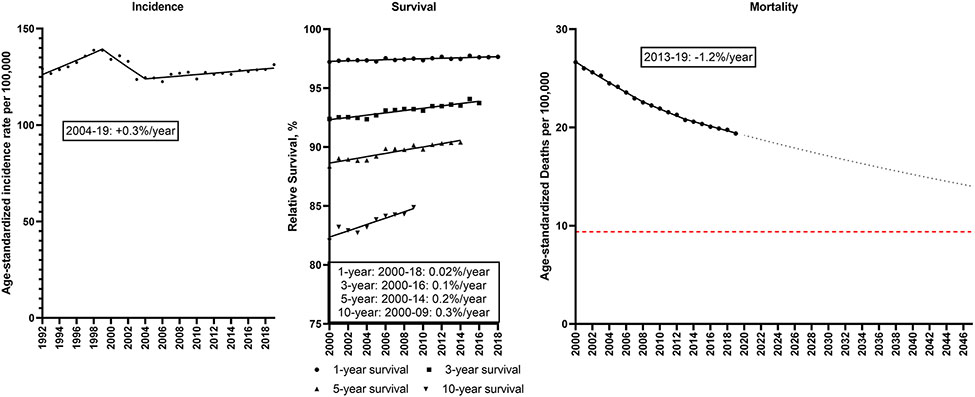
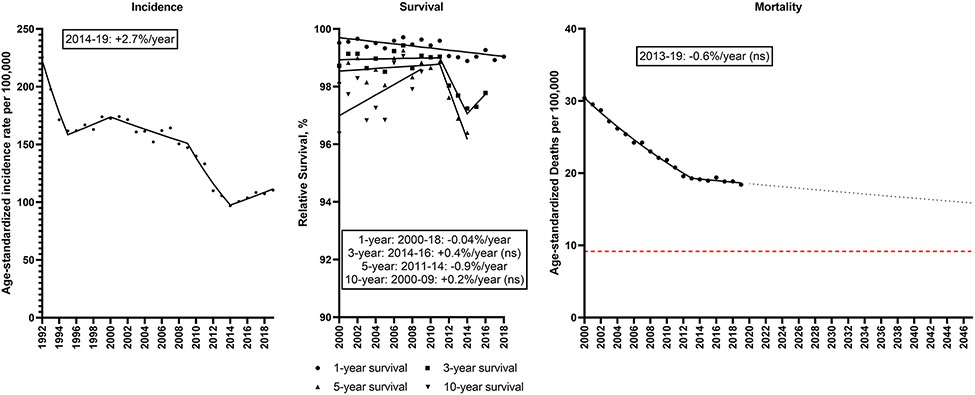
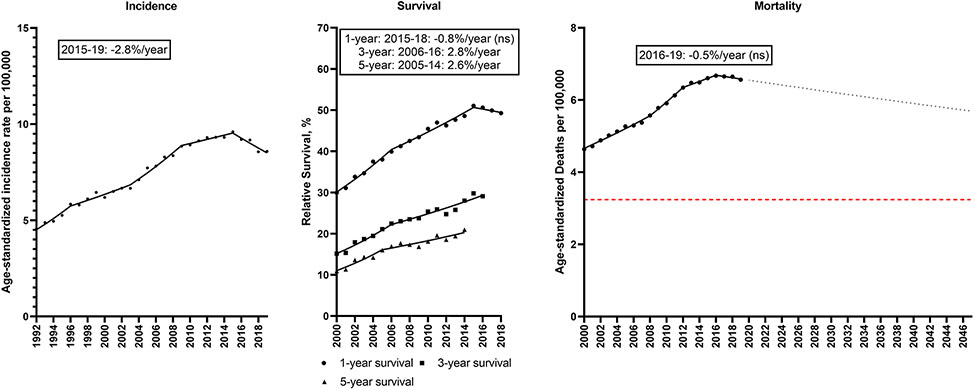
On February 2, 2022, President Biden and First Lady Dr. Biden reignited the Cancer Moonshot, setting a new goal to reduce age-standardized cancer mortality rates by at least 50% over the next 25 years in the United States. We estimated trends in U.S. cancer mortality during 2000 to 2019 for all cancers and the six leading types (lung, colorectum, pancreas, breast, prostate, liver). Cancer death rates overall declined by 1.4% per year from 2000 to 2015, accelerating to 2.3% per year during 2016 to 2019, driven by strong declines in lung cancer mortality (-4.7%/year, 2014 to 2019). Recent declines in colorectal (-2.0%/year, 2010-2019) and breast cancer death rates (-1.2%/year, 2013-2019) also contributed. However, trends for other cancer types were less promising. To achieve the Moonshot goal, progress against lung, colorectal, and breast cancer deaths needs to be maintained and/or accelerated, and new strategies for prostate, liver, pancreatic, and other cancers are needed. We reviewed opportunities to prevent, detect, and treat these common cancers that could further reduce population-level cancer death rates and also reduce disparities.

Significance: We reviewed opportunities to prevent, detect, and treat common cancers, and show that to achieve the Moonshot goal, progress against lung, colorectal, and breast cancer deaths needs to be maintained and/or accelerated, and new strategies for prostate, liver, pancreatic, and other cancers are needed. See related commentary by Bertagnolli et al., p. 1049. This article is highlighted in the In This Issue feature, p. 1027.


Conflict of interest statement

The authors have no conflicts of interest to declare.

Figures

Figure 1.
Figure 1.. Total cancer
Incidence rates (1992-2019), 1, 3 and 5-year relative survival (2000-2018, 2016, 2014) and mortality rates (2000-2019) for total cancer in the U.S. Points represent observed values and lines represent fitted estimates from Joinpoint models. For mortality rates, dashed lines represent projected mortality rates through 2047 based on extrapolating the data from the most recent trend. The red dashed line represents a 50% decline in age-standardized death rates from 2022. Estimates provided are annual percentage changes in rates for the most recent time period. ns: not statistically significant
Figure 2.
Figure 2.. Lung cancer
Incidence rates (1992-2019), 1, 3 and 5-year relative survival (2000-2018, 2016, 2014) and mortality rates (2000-2019) for lung cancer in the U.S. Points represent observed values and lines represent fitted estimates from Joinpoint models. For mortality rates, dashed lines represent projected mortality rates through 2047 based on extrapolating the data from the most recent trend. The red dashed line represents a 50% decline in age-standardized death rates from 2022. Estimates provided are annual percentage changes in rates for the most recent time period.
Figure 3.
Figure 3.. Colorectal cancer
Incidence rates (1992-2019), 1, 3 and 5-year relative survival (2000-2018, 2016, 2014) and mortality rates (2000-2019) for colorectal cancer in the U.S. Points represent observed values and lines represent fitted estimates from Joinpoint models. For mortality rates, dashed lines represent projected mortality rates through 2047 based on extrapolating the data from the most recent trend. The red dashed line represents a 50% decline in age-standardized death rates from 2022. Estimates provided are annual percentage changes in rates for the most recent time period. ns: not statistically significant
Figure 4.
Figure 4.. Pancreas cancer
Incidence rates (1992-2019), 1, 3 and 5-year relative survival (2000-2018, 2016, 2014) and mortality rates (2000-2019) for pancreatic cancer in the U.S. Points represent observed values and lines represent fitted estimates from Joinpoint models. For mortality rates, dashed lines represent projected mortality rates through 2047 based on extrapolating the data from the most recent trend. The red dashed line represents a 50% decline in age-standardized death rates from 2022. Estimates provided are annual percentage changes in rates for the most recent time period.
Figure 5.
Figure 5.. Female breast cancer
Incidence rates (1992-2019), 1, 3, 5 and 10-year relative survival (2000-2018, 2016, 2014, 2009) and mortality rates (2000-2019) for female breast cancer in the U.S. Points represent observed values and lines represent fitted estimates from Joinpoint models. For mortality rates, dashed lines represent projected mortality rates through 2047 based on extrapolating the data from the most recent trend. The red dashed line represents a 50% decline in age-standardized death rates from 2022. Estimates provided are annual percentage changes in rates for the most recent time period.
Figure 6.
Figure 6.. Prostate cancer
Incidence rates (1992-2019), 1, 3, 5 and 10-year relative survival (2000-2018, 2016, 2014, 2009) and mortality rates (2000-2019) for prostate cancer in men in the U.S. Points represent observed values and lines represent fitted estimates from Joinpoint models. For mortality rates, dashed lines represent projected mortality rates through 2047 based on extrapolating the data from the most recent trend. The red dashed line represents a 50% decline in age-standardized death rates from 2022. Estimates provided are annual percentage changes in rates for the most recent time period. ns: not statistically significant
Figure 7.
Figure 7.. Liver cancer
Incidence rates (1992-2019), 1, 3 and 5-year relative survival (2000-2018, 2016, 2014) and mortality rates (2000-2019) for liver and intrahepatic bile duct cancer in the U.S. Points represent observed values and lines represent fitted estimates from Joinpoint models. For mortality rates, dashed lines represent projected mortality rates through 2047 based on extrapolating the data from the most recent trend. The red dashed line represents a 50% decline in age-standardized death rates from 2022. Estimates provided are annual percentage changes in rates for the most recent time period. ns: not statistically significant

Comment in

Comment on

References

    1. Kratzer TB, Siegel RL, Miller KD, Sung H, Islami F, Jemal A. Progress Against Cancer Mortality 50 Years After Passage of the National Cancer Act. JAMA Oncology 2022;8(1):156 doi 10.1001/jamaoncol.2021.5668. - DOI - PMC - PubMed
    1. Xu J, Murphy S, Kochenek K, Arias E. Deaths: Final Deata for 2019. National Vital Statistics Reports 2021;70(8). - PubMed
    1. Sharpless NE, Singer DS. Progress and potential: The Cancer Moonshot. Cancer Cell 2021;39(7):889–94 doi 10.1016/j.ccell.2021.04.015. - DOI - PMC - PubMed
    1. Singer DS. A new phase of the Cancer Moonshot to end cancer as we know it. Nat Med 2022;28(7):1345–7 doi 10.1038/s41591-022-01881-5. - DOI - PMC - PubMed
    1. Ellis L, Woods LM, Estève J, Eloranta S, Coleman MP, Rachet B. Cancer incidence, survival and mortality: Explaining the concepts. International Journal of Cancer 2014;135(8):1774–82 doi 10.1002/ijc.28990. - DOI - PubMed