A Meta-Analysis of Randomized Trial Outcomes for the t:slim X2 Insulin Pump with Control-IQ Technology in Youth and Adults from Age 2 to 72
- PMID: 37067353
- PMCID: PMC10171957
- DOI: 10.1089/dia.2022.0558
A Meta-Analysis of Randomized Trial Outcomes for the t:slim X2 Insulin Pump with Control-IQ Technology in Youth and Adults from Age 2 to 72
Abstract
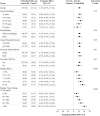
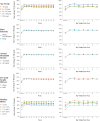
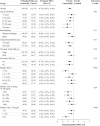
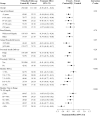
Objective: To evaluate the effect of hybrid-closed loop Control-IQ technology (Control-IQ) in randomized controlled trials (RCTs) in subgroups based on baseline characteristics such as race/ethnicity, socioeconomic status (SES), prestudy insulin delivery modality (pump or multiple daily injections), and baseline glycemic control. Methods: Data were pooled and analyzed from 3 RCTs comparing Control-IQ to a Control group using continuous glucose monitoring in 369 participants with type 1 diabetes (T1D) from age 2 to 72 years old. Results: Time in range 70-180 mg/dL (TIR) in the Control-IQ group (n = 256) increased from 57% ± 17% at baseline to 70% ± 11% during follow-up, and in the Control group (n = 113) was 56% ± 15% and 57% ± 14%, respectively (adjusted treatment group difference = 11.5%, 95% confidence interval +9.7% to +13.2%, P < 0.001), an increase of 2.8 h/day on average. Significant reductions in mean glucose, hyperglycemia metrics, hypoglycemic metrics, and HbA1c were also observed. A statistically similar beneficial treatment effect on time in range 70-180 mg/dL was observed across the full age range irrespective of race-ethnicity, household income, prestudy continuous glucose monitor use, or prestudy insulin delivery method. Participants with the highest baseline HbA1c levels showed the greatest improvements in TIR and HbA1c. Conclusion: This pooled analysis of Control-IQ RCTs demonstrates the beneficial effect of Control-IQ in T1D across a broad spectrum of participant characteristics, including racial-ethnic minority, lower SES, lack of prestudy insulin pump experience, and high HbA1c levels. The greatest benefit was observed in participants with the worst baseline glycemic control in whom the auto-bolus feature of the Control-IQ algorithm appears to have substantial impact. Since no subgroups were identified that did not benefit from Control-IQ, hybrid-closed loop technology should be strongly considered for all youth and adults with T1D. Clinical Trials Registry: clinicaltrials.gov; NCT03563313, NCT03844789, and NCT04796779.
Keywords: Artificial pancreas; Automated insulin delivery; Type 1 diabetes.
Conflict of interest statement
Roy W. Beck reports no personal financial disclosures but reports that his institution has received funding on his behalf as follows: grant funding and study supplies from Tandem Diabetes Care, Beta Bionics, and Dexcom; grant funding from Bigfoot Biomedical; study supplies from Medtronic, Ascencia, and Roche; consulting fees and study supplies from Eli Lilly and Novo Nordisk; and consulting fees from Insulet, Zucara, Hagar, and Vertex. Lauren G. Kanapka reports no personal financial disclosures. MDB reports speaker activities for Arecor, and Tandem Diabetes Care. Marc D. Breton reports consultant activities for Dexcom and Roche. Marc D. Breton further reports inventorship of intellectual property in the field of diabetes technologies owned and managed by his employer, the University of Virginia, with active, royalty bearing licenses.
Finally, Marc D. Breton reports that the Center for Diabetes Technology at UVA has received grant funding and material support for research from Arecor, Dexcom, Tandem, Novo Nordisk, and Insulet. Sue A. Brown reports no personal financial disclosures and reports receiving grant and study supply support to the University of Virginia from Dexcom, Insulet, Roche, Tandem Diabetes Care and Tolerion, R. Paul Wadwa reports speaker activities for Dexcom and advisory board for Eli Lilly & Co., conference travel support from Dexcom and Eli Lilly & Co. and grant and study supply support from Dexcom, Elil Lilly & Co. and Tandem Diabetes Care. Bruce A. Buckingham has received institutional research support from Tandem Diabetes Care, Insulet, Medtronic, and Bionic Pancreas, and has been on advisory boards for Medtronic, Novo Nordisk, and Lilly. Craig Kollman reports no personal financial disclosures.
Boris Kovatchev reports receiving grant support, paid to the University of Virginia, from Dexcom and Novo Nordisk, study materials provided to the University of Virginia, from Dexcom and Tandem Diabetes Care, and holding patents on optimization of glycemic control and design of closed-loop algorithms, licensed to Dexcom, Johnson & Johnson, Novo Nordisk, and Sanofi, for which royalties are received through the University of Virginia.
Figures


References
-
- Bergenstal RM, Garg S, Weinzimer SA, et al. . Safety of a hybrid closed-loop insulin delivery system in patients with type 1 diabetes. JAMA 2016;316(13):1407–1408. - PubMed
Publication types
MeSH terms
Substances
Associated data
Grants and funding
LinkOut - more resources
Full Text Sources
Medical
Research Materials
