. 2023 Jun 15;11(3):e0496722.
doi: 10.1128/spectrum.04967-22. Epub 2023 Apr 17.

Influence of Maternal Breast Milk and Vaginal Microbiome on Neonatal Gut Microbiome: a Longitudinal Study during the First Year

Affiliations

Influence of Maternal Breast Milk and Vaginal Microbiome on Neonatal Gut Microbiome: a Longitudinal Study during the First Year

Chandrika Bhattacharyya et al. Microbiol Spectr. .

Abstract

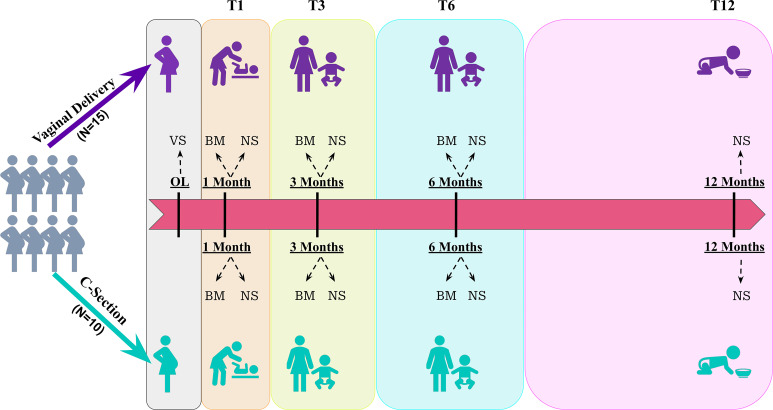
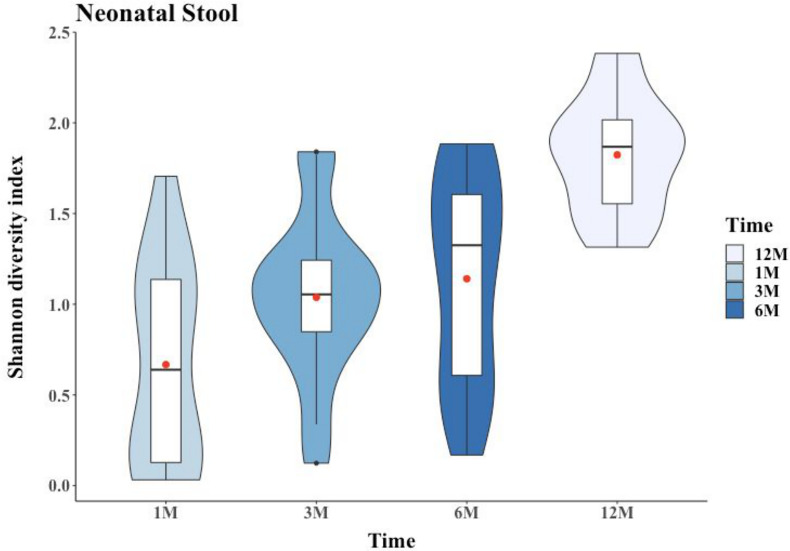
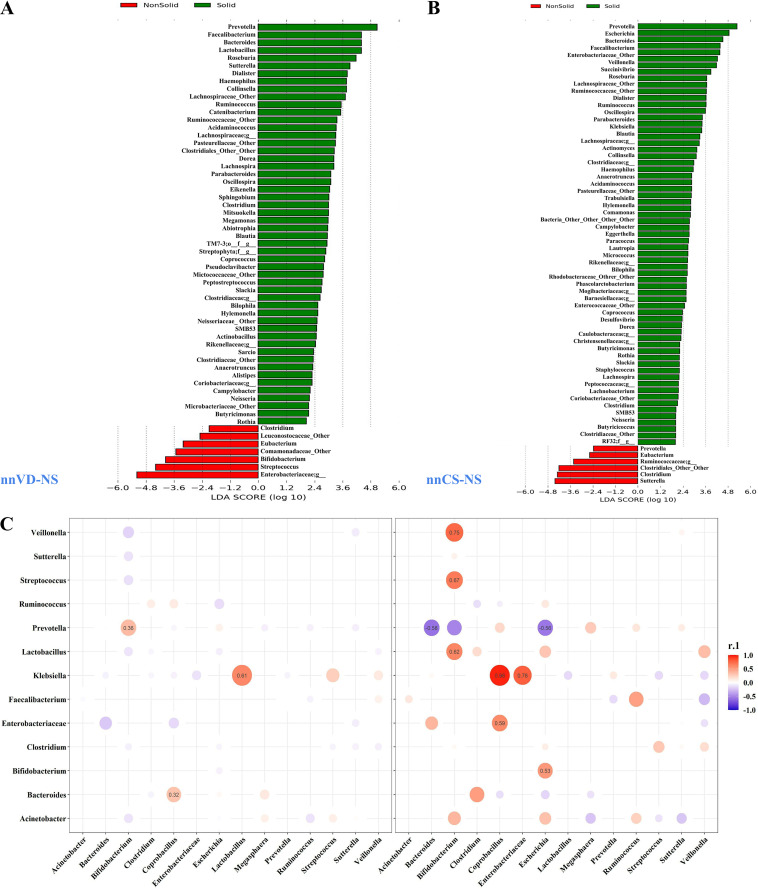
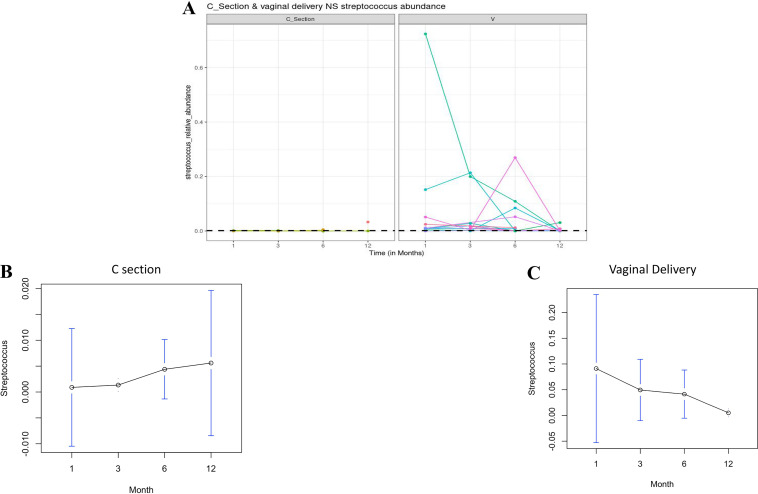
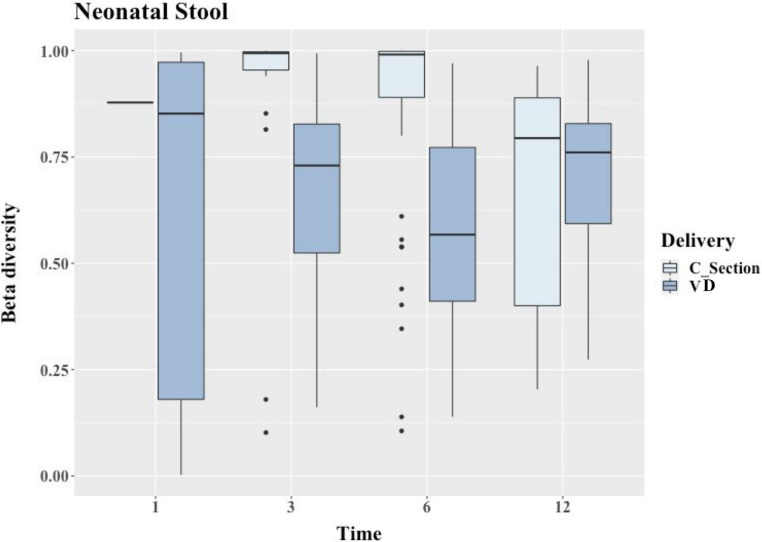
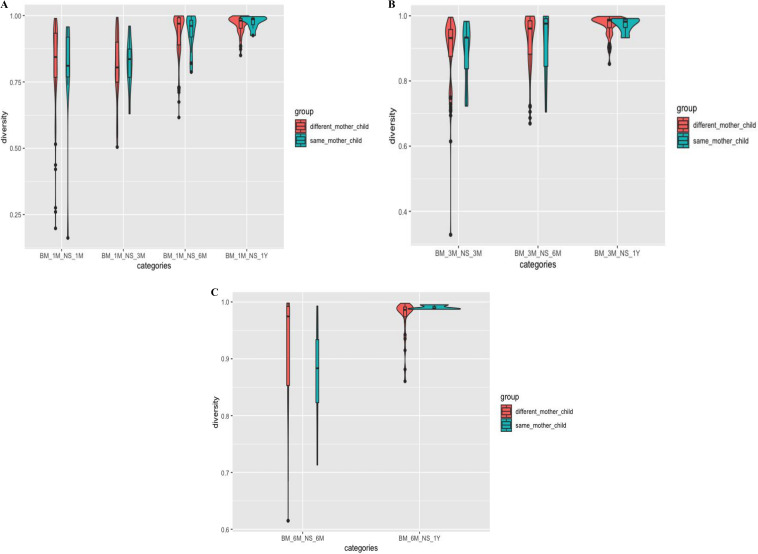
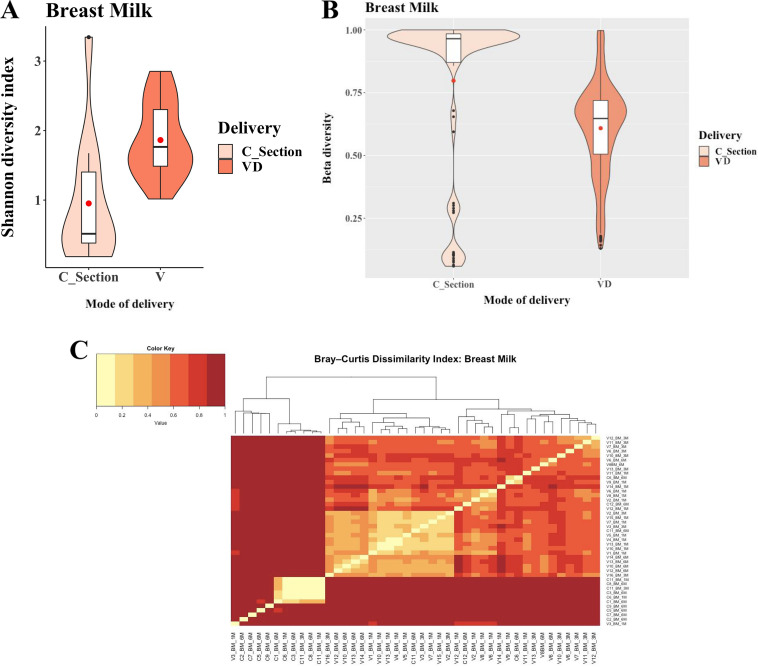
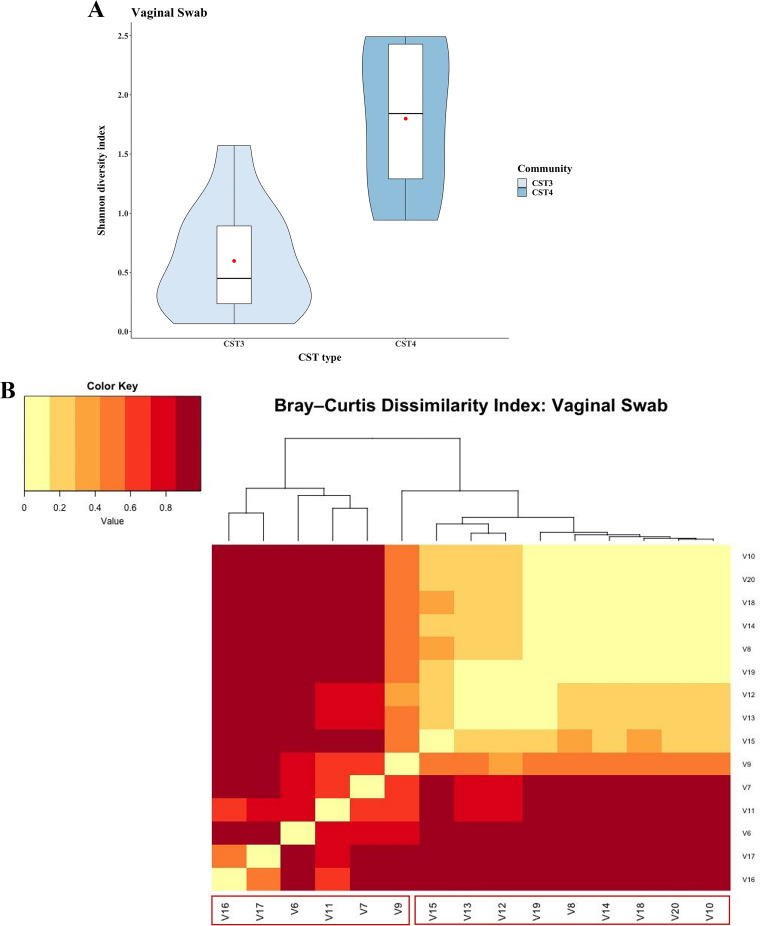
It is believed that establishment of the gut microbiome starts very early in life and is crucial for growth, immunity, and long-term metabolic health. In this longitudinal study, we recruited 25 mothers in their third trimester, of whom 15 had vaginal delivery while 10 had an unplanned cesarean section (C-section). The mother-neonate pairs were followed for 1 year, and we generated 16S metagenomic data to study the neonatal gut microbiome along with mother's breast milk and vaginal microbiomes through 12 months after delivery, at 1, 3, 6, and 12 months. We inferred (i) mode of delivery is an important factor influencing both composition and entropy of the neonatal gut microbiome, and the genus Streptococcus plays an important role in the temporal differentiation. (ii) Microbial diversity monotonically increases with age, irrespective of the mode of delivery, and it is significantly altered once exclusive breastfeeding is stopped. (iii) We found little evidence in favor of the microflora of mother's breast milk and a vaginal swab being directly reflected in the offspring's gut microbiome; however, some distinction could be made in the gut microbiome of neonates whose mothers were classified as community state type III (CSTIII) and CSTIV, based on their vaginal microbiomes. (iv) A lot of the mature gut microbiome is possibly acquired from the environment, as the genera Prevotella and Faecalibacterium, two of the most abundant flora in the neonatal gut microbiome, are introduced after initiation of solidified food. The distinction between the gut microbiome of babies born by vaginal delivery and babies born by C-section becomes blurred after introduction of solid food, although the diversity in the gut microbiota drastically increases in both cases. IMPORTANCE Gut microbiome architecture seems to have a potential impact on host metabolism, health, and nutrition. Early life gut microbiome development is considered a crucial phenomenon for neonatal health as well as adulthood metabolic complications. In this longitudinal study, we examined the association of neonatal gut microbiome entropy and its temporal variation. The study revealed that adult-like gut microbiome architecture starts taking shape after initiation of solidified food. Further, we also observed that the difference of microbial diversity was reduced between vaginally delivered and C-section babies compared to exclusive breastfeeding tenure. We found evidence in favor of the inheritance of the microflora of mother's posterior vaginal wall to the offspring's gut microbiome.

Keywords: breast milk; gut microbiome; maternal microbiome; neonatal; neonatal stool.


Conflict of interest statement

The authors declare no conflict of interest.

Figures

FIG 1
FIG 1
A longitudinal study on the neonatal GM in a mother-child paired design. Initially, 25 pregnant mothers were enrolled. Based on the mode of delivery, they were classified as vaginal delivery (VD) or C-section delivery (CS). A vaginal swab (VS) was collected at onset of labor (OL) for the mothers undergoing VD. All the mother-neonate pairs were followed and samples were collected: (1) breast milk (BM) from all mothers who had VD or CS, at 3 different time periods, T1, T2, and T3. (2) Neonatal stool (NS) from all children at 4 different time periods, T1, T2, T3, and T4.
FIG 2
FIG 2
The dynamics of alpha-diversity (richness) of the neonatal gut microbiome with respect to different time points (1, 3, 6, and 12 months) was estimated through a Shannon diversity index (SDI) and illustrated by using violin plots. A Kruskal-Wallis test was employed for statistical comparisons. The diversity rose with time and peaks following the introduction of solidified food, i.e., at 12 months. The red dot represents the mean.
FIG 3
FIG 3
(A and B) Linear discriminant analysis (LDA) was used to identify the discriminative bacterial taxa between nonsolid (breast milk) and solid food among neonates delivered vaginally (nnVD-NS) (A) and via C-section (nnCS-NS) (B). The figure demonstrates that the bacteria taxon satisfied the default threshold of a 2.5-log LDA score. (C) Alteration of correlation among OTUs of neonatal gut microbiome compared between exclusively breastfed tenure (1 to 6 months) and after initiation of solidified food (12 months).
FIG 4
FIG 4
The microbiome interpretable temporal rule engine (MITRE) was used to identify Streptococcus as a key genus for microbiota time-series data linked to age of neonates among VD as well as CS infants. (A) The figure contains the individual trajectories of Streptococcus abundance in the two groups. The black dashed line represents an average abundance of 0.0013, which classifies the CS and VD groups. (B) Proportion of the genus Streptococcus in NS increased monotonously from month 1 to 12 among infants delivered by CS. For both panels A and B, the number of samples in each time points was as follows: n = 2 at 1 month, n = 4 at 3 months, n = 7 at 6 months, and n = 2 at 12 months. (C) The trend was antagonistic and the Streptococcus proportion decreased from month 1 to 12 among the VD group. The number of samples in each time points was as follows: n = 11 at 1 month, n = 10 at 3 months, n = 13 at 6 months, and n = 9 at 12 months.
FIG 5
FIG 5
The interindividual variation of neonatal gut between vaginally delivered (VD) and C-section (CS) neonates with respect to different time points (in months) was determined by Bray-Curtis diversity index and illustrated through box-whisker plots. The outliers are represented as black dots. The number of samples for each mode of delivery was as follows: VD, n = 11 at 1 months, n = 10 at 3 months, n = 13 at 6 months, and n = 9 at 12 months; CS, n = 2 at 1 month, n = 7 at 3 months, n = 12 at 6 months, and n = 6 at 12 months.
FIG 6
FIG 6
Comparison of the Bray-Curtis dissimilarity index (BCDI) of the microbiome found in NS and BM between the same mother-child pair and between children and different women other than their respective mothers (different mother child). (A) In the first month, BM with different time points of NS, i.e., 1, 3, 6, and 12 months. (B) The 3-month BM with different time points of NS collection, i.e., 3, 6, and 12 months. (C) The 6-month BM with different time points of NS sampling, i.e., 6 and 12 months. The distance between mother-neonate microbiome profiles significantly increased with time, and microbiome diversity of NS at T12 was highest and was quite distinct from BM at any time point. The black dots in the figures represent the outliers.
FIG 7
FIG 7
Alpha-diversity of the breast milk among vaginal delivery (VD) and C-section mothers was estimated through a Shannon diversity index (SDI) and illustrated by using violin plots. A Kruskal-Wallis test was employed for statistical comparison. The interindividual variation of the breast milk among VD and C-section mothers was estimated by using the Bray-Curtis diversity index (A) and is depicted by the violin plot (B) as well as a heat map (C).
FIG 8
FIG 8
Alpha-diversity of the vaginal microbiota among CST3 and CST4 mothers at the onset of labor (OL) was estimated through the Shannon diversity index (SDI) and illustrated by using violin plots. (A) A Mann-Whitney test was employed for statistical comparison. The red dot represents the mean. (B) A heat map depicting the interindividual variation of the vaginal microbiota among CST3 and CST4 mothers was estimated by using the Bray-Curtis diversity index.

Similar articles

Cited by

References

    1. Belkaid Y, Hand TW. 2014. Role of the microbiota in immunity and inflammation. Cell 157:121–141. doi:10.1016/j.cell.2014.03.011. - DOI - PMC - PubMed
    1. Koskella B, Hall LJ, Metcalf CJE. 2017. The microbiome beyond the horizon of ecological and evolutionary theory. Nat Ecol Evol 1:1606–1615. doi:10.1038/s41559-017-0340-2. - DOI - PubMed
    1. Zheng D, Liwinski T, Elinav E. 2020. Interaction between microbiota and immunity in health and disease. Cell Res 30:492–506. doi:10.1038/s41422-020-0332-7. - DOI - PMC - PubMed
    1. McKenney EA, Koelle K, Dunn RR, Yoder AD. 2018. The ecosystem services of animal microbiomes. Mol Ecol 27:2164–2172. doi:10.1111/mec.14532. - DOI - PubMed
    1. Henry LP, Bruijning M, Forsberg SKG, Ayroles JF. 2021. The microbiome extends host evolutionary potential. Nat Commun 12:5141. doi:10.1038/s41467-021-25315-x. - DOI - PMC - PubMed

Publication types

LinkOut - more resources