. 2023 May 1;20(5):2738-2753.
doi: 10.1021/acs.molpharmaceut.3c00191. Epub 2023 Apr 17.

Using Cluster Theory to Calculate the Experimental Structure Factors of Antibody Solutions

Affiliations

Using Cluster Theory to Calculate the Experimental Structure Factors of Antibody Solutions

Nicholas Skar-Gislinge et al. Mol Pharm. .

Abstract

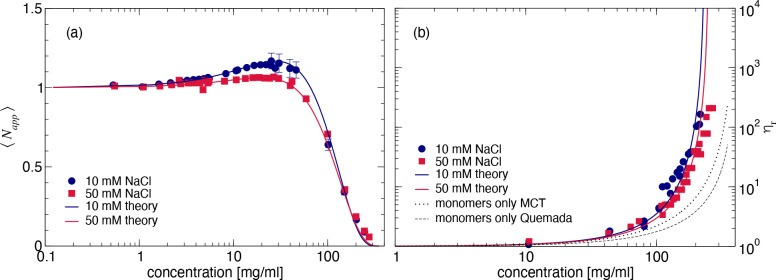
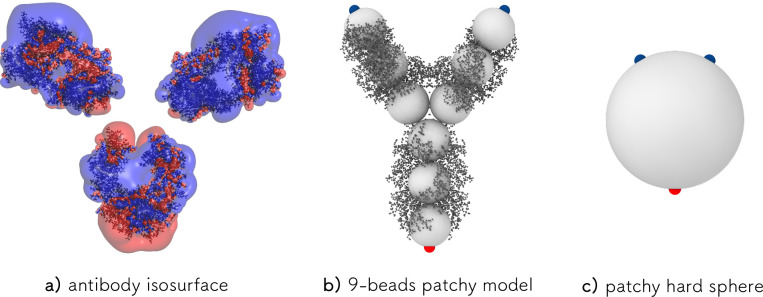
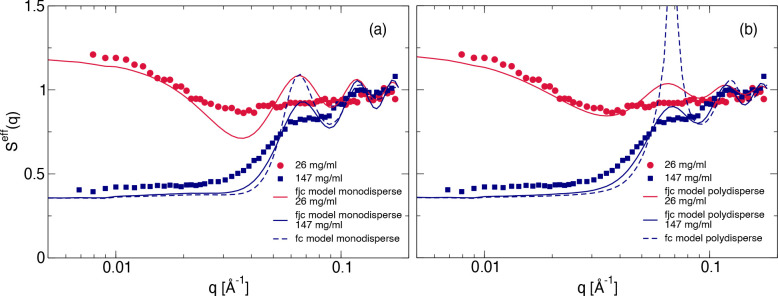
Monoclonal antibody solutions are set to become a major therapeutic tool in the years to come, capable of targeting various diseases by clever design of their antigen binding site. However, the formulation of stable solutions suitable for patient self-administration typically presents challenges, as a result of the increase in viscosity that often occurs at high concentrations. Here, we establish a link between the microscopic molecular details and the resulting properties of an antibody solution through the characterization of clusters, which arise in the presence of self-associating antibodies. In particular, we find that experimental small-angle X-ray scattering data can be interpreted by means of analytical models previously exploited for the study of polymeric and colloidal objects, based on the presence of such clusters. The latter are determined by theoretical calculations and supported by computer simulations of a coarse-grained minimal model, in which antibodies are treated as Y-shaped colloidal molecules and attractive domains are designed as patches. Using the theoretically predicted cluster size distributions, we are able to describe the experimental structure factors over a wide range of concentration and salt conditions. We thus provide microscopic evidence for the well-established fact that the concentration-dependent increase in viscosity is originated by the presence of clusters. Our findings bring new insights on the self-assembly of monoclonal antibodies, which can be exploited for guiding the formulation of stable and effective antibody solutions.

Keywords: Monte Carlo simulations; antibodies; cluster theory; colloids; patchy models; small-angle X-ray scattering.


Conflict of interest statement

The authors declare no competing financial interest.

Figures

Figure 1
Figure 1
SLS and microrheology data. (a) Experimental ⟨Napp⟩ as a function of c for 10 mM NaCl (blue, 17 mM ionic strength) and 50 mM (red, 57 mM ionic strength) NaCl added, respectively. Also shown is a comparison with theoretical calculations (solid lines) based on a sticky hard sphere cluster model, see eqs 20–23. (b) Experimental ηr as a function of c for 10 mM NaCl (blue) and 50 mM (red) NaCl, respectively, together with the corresponding theoretical calculations (solid lines) from eq 24, where ϕHS is calculated from eq 21, γ = 3.0 and ϕg = 0.63. A comparison with predictions for monomers only where the relative viscosity is also given either by using MCT (power law with exponent γ = 2.8, dotted black line) or by the Quemada relationship for hard spheres (dashed black line).
Figure 2
Figure 2
SAXS data for different mAb concentrations and ionic strengths. Experimental I(q) as a function of q for (a) 10 mM and (b) 50 mM NaCl added. Insets show the corresponding measured structure factors Seff(q) for both solvents.
Figure 3
Figure 3
Design of the patchy model of mAbs. (a) Isosurfaces of the −1 (red) and +1 kBT (blue) electrostatic potential at pH 6.5 with 10 mM NaCl, indicating an overall positive charge for the arms (FAB domains) and a largely negative charge for the tail (FC domain). Also shown is the atomistic representation of the antibody superimposed onto the isosurface potential. (b) Simulation snapshot of the YAB model: 9 hard spheres each of diameter σ are constrained to a rigid Y shape, constituting a single mAb molecule. Each molecule is decorated with one A patch on the tail (red) and two B (blue) patches, one on each arm, mimicking the negative and positive charges, respectively. Only AB attractive interactions are considered mimicking the arm-to-tail electrostatic interactions. Furthermore, we also show the atomistic representation of the antibody. (c) Representation of the YAB model as an effective patchy hard sphere of diameter σHS as in the Wertheim theory.
Figure 4
Figure 4
(a) Cluster size distribution n(s) as a function of the cluster size s for different mAb concentrations based on the parameters from a Wertheim analysis of the SLS data for 10 mM (solid lines) and 50 mM (dashed lines) NaCl. (b) Weight-average aggregation number ⟨sw as a function of concentration for the parameters from the Wertheim analysis for 10 mM (blue line) and 50 mM (red line) NaCl.
Figure 5
Figure 5
Schematic view of the coarse-grained cluster model used to calculate the cluster form factor Pc(q). Shown are examples of mAb clusters with s = 12, 7, and 4, from simulations of rigid Ys, where each mAb monomer is modeled as a rigid Y consisting of 9 spheres (see Figure 3b), and the further coarse-grained cluster where each mAb monomer is modeled as a sphere of radius R1.
Figure 6
Figure 6
(a, b) Cluster size distribution n(s) as a function of the cluster size s calculated from simulations of the 9-bead patchy model for c = 61.7 mg/mL and for c = 147 mg/mL, respectively, compared to the corresponding hpt predictions; (c) average radius of gyration Rg for clusters of different sizes s for the same mAb concentrations as in (a, b). The two dotted lines are fits to the small and large cluster sizes with Rgs1/dF: for s ≲10, Rgs1/1.5, while for larger sizes Rg ∼ s1/2.5.
Figure 7
Figure 7
Cluster structure factors Sc(q) (eq 8) for s = 2, 4, 6, 8, 10, 12 and total structure factor Ssimeff(q) (eq 9) obtained from computer simulations for c = 61.7 mg/mL. Data are shown in simulation units (where σ is the bead size).
Figure 8
Figure 8
(a) Normalized intensity s Pc(q) for a mAb cluster with aggregation number s = 10 using the fjc model (eq 11 and b = 12 nm, black dashed line), a fractal cluster model (eqs 14 and 15 and a hard sphere structure factor with R1 = 6 nm) for different values of the internal volume fraction (Aϕ = 1.0, 0.9, 0.8, 0.7, and 0.6 (blue lines)), and the experimentally measured mAb form factor P1(q) obtained at a concentration of 4.9 mg/mL (circles). (b) The corresponding cluster structure factors Sc(q) for the same models.
Figure 9
Figure 9
(a) Comparison of the normalized cluster structure factors Sc(q) for s = 10 obtained from computer simulations for a hard 9 bead Y model at three different concentrations corresponding to c = 61.7, 102.2, and 147.3 mg/mL (blue symbols), respectively. Also shown are the results for s = 15 from simulation at c = 147.3 mg/mL (red triangles), and from the fjc model for s = 10 (blue line) and s = 15 (red line). (b) Comparison of the cluster structure factors Sc(q) obtained from computer simulations for a hard 9 bead Y model at c = 61.7 mg/mL and s = 2 (red circles), s = 3 (blue squares) and s = 4 (green triangles), together with those calculated with the fjc model for the same cluster sizes (s = 2 (red line), s = 3 (blue line), s = 4 (green line)), respectively. (c) Comparison of the cluster structure factors Sc(q) for s = 15 obtained from computer simulations for a hard 9 bead Y model at c = 147.3 mg/mL (red circles), the fjc (red solid line) and the fc models (eqs 14 and 15 and a hard sphere structure factor with R1 = 6 nm for Aϕ = 1.0) (red dashed line), respectively.
Figure 10
Figure 10
(a) Measured effective structure factor Seff(q) compared with the theoretical one, calculated following eq 25, where Sc(q) is taken as the one corresponding to the average cluster size and Sceff(q) is obtained using either the fjc (solid lines) or fc (dashed line) models for the lowest and highest mAb concentrations measured (red: 26 mg/mL, blue: 147 mg/mL). (b) Measured effective structure factor Seff(q) compared with the calculated one, where now eq 25 is generalized for polydisperse systems using eq 26, either for the fjc (solid lines) or for the fc (dashed line) model for the lowest and highest concentrations measured (red: 26 mg/mL, blue: 147 mg/mL). Data are for 10 mM added NaCl.
Figure 11
Figure 11
Measured effective structure factor Seff(q) (symbols) compared with the calculated ones based on eqs 25 and 26 using the fjc model (solid lines) for different mAb concentrations measured: (a) 10 mM NaCl (blue lines: 26, 61.7, 102.2, 147.3 mg/mL); (b) 50 mM NaCl (red lines: 19.6, 24.3, 98.3, 149.6, 208.4 mg/mL).
Figure 12
Figure 12
Measured effective structure factor Seff(q) compared with the corresponding one calculated from computer simulations (eq 9) at two mAb concentrations at 10 mM NaCl (red: 61.7 mg/mL; blue: 147.3 mg/mL). Symbols are measured experimental values, and solid lines are data from MC simulations.

Similar articles

Cited by

References

    1. Beck A.; Wurch T.; Bailly C.; Corvaia N. Strategies and challenges for the next generation of therapeutic antibodies. Nature Reviews Immunology 2010, 10, 345–352. 10.1038/nri2747. - DOI - PubMed
    1. Nelson A. L.; Dhimolea E.; Reichert J. M. Development trends for human monoclonal antibody therapeutics. Nat. Rev. Drug Discovery 2010, 9, 767–774. 10.1038/nrd3229. - DOI - PubMed
    1. Reichert J. M. Marketed therapeutic antibodies compendium. MAbs 2012, 4, 413–415. 10.4161/mabs.19931. - DOI - PMC - PubMed
    1. Lu R.-M.; Hwang Y.-C.; Liu I.-J.; Lee C.-C.; Tsai H.-Z.; Li H.-J.; Wu H.-C. Development of therapeutic antibodies for the treatment of diseases. Journal of Biomedical Science 2020, 27, 1.10.1186/s12929-019-0592-z. - DOI - PMC - PubMed
    1. Berteau C.; Filipe-Santos O.; Wang T.; Rojas H.; Granger C.; Schwarzenbach F. Evaluation of the impact of viscosity, injection volume, and injection flow rate on subcutaneous injection tolerance. Medical Devices: Evidence and Research 2015, 473.10.2147/MDER.S91019. - DOI - PMC - PubMed

Publication types