

POIROT: a powerful test for parent-of-origin effects in unrelated samples leveraging multiple phenotypes
- PMID: 37067493
- PMCID: PMC10148680
- DOI: 10.1093/bioinformatics/btad199
POIROT: a powerful test for parent-of-origin effects in unrelated samples leveraging multiple phenotypes
Abstract
Motivation: There is widespread interest in identifying genetic variants that exhibit parent-of-origin effects (POEs) wherein the effect of an allele on phenotype expression depends on its parental origin. POEs can arise from different phenomena including genomic imprinting and have been documented for many complex traits. Traditional tests for POEs require family data to determine parental origins of transmitted alleles. As most genome-wide association studies (GWAS) sample unrelated individuals (where allelic parental origin is unknown), the study of POEs in such datasets requires sophisticated statistical methods that exploit genetic patterns we anticipate observing when POEs exist. We propose a method to improve discovery of POE variants in large-scale GWAS samples that leverages potential pleiotropy among multiple correlated traits often collected in such studies. Our method compares the phenotypic covariance matrix of heterozygotes to homozygotes based on a Robust Omnibus Test. We refer to our method as the Parent of Origin Inference using Robust Omnibus Test (POIROT) of multiple quantitative traits.
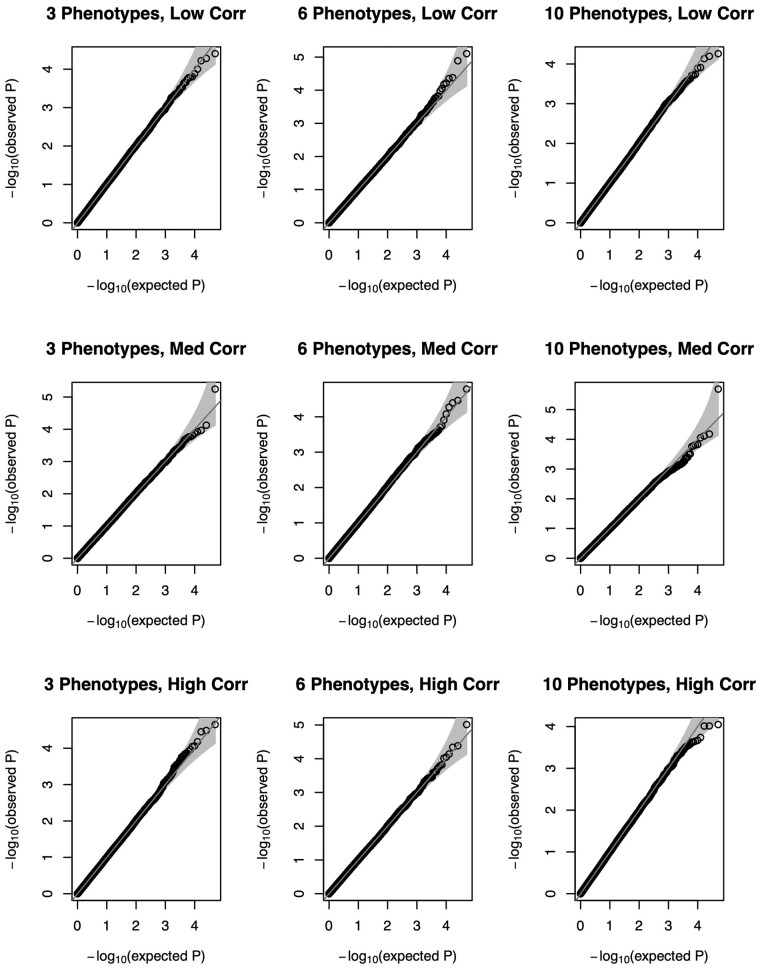
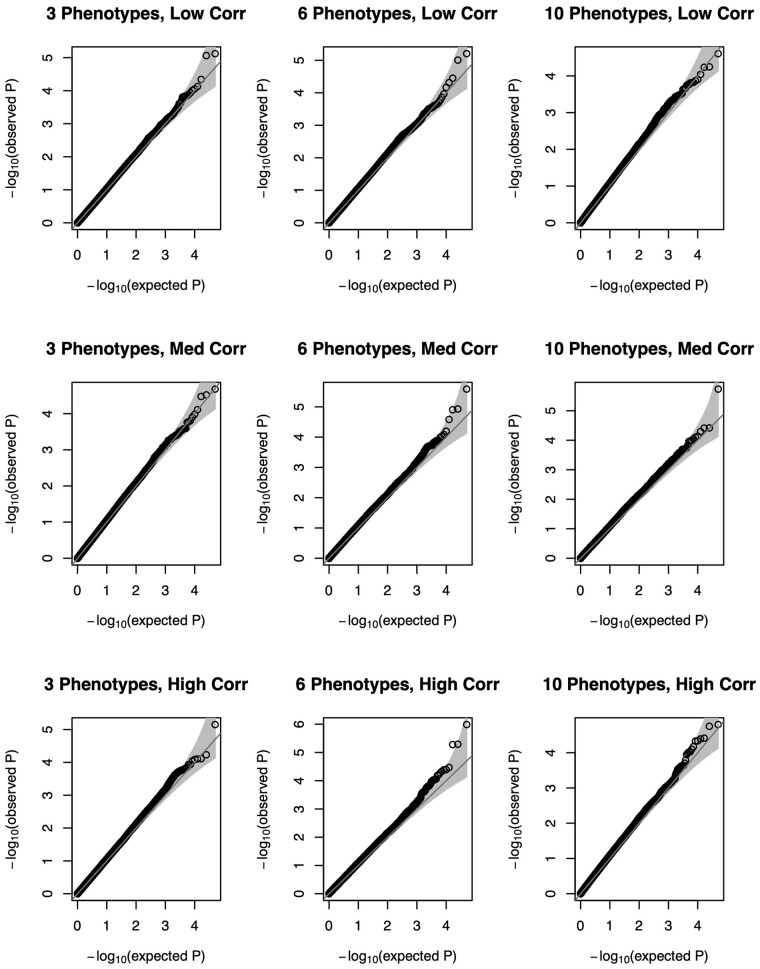
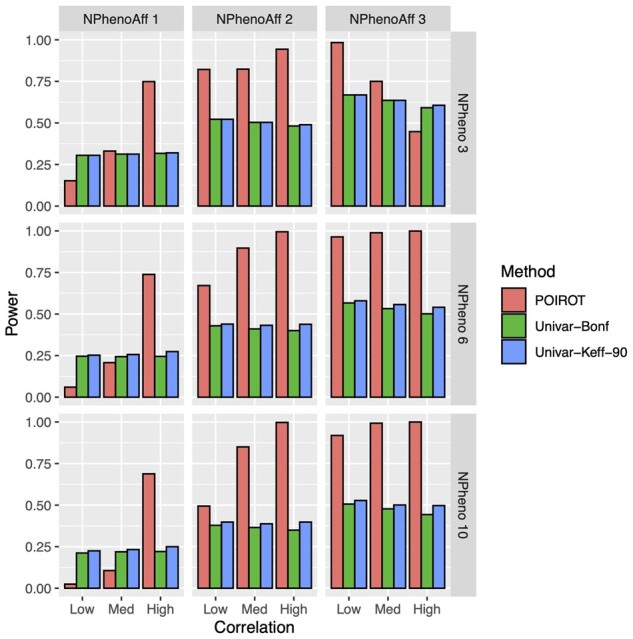
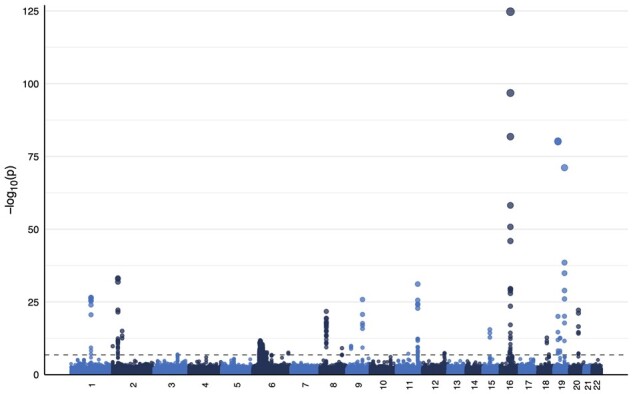
Results: Through simulation studies, we compared POIROT to a competing univariate variance-based method which considers separate analysis of each phenotype. We observed POIROT to be well-calibrated with improved power to detect POEs compared to univariate methods. POIROT is robust to non-normality of phenotypes and can adjust for population stratification and other confounders. Finally, we applied POIROT to GWAS data from the UK Biobank using BMI and two cholesterol phenotypes. We identified 338 genome-wide significant loci for follow-up investigation.
Availability and implementation: The code for this method is available at https://github.com/staylorhead/POIROT-POE.
© The Author(s) 2023. Published by Oxford University Press.
Conflict of interest statement
None declared.
Figures
Similar articles
-
Partitioning Phenotypic Variance Due to Parent-of-Origin Effects Using Genomic Relatedness Matrices.Behav Genet. 2018 Jan;48(1):67-79. doi: 10.1007/s10519-017-9880-0. Epub 2017 Nov 2. Behav Genet. 2018. PMID: 29098496 Free PMC article.
-
Searching for parent-of-origin effects on cardiometabolic traits in imprinted genomic regions.Eur J Hum Genet. 2020 May;28(5):646-655. doi: 10.1038/s41431-019-0568-1. Epub 2020 Jan 2. Eur J Hum Genet. 2020. PMID: 31896779 Free PMC article.
-
A unified framework integrating parent-of-origin effects for association study.PLoS One. 2013 Aug 26;8(8):e72208. doi: 10.1371/journal.pone.0072208. eCollection 2013. PLoS One. 2013. PMID: 23991061 Free PMC article.
-
Review of statistical methodologies for the detection of parent-of-origin effects in family trio genome-wide association data with binary disease traits.Brief Bioinform. 2015 May;16(3):429-48. doi: 10.1093/bib/bbu017. Epub 2014 Jun 5. Brief Bioinform. 2015. PMID: 24903222 Review.
-
Evidence for parent-of-origin effects in autism spectrum disorder: a narrative review.J Appl Genet. 2023 May;64(2):303-317. doi: 10.1007/s13353-022-00742-8. Epub 2023 Jan 30. J Appl Genet. 2023. PMID: 36710277 Free PMC article. Review.
Cited by
-
Identifying latent genetic interactions in genome-wide association studies using multiple traits.Genome Med. 2024 Apr 25;16(1):62. doi: 10.1186/s13073-024-01329-0. Genome Med. 2024. PMID: 38664839 Free PMC article.
-
SCAMPI: A scalable statistical framework for genome-wide interaction testing harnessing cross-trait correlations.bioRxiv [Preprint]. 2024 Sep 14:2024.09.10.612314. doi: 10.1101/2024.09.10.612314. bioRxiv. 2024. PMID: 39314278 Free PMC article. Preprint.
References
-
- Aypar U, Brodersen PR, Lundquist PA. et al. Does parent of origin matter? Methylation studies should be performed on patients with multiple copies of the Prader–Willi/Angelman syndrome critical region. Am J Med Genet 2014;164:2514–20. - PubMed
-
- Barlow DP. Genomic imprinting: a mammalian epigenetic discovery model. Annu Rev Genet 2011;45:379–403. - PubMed
-
- Becker T, Baur MP, Knapp M. et al. Detection of parent-of-origin effects in nuclear families using haplotype analysis. Hum Hered 2006;62:64–76. - PubMed
Publication types
MeSH terms
Grants and funding
LinkOut - more resources
Full Text Sources
Medical
Molecular Biology Databases
Research Materials
