. 2023 Aug;71(8):1960-1984.
doi: 10.1002/glia.24377. Epub 2023 Apr 17.

Translatome analysis reveals microglia and astrocytes to be distinct regulators of inflammation in the hyperacute and acute phases after stroke

Affiliations

Translatome analysis reveals microglia and astrocytes to be distinct regulators of inflammation in the hyperacute and acute phases after stroke

Victoria G Hernandez et al. Glia. 2023 Aug.

Abstract

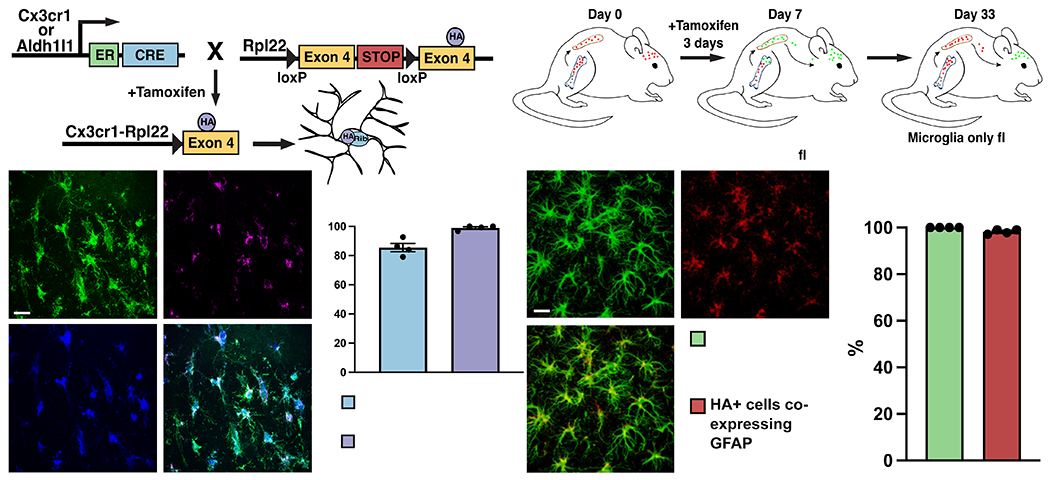
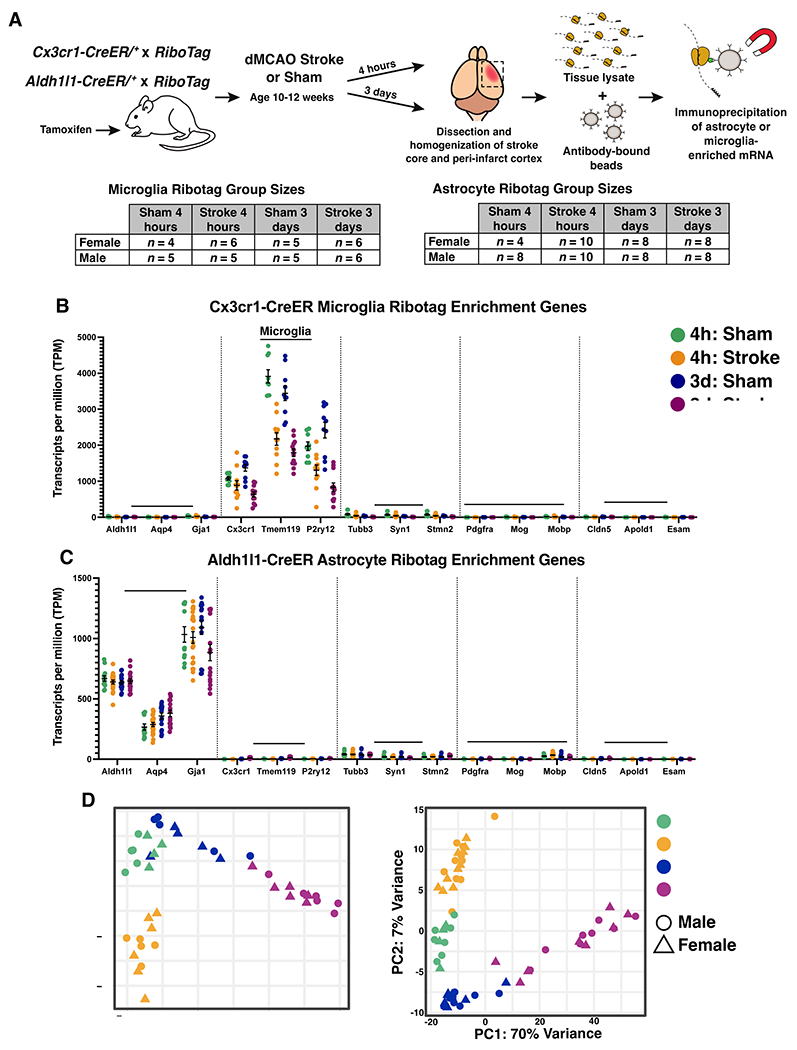
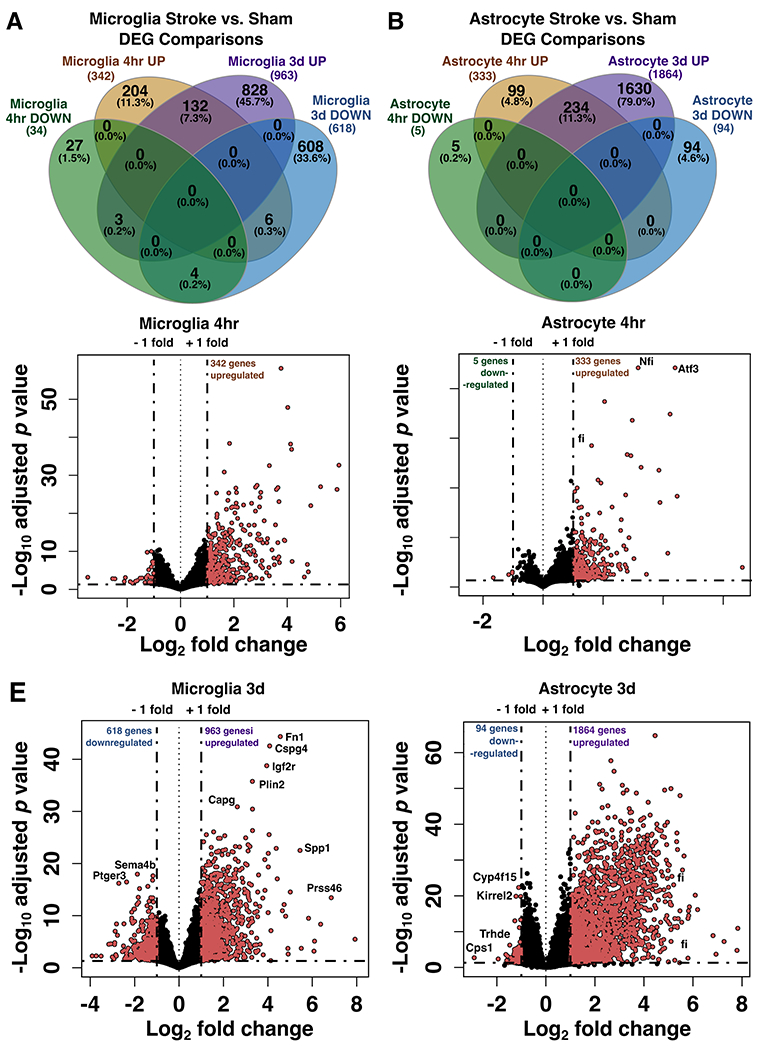
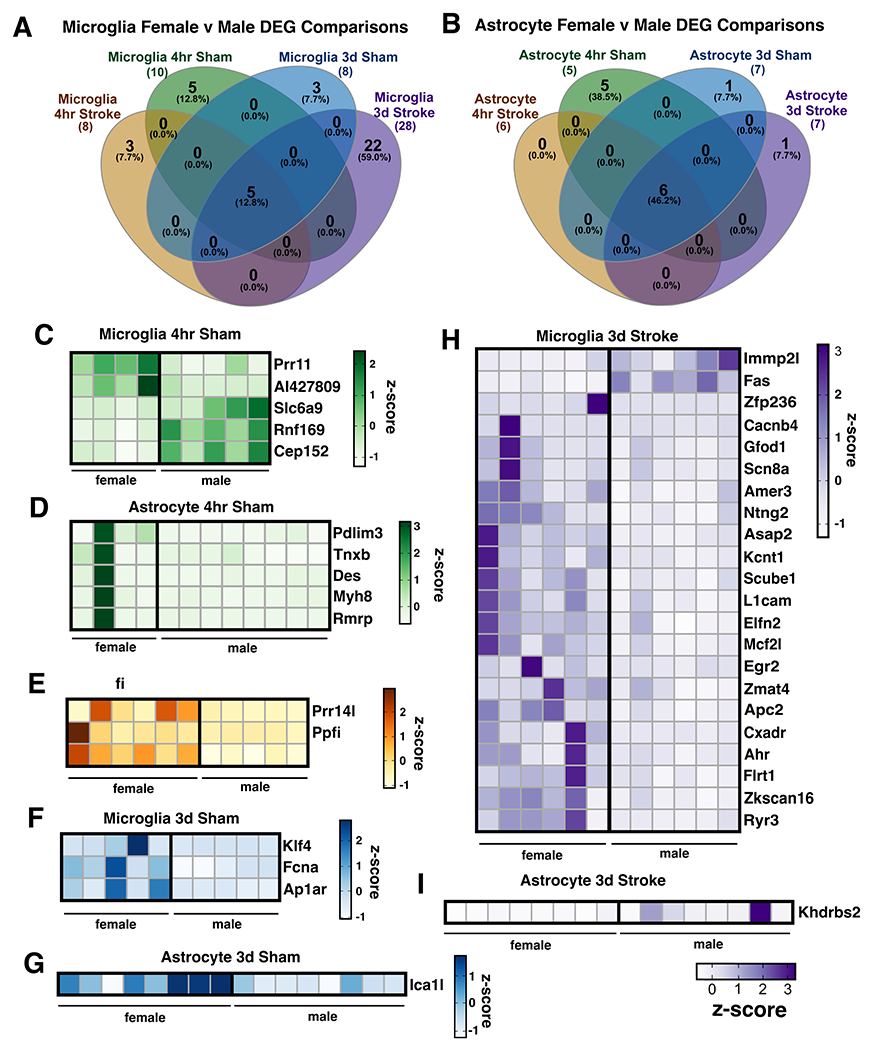
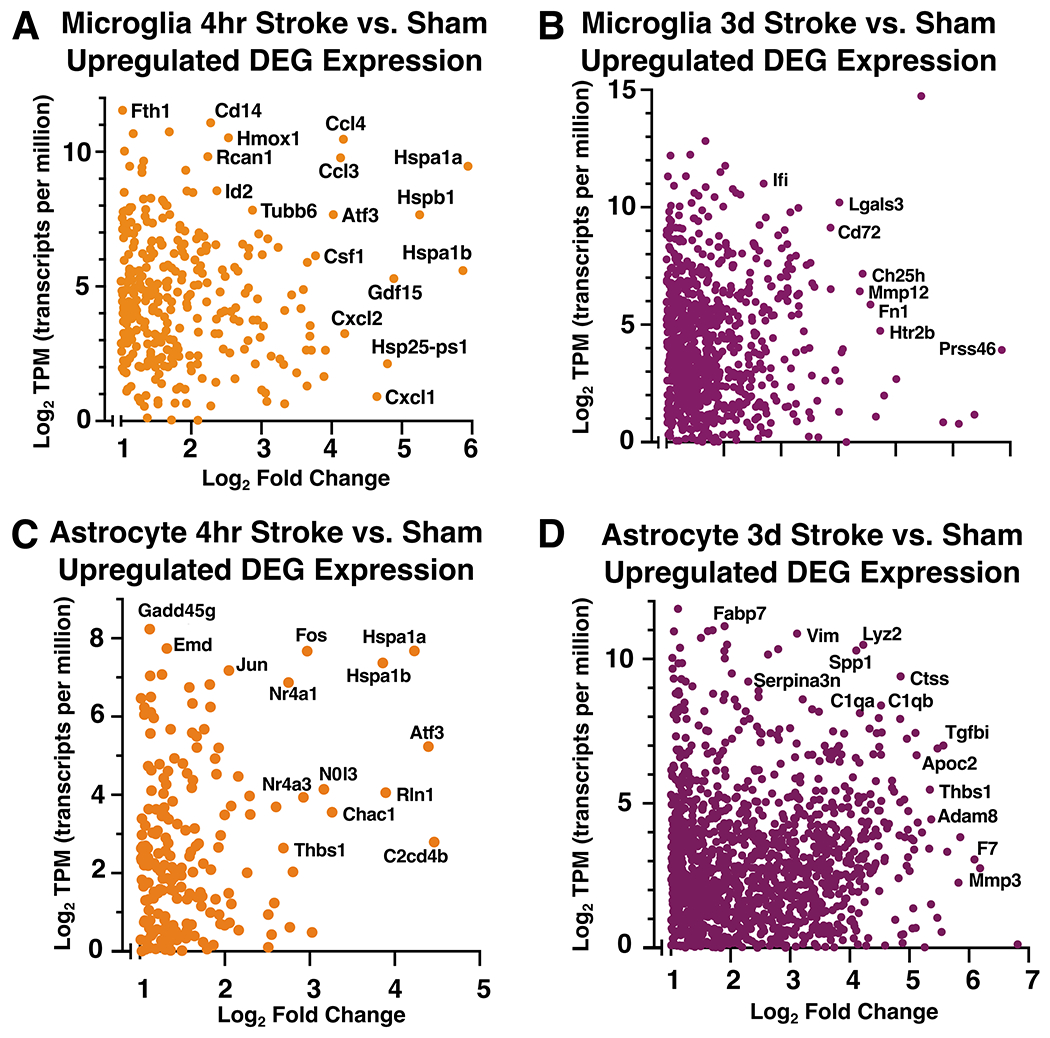
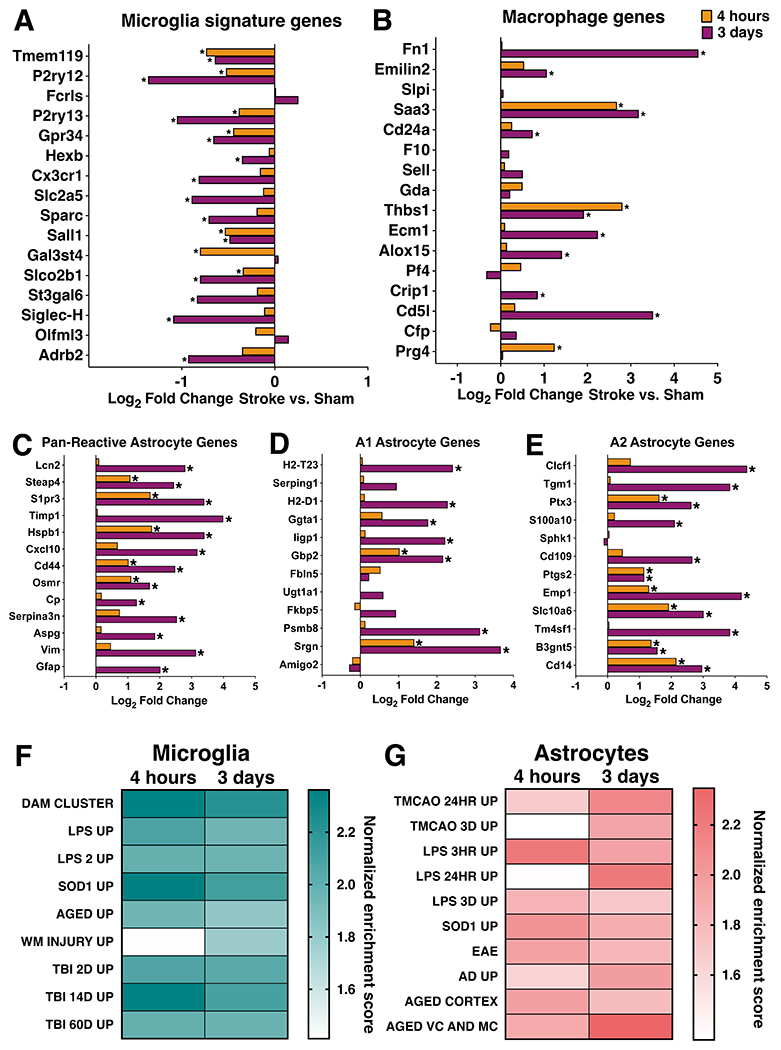
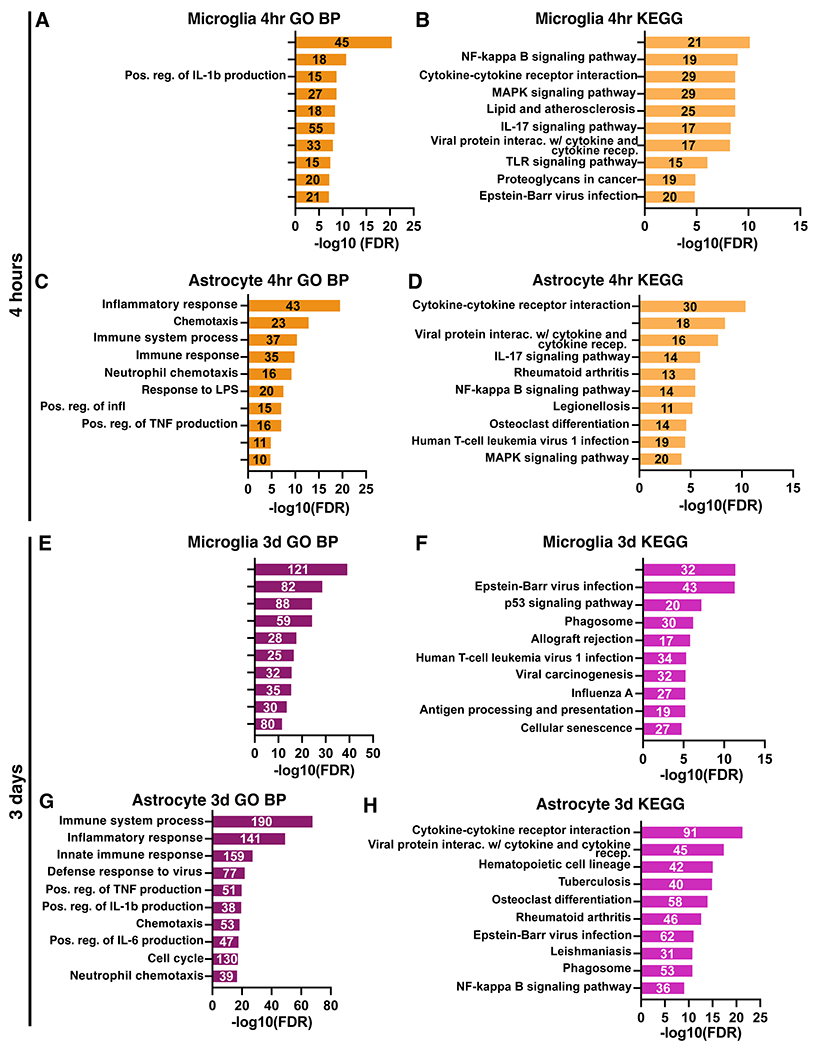
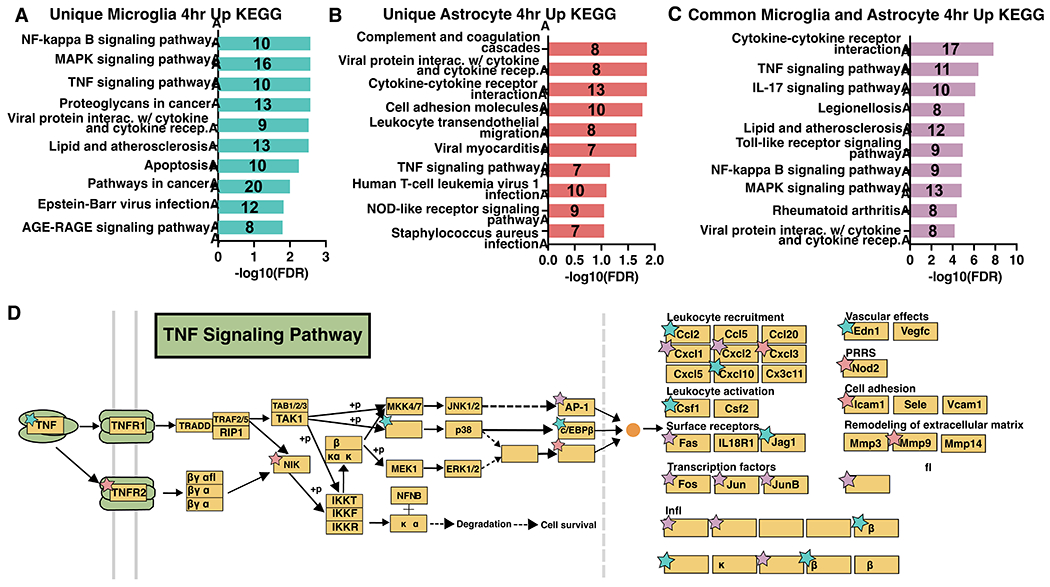
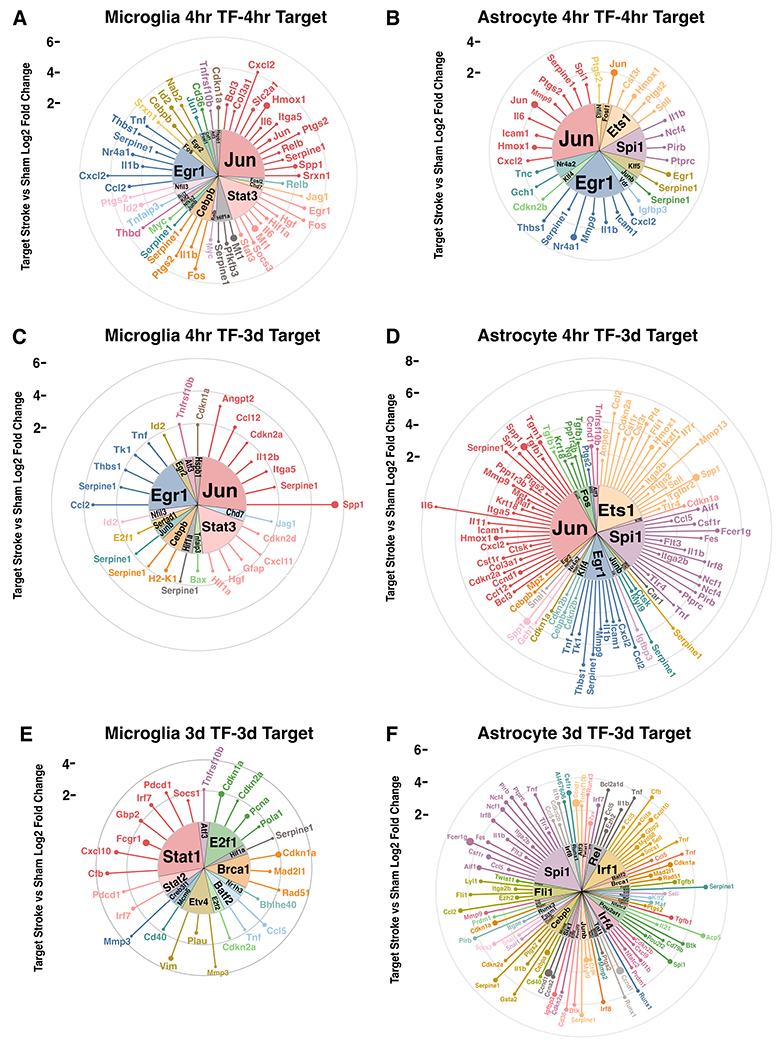
Neuroinflammation is a hallmark of ischemic stroke, which is a leading cause of death and long-term disability. Understanding the exact cellular signaling pathways that initiate and propagate neuroinflammation after stroke will be critical for developing immunomodulatory stroke therapies. In particular, the precise mechanisms of inflammatory signaling in the clinically relevant hyperacute period, hours after stroke, have not been elucidated. We used the RiboTag technique to obtain microglia and astrocyte-derived mRNA transcripts in a hyperacute (4 h) and acute (3 days) period after stroke, as these two cell types are key modulators of acute neuroinflammation. Microglia initiated a rapid response to stroke at 4 h by adopting an inflammatory profile associated with the recruitment of immune cells. The hyperacute astrocyte profile was marked by stress response genes and transcription factors, such as Fos and Jun, involved in pro-inflammatory pathways such as TNF-α. By 3 days, microglia shift to a proliferative state and astrocytes strengthen their inflammatory response. The astrocyte pro-inflammatory response at 3 days is partially driven by the upregulation of the transcription factors C/EBPβ, Spi1, and Rel, which comprise 25% of upregulated transcription factor-target interactions. Surprisingly, few sex differences across all groups were observed. Expression and log2 fold data for all sequenced genes are available on a user-friendly website for researchers to examine gene changes and generate hypotheses for stroke targets. Taken together, our data comprehensively describe the microglia and astrocyte-specific translatome response in the hyperacute and acute period after stroke and identify pathways critical for initiating neuroinflammation.

Keywords: RNASeq; ShinyApp; glia; inflammation; transcription factor.


Conflict of interest statement

Conflict of interest statement: The authors declare no competing financial interests.

Figures

Figure 1.
Figure 1.. Characterization of microglia and astrocyte-RiboTag mice for isolation of microglial or astrocytic RNA after stroke.
(A) Strategy for breeding and inducing Microglia-RiboTag (Cx3cr1CreER2-IRES-eYFP/+;Rpl22HA+/+) and Astrocyte-RiboTag (Aldh1l1/+;Rpl22HA+/+) mice. (B) Strategy for isolating microglia from peripheral cells in Microglia-RiboTag mice. (C) Representative immunofluorescence images for HA and microglia-specific markers taken in cortex of Microglia-RiboTag mice 3 days after dMCAO stroke. (D) Quantification of the specificity of HA by microglia and efficiency of recombination in Microglia-RiboTag mice. (99.0% +/− 0.8%, n = 3-4). Recombination occurred in the majority of Cx3cr1+ cells quantified, and after stroke, 85.6% ± 2.8% Cx3cr1+ cells were HA+ (n = 4). 150 Iba1+ cells per mouse. Scale bar = 20 μm. (E) Representative immunofluorescence images for HA and astrocyte-specific marker taken in cortex of Astrocyte-RiboTag mice 3 days after dMCAO stroke. (F) Quantification of the specificity of HA by astrocytes and efficiency of recombination in Astrocyte-RiboTag mice. Almost all HA+ cells co-expressed GFAP in stroke condition (100% +/− 0%, n = 4). Recombination occurred in the majority of GFAP+ cells quantified, after stroke, 98.2% ± 0.47% GFAP+ cells were HA+ (n = 4). 100 GFAP+ cells per mouse. Scale bar, 20 μm; Error Bars, SEM.
Figure 2.
Figure 2.. Isolation and sequencing of microglia and astrocyte-enriched mRNA at multiple time points after ischemic stroke.
(A) Schematic depicting the experimental strategy for isolating actively translating microglial or astrocyte RNA at multiple time points after ischemic stroke, and number of biological replicates used for RNA-sequencing. All adult mice (10-12 weeks old at time of surgery) received tamoxifen prior to stroke or sham. Microglia-RiboTag mice received tamoxifen 3 days p.o. 30 days before surgery. Astrocyte-RiboTag mice received tamoxifen 5 days p.o. 8 days before surgery. Mean TPM values indicating that (B) microglia-IP samples are enriched in microglia-specific genes, (C) Astrocyte-IP samples are enriched in astrocyte-specific genes, and (B, C) de-enriched for cell-specific markers for other brain cell types. Bars, ± SEM. (D) Principal component analysis (PCA) of log-transformed RNA-seq data from 4 hour and 3 day stroke and sham microglia-IP samples (n = 9-12 mice per group). (E) Principal component analysis (PCA) of log-transformed RNA-seq data from 4 hour and 3 day stroke and sham astrocyte-IP samples (n = 12-20 mice per group).
Figure 3.
Figure 3.. Differential gene expression analysis of microglial and astrocyte transcripts at two time points after stroke.
Venn diagrams showing the number of unique and shared differentially expressed genes between stroke versus sham at 4 hours and 3 days in microglia (A) and astrocytes (B), separated by up- and down-regulated genes (p-adj < 0.05; |Log2FC| > 1). (C-F) Volcano plots showing changes in microglial and astrocyte gene expression 4 hours (C, D) or 3 days (E, F) after stroke. Pink points indicate genes which passed a differential expression cutoff of p-adj < 0.05 and |Log2FC| > 1. Genes with the largest changes in expression level are labeled. Horizontal dashed line marks adjusted p value = 0.05; DEG, differentially expressed genes.
Figure 4.
Figure 4.. Sex differences in the microglia and astrocyte translatomes after ischemic stroke.
Number of differentially expressed genes (p-adj < 0.05; |Log2FC| > 1) between males and females at 4 hours or 3 days after stroke or sham surgery in (A) microglia-IP samples and (B) astrocyte-IP samples. Heatmaps depict expression levels of significantly different genes between female and male mice unique to 4 hours after dMCAO sham (C, D) or stroke surgery (E) and 3 days after dMCAO sham (F, G) or stroke surgery (H, I). Sex-linked genes differentially expressed by sex across all conditions were excluded from heatmaps (Uba1y, Ddx3y, Kdm5d, Eif2s3y, Uty, Xist). z-scores were calculated from TPM normalized gene expression values. DEG, differentially expressed genes.
Figure 5.
Figure 5.. The microglia and astrocyte translatomes reflect distinct functions during the hyperacute and acute phases of neuroinflammation after ischemic stroke.
(A, B) Scatter plots for microglia-IP (A, B) and astrocyte-IP (C, D) log2 mean normalized expression values (TPM) and log2 fold change for each significantly upregulated differentially expressed gene at 4 hours (A, C) and 3 days (B, D) after stroke compared to sham. TPM values used for this representation are the mean TPM for each gene across all samples within respective 4 hour and 3 day stroke groups. Highly expressed and/or differentially genes are labeled. Genes with TPM <1 were excluded.
Figure 6.
Figure 6.. Comparisons to other glial states and disease models.
Log2 fold change in microglial (A, B) and astrocyte (C-E) gene expression in stroke versus sham samples at 4 hours and 3 days after dMCAO stroke for select microglial signature genes (A), select macrophage marker genes (B), pan-reactive astrocyte genes (C), A1 neurotoxic genes (D), and A2 neurotrophic genes (E). Gene set enrichment analysis results comparing microglial (F) and astrocyte (G) gene expression at 4 hours and 3 days after stroke to published datasets of microglia and astrocyte reactivity in various disease and injury states. Darker color indicates higher normalized enrichment score for each comparison. All datasets were significantly enriched in respective post-stroke glial transcript lists from both timepoints, except white matter injury (WM Injury Up) and LPS after 24 hours (LPS 24hr Up), using an FDR <25%. Table 1 lists references for gene set sources. *adj p < 0.05.
Figure 7.
Figure 7.. Enriched microglial and astrocyte processes and pathways at 4 hours and 3 days after stroke.
Gene ontology analysis results for the top significantly enriched Biological Processes (left) and KEGG pathways (right) for microglia and astrocyte genes upregulated at 4 hours (A-D) and 3 days (E-G) after stroke. GO terms are labeled on the y-axis, and the number of genes from each list found in the datasets are indicated on the respective bar in the plots.
Figure 8.
Figure 8.. Microglia initiate an early pro-inflammatory response through TNF signaling that is propagated by astrocytes at 4 hours after stroke.
KEGG Pathways analysis results for genes upregulated 4 hours after stroke and unique to microglia (A) or astrocytes (B), or common to both (C). GO terms are labeled on the y-axis, and the number of genes from each list found in the datasets are indicated on the respective bar in the plots. (D) KEGG TNF signaling pathway schematic, adapted from Kanehisa Laboratories (Kanehisa and Goto 2000), with stars denoting unique enriched upregulated genes in microglia (blue), astrocytes (pink), and shared common (purple) at 4 hours after stroke.
Figure 9.
Figure 9.. Microglia and astrocytes differentially regulate transcription at the hyperacute and acute period after stroke.
Circular lollipop plots illustrating upregulated transcription factors and their upregulated targets at 4 hours and 3 days. Upregulated transcription factor-target relationships were analyzed for 4 hour transcription factors and 4 hour targets (A, B), 4 hour transcription factors and 3 day targets (C, D), and 3 day transcription factors and 3 day targets (E, F). Inner wedges represent the upregulated transcription factors, while each line represents its upregulated target. Length of each line indicates the log2 fold change of the target in stroke versus sham, while the size of the circle at the end of line indicates the TPM of the target.

Update of

References

    1. Akira S, Isshiki H, Sugita T, Tanabe O, Kinoshita S, Nishio Y, Nakajima T, Hirano T, and Kishimoto T. 1990. “A Nuclear Factor for IL-6 Expression (NF-IL6) Is a Member of a C/EBP Family.” The EMBO Journal 9 (6): 1897–1906. - PMC - PubMed
    1. Aleyasin Hossein, Cregan Sean P., Iyirhiaro Grace, O’Hare Michael J., Callaghan Steve M., Slack Ruth S., and Park David S.. 2004. “Nuclear Factor-(kappa)B Modulates the p53 Response in Neurons Exposed to DNA Damage.” The Journal of Neuroscience: The Official Journal of the Society for Neuroscience 24 (12): 2963–73. - PMC - PubMed
    1. Anderson Mark A., Burda Joshua E., Ren Yilong, Ao Yan, O’Shea Timothy M., Kawaguchi Riki, Coppola Giovanni, Khakh Baljit S., Deming Timothy J., and Sofroniew Michael V.. 2016. “Astrocyte Scar Formation Aids Central Nervous System Axon Regeneration.” Nature 532 (7598): 195–200. - PMC - PubMed
    1. Anderson Mark A., O’Shea Timothy M., Burda Joshua E., Ao Yan, Barlatey Sabry L., Bernstein Alexander M., Kim Jae H., et al. 2018. “Required Growth Facilitators Propel Axon Regeneration across Complete Spinal Cord Injury.” Nature 561 (7723): 396–400. - PMC - PubMed
    1. Arbaizar-Rovirosa Maria, Pedragosa Jordi, Lozano Juan J., Casal Carme, Pol Albert, Gallizioli Mattia, and Planas Anna M.. 2023. “Aged Lipid-Laden Microglia Display Impaired Responses to Stroke.” EMBO Molecular Medicine 15 (2): e17175. - PMC - PubMed

Publication types

Substances