

HIF1α-dependent and independent pathways regulate the expression of PD-L1 in prostate cancer
- PMID: 37067635
- PMCID: PMC10110727
- DOI: 10.1007/s12032-023-02017-6
HIF1α-dependent and independent pathways regulate the expression of PD-L1 in prostate cancer
Abstract
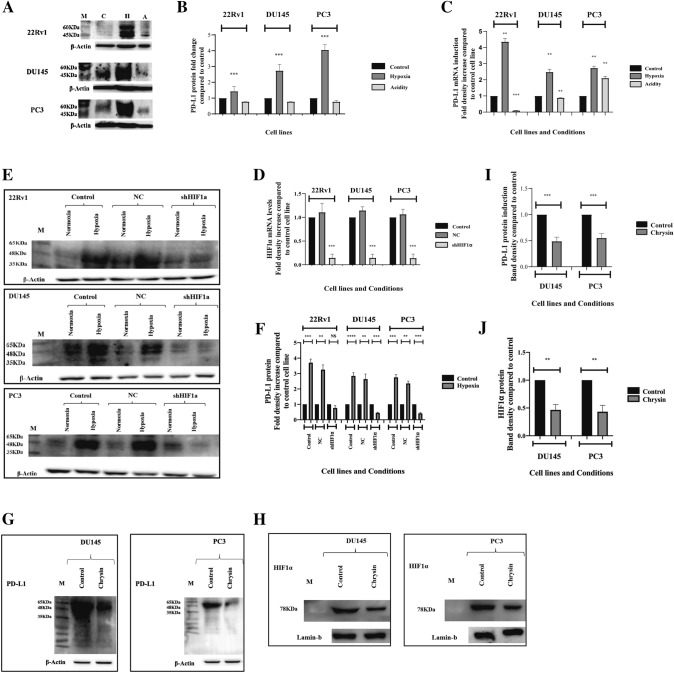
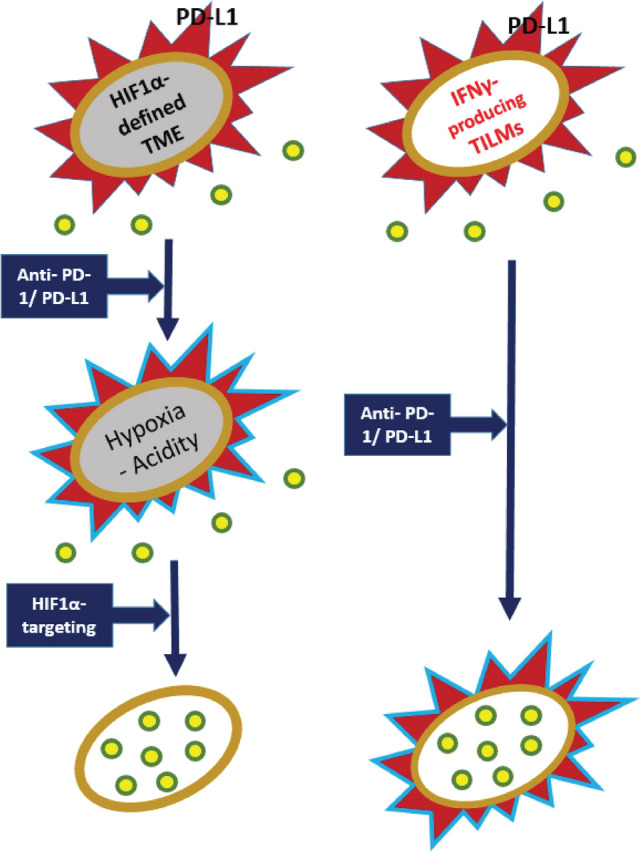
PD-L1/PD-1 pathway is a major pathway exploited by human cancer types, which is a target for current immunotherapy. We investigated tumor microenvironmental factors involved in PD-L1 induction in prostate cancer (PC). We studied the expression of PD-L1 in a series of 66 PCs, in parallel with the expression of hypoxia- and acidity-related immunohistochemical markers (Hypoxia-inducible factor HIF1α, and lactate dehydrogenase LDHA) and tumor-infiltrating lymphocyte TIL density. Experiments with three PC cell lines, the 22Rv1, DU145, and PC3 were conducted focusing on the inducibility of PD-L1 by hypoxia, acidity, lymphocyte interactions, and radiation. In tissues, PD-L1 expression by cancer cells was directly related to PD-L1 expression by TILs and macrophages (p < 0.05), and the overexpression of HIF1α and LDH5 (p < 0.05). TIL density was inversely related to ΗΙF1α (p = 0.02). Exposure of PC cell lines to hypoxia strongly induced PD-L1 and protein and mRNA levels, directly controlled by HIF1α function (p < 0.001). Irradiation with 20 Gy had no apparent effect on PD-L1 expression. Culturing PC cell lines with culture medium (CM) from PBMCs strongly induced PD-L1 at protein and mRNA levels, independently from HIF1α, which was also confirmed when cells were incubated with Interferon-γ (p < 0.001). It is concluded that the combination of anti-PD-L1/PD-1 immunotherapy with hypoxia/HIF-targeting may be important in the treatment of specific subgroups of PC patients.
Keywords: HIF1α; Hypoxia; IFNγ; PD-L1; Prostate cancer; Radiotherapy.
© 2023. The Author(s).
Conflict of interest statement
There are no conflicts of interest to declare.
Figures


Similar articles
-
Ectonucleotidase CD73 and CD39 expression in non-small cell lung cancer relates to hypoxia and immunosuppressive pathways.Life Sci. 2020 Oct 15;259:118389. doi: 10.1016/j.lfs.2020.118389. Epub 2020 Sep 6. Life Sci. 2020. PMID: 32898522
-
LAG-3 Protein Expression in Non-Small Cell Lung Cancer and Its Relationship with PD-1/PD-L1 and Tumor-Infiltrating Lymphocytes.J Thorac Oncol. 2017 May;12(5):814-823. doi: 10.1016/j.jtho.2017.01.019. Epub 2017 Jan 26. J Thorac Oncol. 2017. PMID: 28132868
-
PD-1, PD-L1 Protein Expression in Non-Small Cell Lung Cancer and Their Relationship with Tumor-Infiltrating Lymphocytes.Med Sci Monit. 2017 Mar 9;23:1208-1216. doi: 10.12659/msm.899909. Med Sci Monit. 2017. PMID: 28275222 Free PMC article.
-
The roles of PD-1/PD-L1 in the prognosis and immunotherapy of prostate cancer.Mol Ther. 2021 Jun 2;29(6):1958-1969. doi: 10.1016/j.ymthe.2021.04.029. Epub 2021 Apr 29. Mol Ther. 2021. PMID: 33932597 Free PMC article. Review.
-
Programmed death-ligand 1 expression in non-small cell lung carcinoma - mechanism of regulation, association with other markers, and therapeutic implication.Klin Onkol. 2022 Fall;35(5):372-376. doi: 10.48095/ccko2022372. Klin Onkol. 2022. PMID: 36443097 Review. English.
Cited by
-
Exploring the role of the inflammasomes on prostate cancer: Interplay with obesity.Rev Endocr Metab Disord. 2023 Dec;24(6):1165-1187. doi: 10.1007/s11154-023-09838-w. Epub 2023 Oct 11. Rev Endocr Metab Disord. 2023. PMID: 37819510 Free PMC article. Review.
-
Oncogenic Mutations and the Tumor Microenvironment: Drivers of Non-Small Cell Lung Cancer Progression.Cancers (Basel). 2025 Mar 1;17(5):853. doi: 10.3390/cancers17050853. Cancers (Basel). 2025. PMID: 40075700 Free PMC article. Review.
-
Prognostic Value of PlGF Upregulation in Prostate Cancer.Biomedicines. 2024 Sep 26;12(10):2194. doi: 10.3390/biomedicines12102194. Biomedicines. 2024. PMID: 39457506 Free PMC article.
References
MeSH terms
Substances
Grants and funding
LinkOut - more resources
Full Text Sources
Medical
Research Materials
Miscellaneous
