. 2023 Jul 3;192(3):2123-2142.
doi: 10.1093/plphys/kiad226.

SnRK1 kinase-mediated phosphorylation of transcription factor bZIP39 regulates sorbitol metabolism in apple

Affiliations

SnRK1 kinase-mediated phosphorylation of transcription factor bZIP39 regulates sorbitol metabolism in apple

Dong Meng et al. Plant Physiol. .

Abstract

Sorbitol is a major photosynthate produced in leaves and transported through the phloem of apple (Malus domestica) and other tree fruits in Rosaceae. Sorbitol stimulates its own metabolism, but the underlying molecular mechanism remains unknown. Here, we show that sucrose nonfermenting 1 (SNF1)-related protein kinase 1 (SnRK1) is involved in regulating the sorbitol-responsive expression of both SORBITOL DEHYDROGENASE 1 (SDH1) and ALDOSE-6-PHOSPHATE REDUCTASE (A6PR), encoding 2 key enzymes in sorbitol metabolism. SnRK1 expression is increased by feeding of exogenous sorbitol but decreased by sucrose. SnRK1 interacts with and phosphorylates the basic leucine zipper (bZIP) transcription factor bZIP39. bZIP39 binds to the promoters of both SDH1 and A6PR and activates their expression. Overexpression of SnRK1 in 'Royal Gala' apple increases its protein level and activity, upregulating transcript levels of both SDH1 and A6PR without altering the expression of bZIP39. Of all the sugars tested, sorbitol is the only 1 that stimulates SDH1 and A6PR expression, and this stimulation is blocked by RNA interference (RNAi)-induced repression of either SnRK1 or bZIP39. These findings reveal that sorbitol acts as a signal regulating its own metabolism via SnRK1-mediated phosphorylation of bZIP39, which integrates sorbitol signaling into the SnRK1-mediated sugar signaling network to modulate plant carbohydrate metabolism.


Conflict of interest statement

Conflict of interest statement. The authors declare no conflicts of interest.

Figures

Figure 1.
Figure 1.
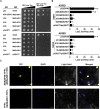
Expression of MdSnRK1, MdSDH1, and MdSDH2 in response to sorbitol/sucrose feeding and verification of transcription factors interacting with the promoters of MdSDH1 and MdSDH2 via Y1H assay. A) Concentrations of sorbitol and sucrose in the leaves of WT and 2 antisense A6PR lines (A4 and A10) of ‘Greensleeves’ apple in response to sorbitol (50 mM) or sucrose (50 mM) feeding via the petiole for 3 h. B) Expression levels of MdSnRK1, MdSDH1, and MdSDH2 under sorbitol and sucrose feeding treatments, respectively. In both A) and B), data are the mean ± Sd of 3 biological replicates, with 10 leaves from 5 shoots per replicate. Lsd was used for significant difference at P < 0.05 after ANOVA. Different letters (a to g) represent significant differences between groups. C) Diagram showing the Y1H screening of an apple cDNA library using the promoters of SDH1 and SDH2. D) Verification of the interactions between 4 candidate transcription factors selected from each Y1H screening and the promoters of SDH1 and SDH2 via Y1H, respectively. SD-Trp-Leu, synthetic dextrose medium lacking tryptophan and leucine; SD/-Trp-Leu-His, synthetic dextrose medium lacking tryptophan, leucine, and histidine; 3-AT, 3-amino triazole. Triangles represent the range of yeast concentrations. Each colony was diluted from 1 to 10−2.
Figure 2.
Figure 2.
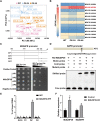
Y2H and BiFC assays of the interaction between MdSnRK1 and MdbZIP39. A) Y2H assay of the interaction of MdSnRK1 with MdbZIP39 and other candidate transcription factors. The pair AD-p53 and BD-SV40 was used as a positive control; the pair AD-pGADT7 and BD-pGBKT7 was used as a negative control. AD, activation domain; BD, binding domain; SD-Leu-Trp, synthetic dextrose medium lacking leucine and tryptophan; SD/-Trp-Leu-His-Ade, synthetic dextrose medium lacking leucine, tryptophan, histidine, and adenine. Triangles represent the range of yeast concentrations. Each colony was diluted in 10 µL sterile water and then diluted to 10−1 to 10−3. At least 3 colonies were tested for each combination. B) Activity statistics of the reporter enzyme, β-galactosidase (LacZ), in the Y2H experiments. Miller units of LacZ activity were calculated as 1,000 × OD420nm/(volume × time × OD600nm). Different letters (a to c) represent significant differences between groups. Data are the mean ± Sd of 3 biological replicates with 1 colony per replicate. Lsd was used for significant difference at P < 0.05 after ANOVA. C) BiFC assay of the interaction between MdSnRK1 and MdbZIP39 in leaves of N. benthamiana. MdSnRK1 and MdbZIP39 were introduced into the pSPYNE and pSPYCE vectors and fused to N-terminal and C-terminal YFP, respectively. YFPc + MdSnRK1-YFPn was used as a negative control. DAPI, 4′,6-diamidino-2-phenylindole. Bars = 25 µm.
Figure 3.
Figure 3.
MdSnRK1 phosphorylates MdbZIP39. A) Phosphorylation activity of MdSnRK1 measured as decrease in relative fluorescence. Among the 10 groups listed, all proteins involved were obtained after prokaryotic expression and purification. His-MdbZIP39S41A has the serine mutated to alanine at position 41 based on the predicted phosphorylation sites and DNA-binding site (Supplemental Fig. S2), whereas His-MdbZIP39X denotes the deactivated His-MdbZIP39 by boiling at 100 °C for 10 min. Different letters (a to d) indicate a significant difference between treatment groups and the control (phosphorylation reaction buffer only). Data are means ± Sd (n = 3) with measurements made in duplicate. Lsd was used for significant difference at P < 0.05 after ANOVA. B) Ser/Thr antibody detects phosphorylation of MdbZIP39 as well as MdSnRK1 by MdSnRK1. Proteins labeled with the circled “P” refer to their phosphorylated forms.
Figure 4.
Figure 4.
Binding of MdbZIP39 to the promoter of MdSDH1 and transcriptional activation of MdSDH1. A) Subcellular localization of MdbZIP39 in apple leaves. Bars = 50 µm. B) Y1H assay on binding of MdbZIP39 protein to the promoter of MdSDH1. Numbers indicate nucleotide positions for different regions (SP1, SP2, SP3, and SP4) upstream of the MdSDH1 coding sequence with the first nucleotide of its start codon designated as 0; the short vertical line denotes the binding motif ACGT at −384. SD-Trp-Leu, synthetic dextrose medium lacking tryptophan and leucine; SD/-Trp-Leu-His, synthetic dextrose medium lacking tryptophan, leucine, and histidine; 3-AT, 3-amino triazole. Triangles represent the range of yeast concentrations. Each colony was diluted from 1 to 10−2. pGADT7-p53 + pHis2-p53 was used as a positive control and pGADT7 + pHis2-p53 as a negative control. C) EMSA on the specific binding of MdbZIP39 protein to the motif ACGT in the MdSDH1 promoter. The biotin-labeled probe was designed to target the ACGT motif; mutant probe has the ACGT motif mutated to GTTC. The amount of cold probes was 10 and 40 times higher than that of the labeled probe. D) ChIP-qPCR analysis of MdbZIP39 binding to the promoter of MdSDH1. S1–S3 represent different primers targeting the various regions of the MdSDH1 promoter (Supplemental Table S6). ACTIN was used as an internal reference. Data were means ± Sd (n = 3) with calli from 1 petri dish per replicate. Lsd was used for significant difference at P < 0.01 after ANOVA. E) The relative expression levels of MdbZIP39 and MdSDH1 in response to MdbZIP39-OE via agroinfiltration to leaves, with empty vector as control. Data are means ± Sd (n = 3) with 10 leaves from 5 shoots per replicate. Lsd was used for significant difference at P < 0.05 after ANOVA. In both D) and E), different letters (a to b) represent significant differences between groups.
Figure 5.
Figure 5.
Transcriptomic analysis of MdSnRK1-OE lines and assays on the binding of MdbZIP39 protein to the promoter of MdA6PR. A) PCA of shoot tip transcriptomes of WT and 2 MdSnRK1-GFP OE lines (OE-24 and OE-46) of ‘Royal Gala’ apple, with 5 biological replicates each. B) Expression levels of MdA6PR homologs in transcriptome of WT, OE-24, and OE-46. Transcript levels are presented as the average of RPKM values of 5 biological replicates in the heat map. C) Y1H assay on binding of MdbZIP39 protein to the promoter of MdA6PR. Numbers indicate nucleotide positions for different regions (AP1, AP2, AP3, and AP4) upstream of the MdA6PR coding sequence with the first nucleotide of its start codon designated as 0; the short vertical line denotes the binding motif ACGTAC at −254. SD-Trp-Leu, synthetic dextrose medium lacking tryptophan and leucine; SD/-Trp-Leu-His, synthetic dextrose medium lacking tryptophan, leucine, and histidine; 3-AT, 3-amino triazole. Triangles represent the range of yeast concentrations. Each colony was diluted from 1 to 10−2. pGADT7-p53 + pHis2-p53 was used as a positive control and pGADT7 + pHis2-p53 as a negative control. D) EMSA on the specific binding of MdbZIP39 protein to the motif ACGTAC (indicated by the arrow) in the MdA6PR promoter. The biotin-labelled probe was designed to target the ACGTAC motif; mutant probe has the ACGTAC motif mutated to GTTCAC. The amount of cold probes was 10 and 40 times higher than that of the labeled probe. E) ChIP-qPCR analysis of MdbZIP39 binding to the promoter of MdA6PR. A1 to A3 represent different primers targeting the various regions of the MdA6PR promoter (Supplemental Table S6), and the A2 region contains the motif ACGTAC. ACTIN was used as an internal reference. Data were means ± Sd (n = 3) with calli from 1 petri dish per replicate. F) The relative expression levels of MdbZIP39 and MdA6PR in response to MdbZIP39-OE via agroinfiltration to leaves, with empty vector as control. Data were means ± Sd (n = 3) with 10 leaves from 5 shoots per replicate. Lsd was used for significant difference at P < 0.05 after ANOVA. Different letters (a to b) represent significant differences between groups.
Figure 6.
Figure 6.
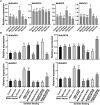
Upregulation of the transcript levels of MdSDH1 and MdA6PR and their activities by OE of MdSnRK1. A) Immunoblot analysis of MdSnRK1 protein in the shoot tips of WT and 2 MdSnRK1-GFP OE lines (OE-24 and OE-46) of ‘Royal Gala’ apple plants. Sigma anti-GFP and anti-AtKIN10 were used in 1:2,000 dilution, and gel was stained with Coomasie blue. CBB, Coomasie brilliant blue. B) SnRK1 activity in the shoot tips of OE-24 and OE-46 relative to WT. C) Relative expression levels of MdSnRK1, MdbZIP39, MdSDH1, MdSDH2, and MdA6PR in WT, OE-24, and OE-46 lines. D) Enzyme activities of SDH and A6PR in the shoot tips of WT, OE-24, and OE-46 lines. E) Concentrations of sorbitol and sucrose in the shoot tips of WT, OE-24, and OE-46 lines. From B) to E), data were means ± Sd (n = 5) with 5 shoot tips per replicate. Lsd was used for significant difference analysis at P < 0.05 after ANOVA. Different letters (a to b) represent significant differences between groups.
Figure 7.
Figure 7.
Stimulation of MdSDH1 and MdA6PR expression by sorbitol and its dependence on MdSnRK1 and MdbZIP39. A) Relative expression levels of MdSnRK1, MdbZIP39, MdA6PR, and MdSDH1 genes in shoots of ‘Royal Gala’ in response to 50 mM mannitol, fructose, sorbitol, glucose, or sucrose in the medium for 12 h, with no sugar as control. B) Relative expression levels of MdSnRK1, MdbZIP39, MdSDH1, and MdA6PR in shoots of ‘Royal Gala’ in response to OE or suppression (RNAi) of MdSnRK1 and MdbZIP39 alone or in combination via agroinfiltration for 3 d, followed by sorbitol feeding for 12 h. Empty vector agroinfiltration followed by no sugar, 50 mM mannitol, or 50 mM glucose feeding serves as additional controls. In both A) and B), data were means ± Sd (n = 5) with 6 shoots per replicate. Lsd was used for significant difference analysis at P < 0.05 after ANOVA. Different letters (a to d) represent significant differences between groups.
Figure 8.
Figure 8.
Model of MdSnRK1-mediated phosphorylation of MdbZIP39 as a mechanism for sorbitol modulation of its own metabolism. Sorbitol is synthesized via a 2-step process in leaves: reduction of G6P by A6PR to sorbitol-6-phosphate (Sor6P) and subsequent dephosphorylation of Sor6P by Sor6P phosphatase (SorPP) to sorbitol. Sorbitol is converted to fructose by SDH encoded by MdSDH1 in both source and sink tissues. Sorbitol acts as a signal regulating the expression of MdSnRK1, and subsequent phosphorylation of transcription factor MdbZIP39 by MdSnRK1 enhances its transcriptional activation activity on MdSDH1 and MdA6PR. As a result, both SDH and A6PR enzyme activities are upregulated to allow a higher carbon flux going through the sorbitol metabolic pathway. Circled “P” denotes protein phosphorylation. Solid arrow indicates direct regulation; dotted arrow represents indirect regulation.

Similar articles

Cited by

References

    1. Aguayo MF, Ampuero D, Mandujano P, Parada R, Munoz R, Gallart M, Altabella T, Cabrera R, Stange C, Handford M. Sorbitol dehydrogenase is a cytosolic protein required for sorbitol metabolism in Arabidopsis thaliana. Plant Sci. 2013:205-206:63–75. 10.1016/j.plantsci.2013.01.012 - DOI - PubMed
    1. Al Hassan M, Pacurar A, López-Gresa MP, Donat-Torres MP, Llinares JV, Boscaiu M, Vicente O. Effects of salt stress on three ecologically distinct Plantago species. PLoS One 2016:11(8):e160236. 10.1371/journal.pone.0160236 - DOI - PMC - PubMed
    1. Anders S, Huber W. Differential expression analysis for sequence count data. Genome Biol. 2010:11(10):R106. 10.1186/gb-2010-11-10-r106 - DOI - PMC - PubMed
    1. Baena-González E, Lund JE. SnRK1 and trehalose 6-phosphate—two ancient pathways converge to regulate plant metabolism and growth. Curr Opin Plant Biol. 2020:55:52–59. 10.1016/j.pbi.2020.01.010 - DOI - PubMed
    1. Baena-González E, Rolland F, Thevelein JM, Sheen J. A central integrator of transcription networks in plant stress and energy signalling. Nature 2007:448(7156):938–942. 10.1038/nature06069 - DOI - PubMed

Publication types

LinkOut - more resources