Editorial
. 2023 May 4;13(5):1250-1273.
doi: 10.1158/2159-8290.CD-22-0882.

Li-Fraumeni Syndrome-Associated Dimer-Forming Mutant p53 Promotes Transactivation-Independent Mitochondrial Cell Death

Affiliations
Editorial

Li-Fraumeni Syndrome-Associated Dimer-Forming Mutant p53 Promotes Transactivation-Independent Mitochondrial Cell Death

Joshua H Choe et al. Cancer Discov. .

Abstract

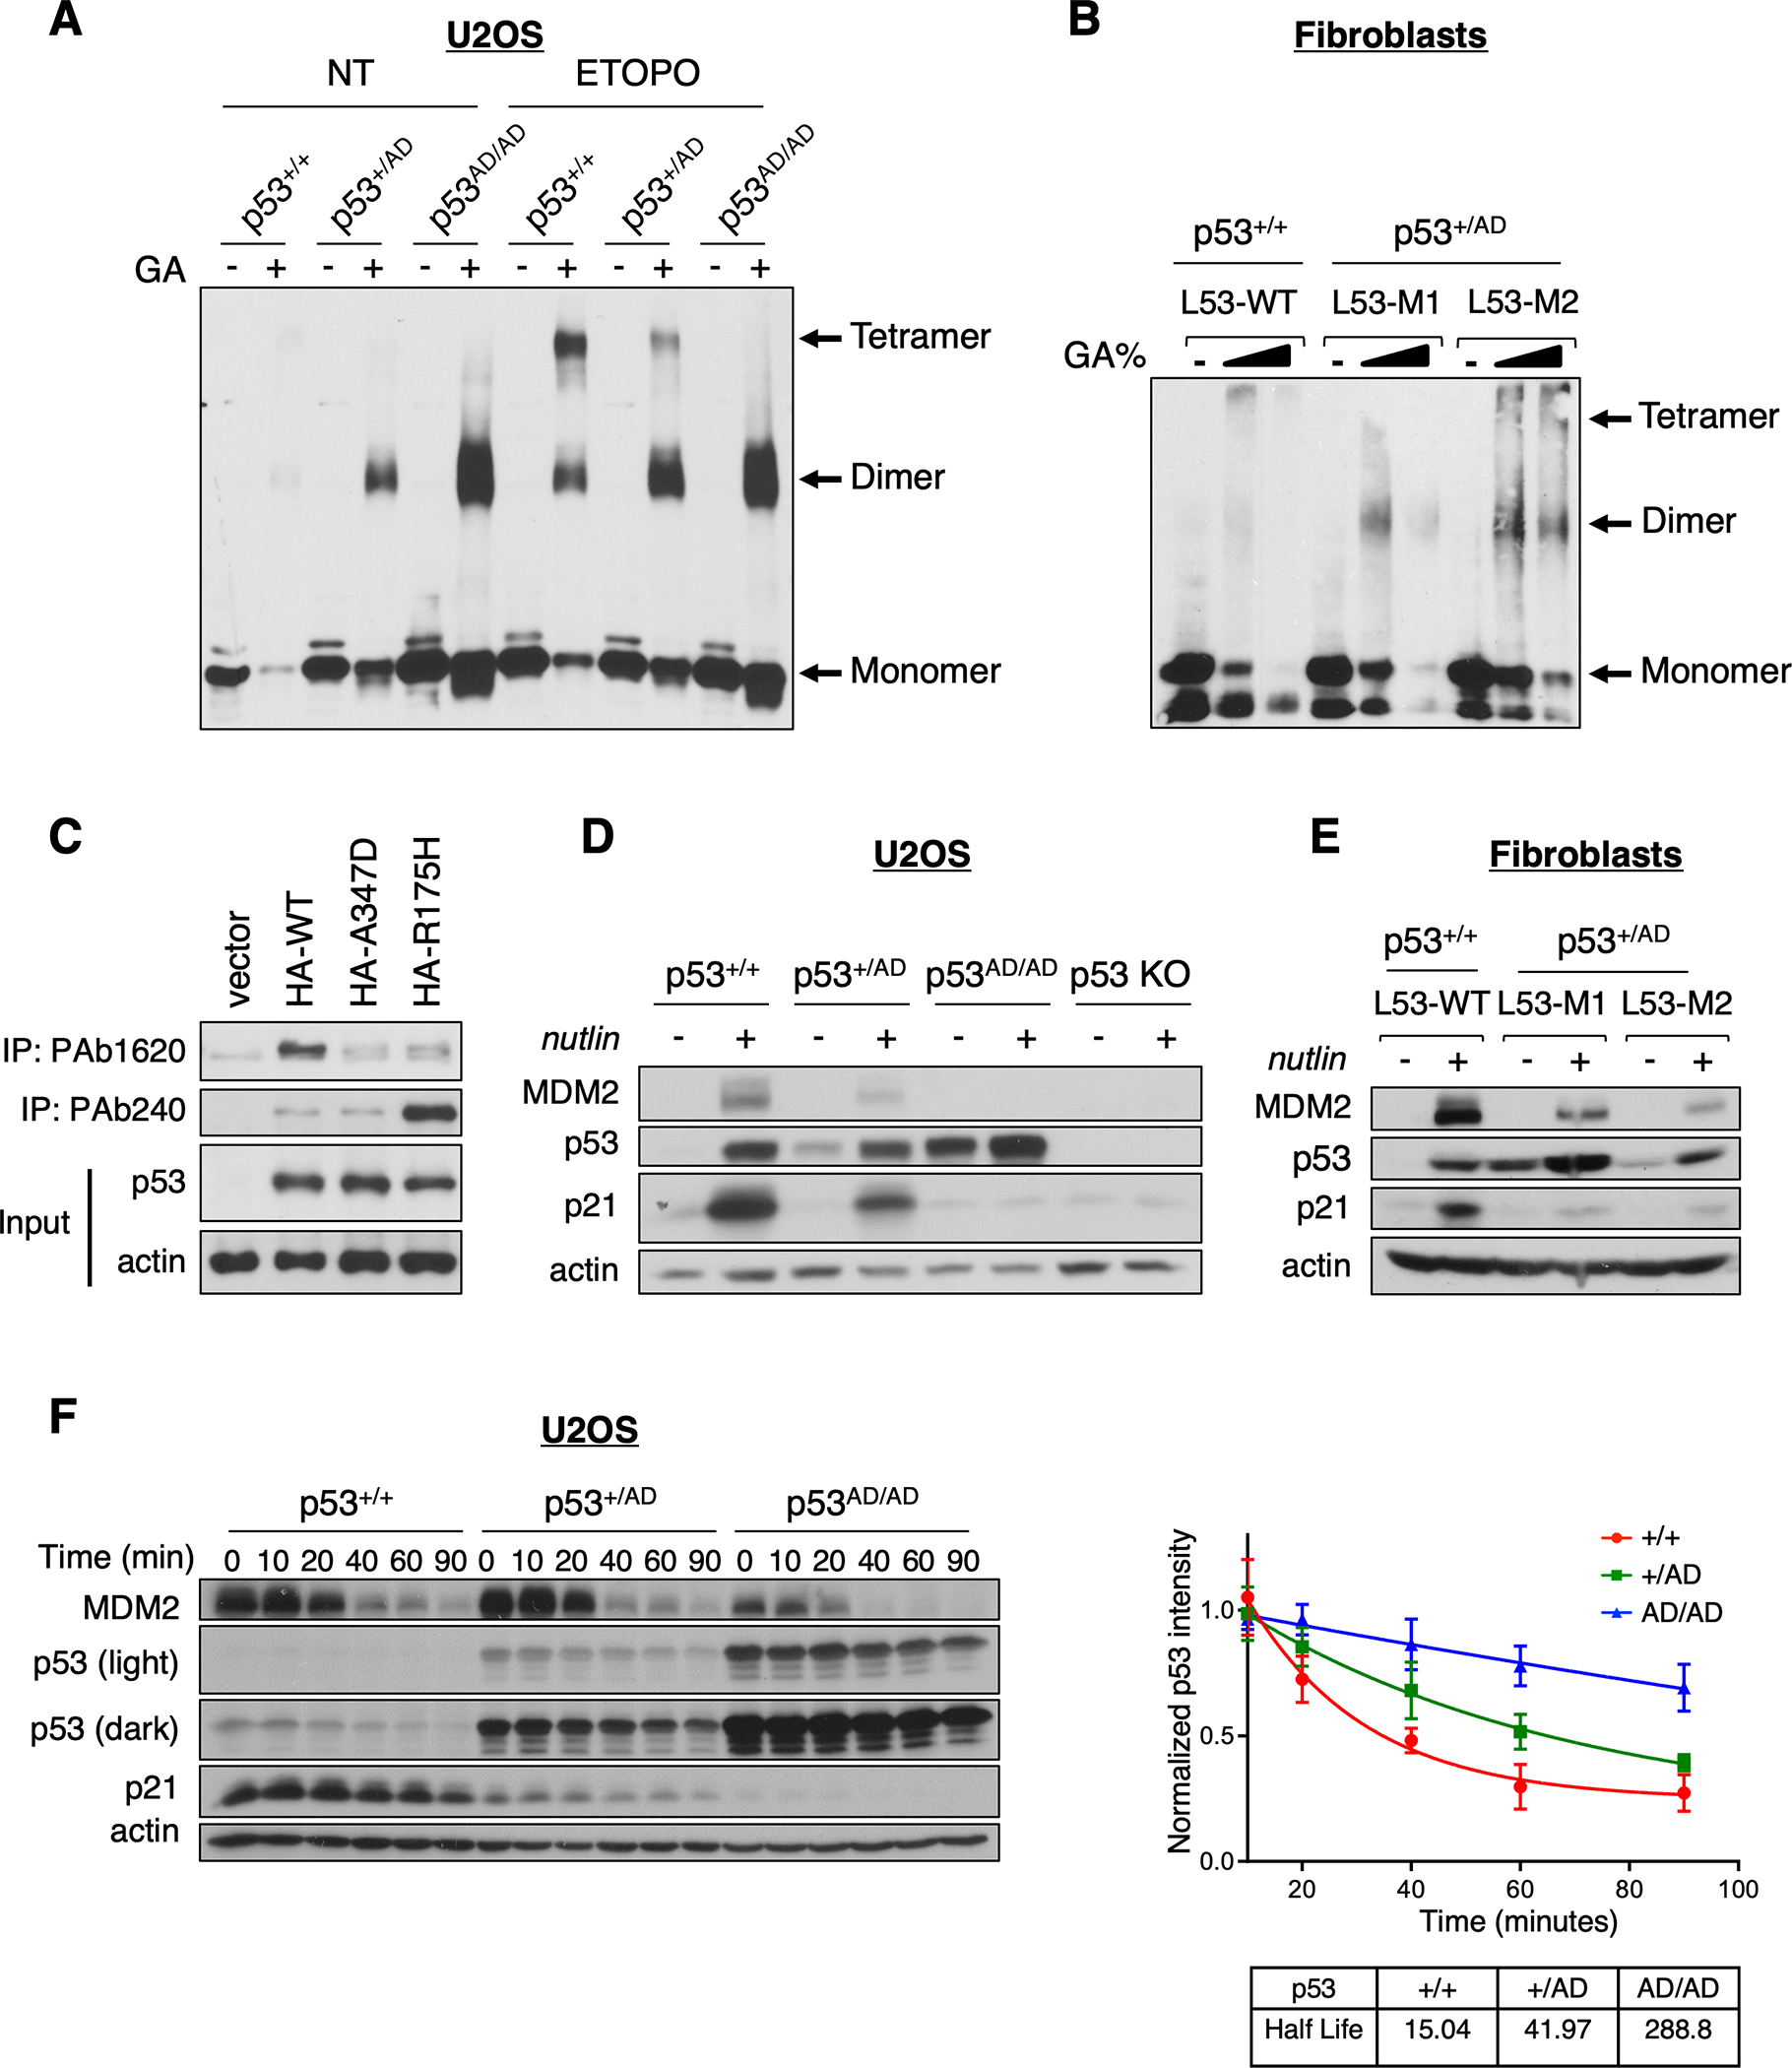
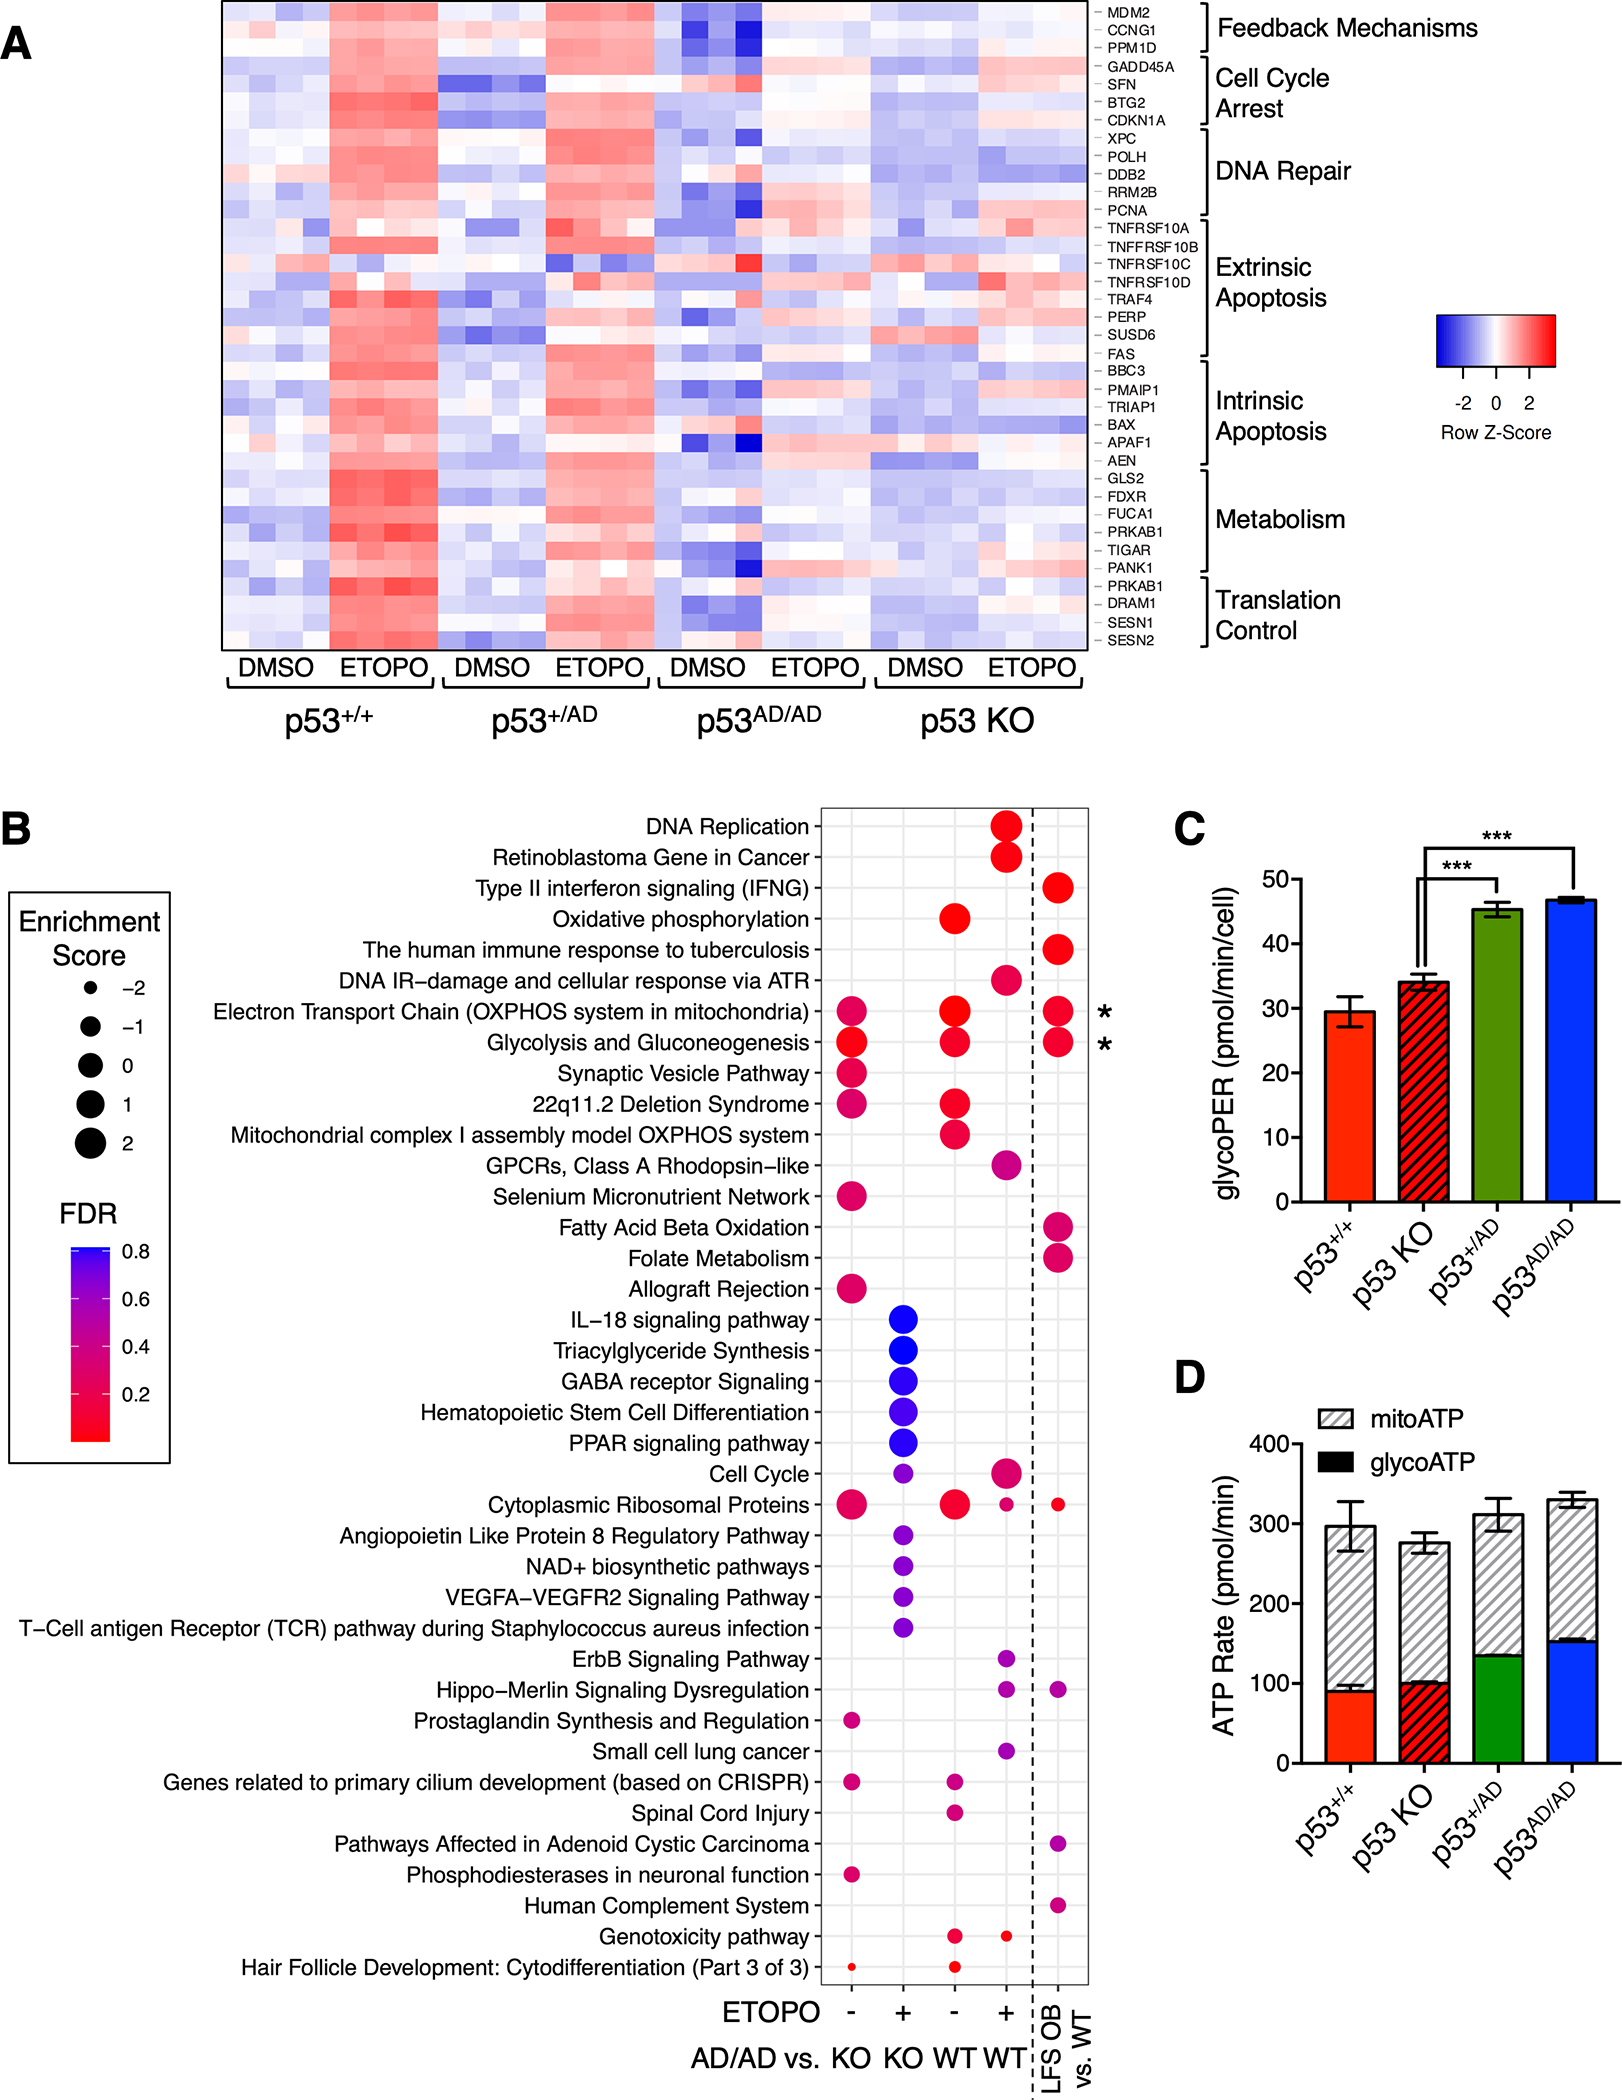
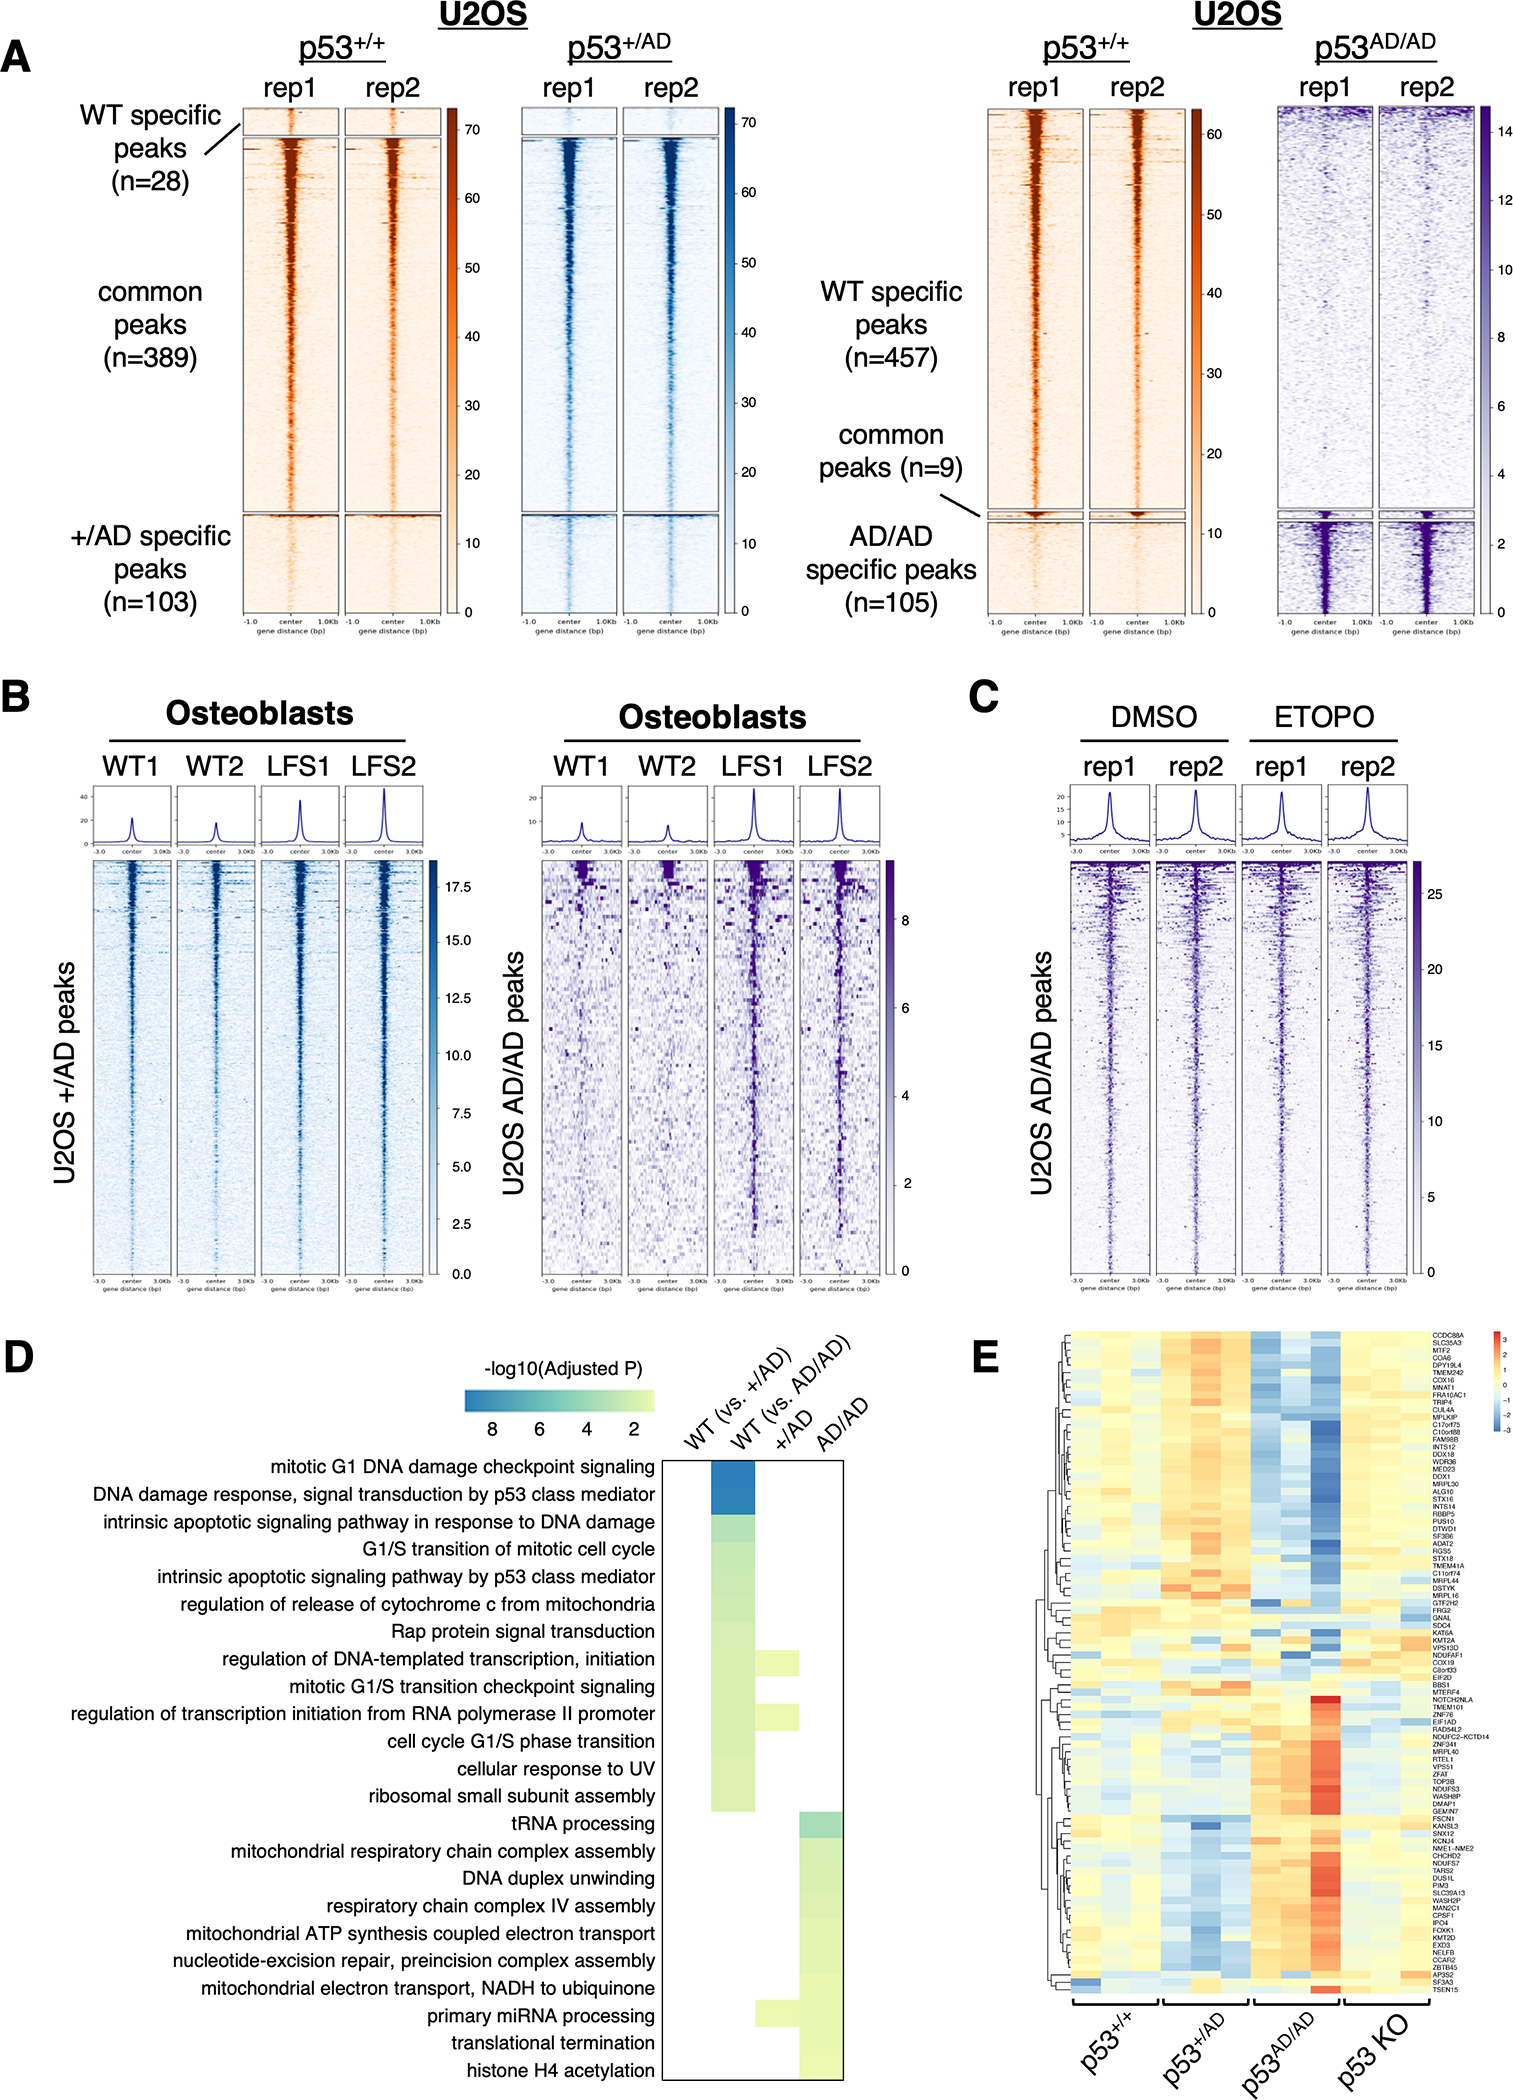
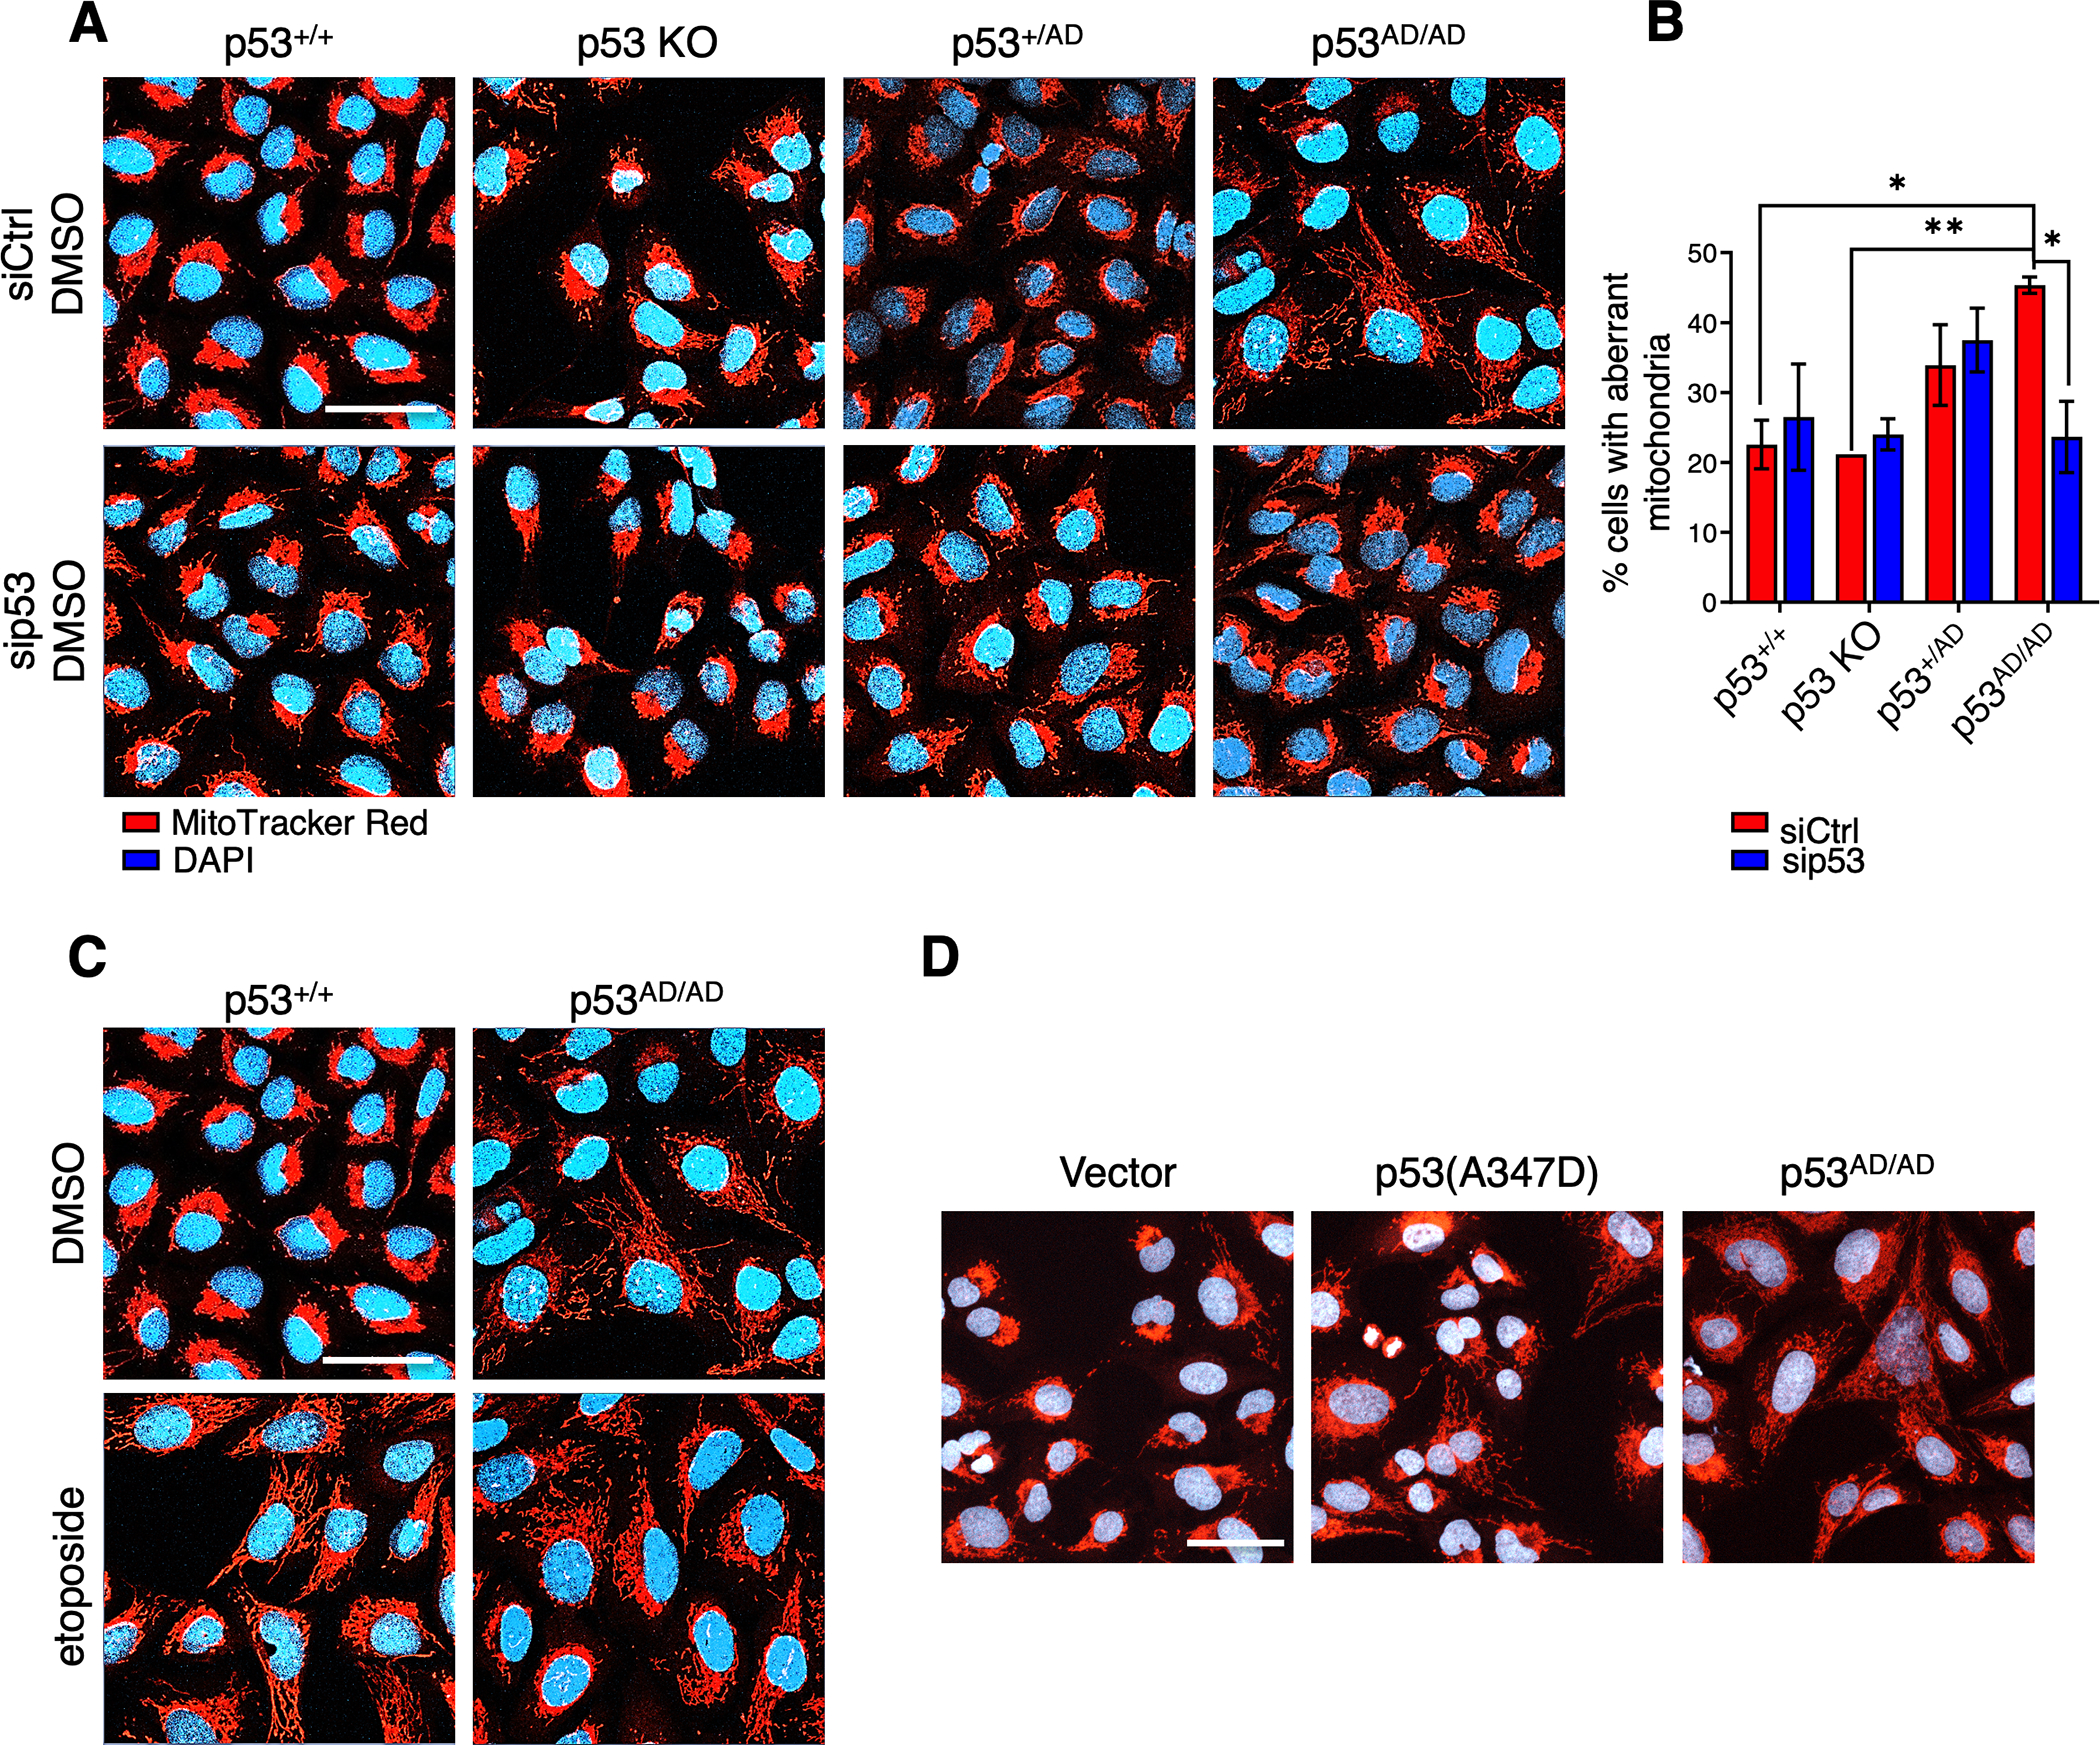
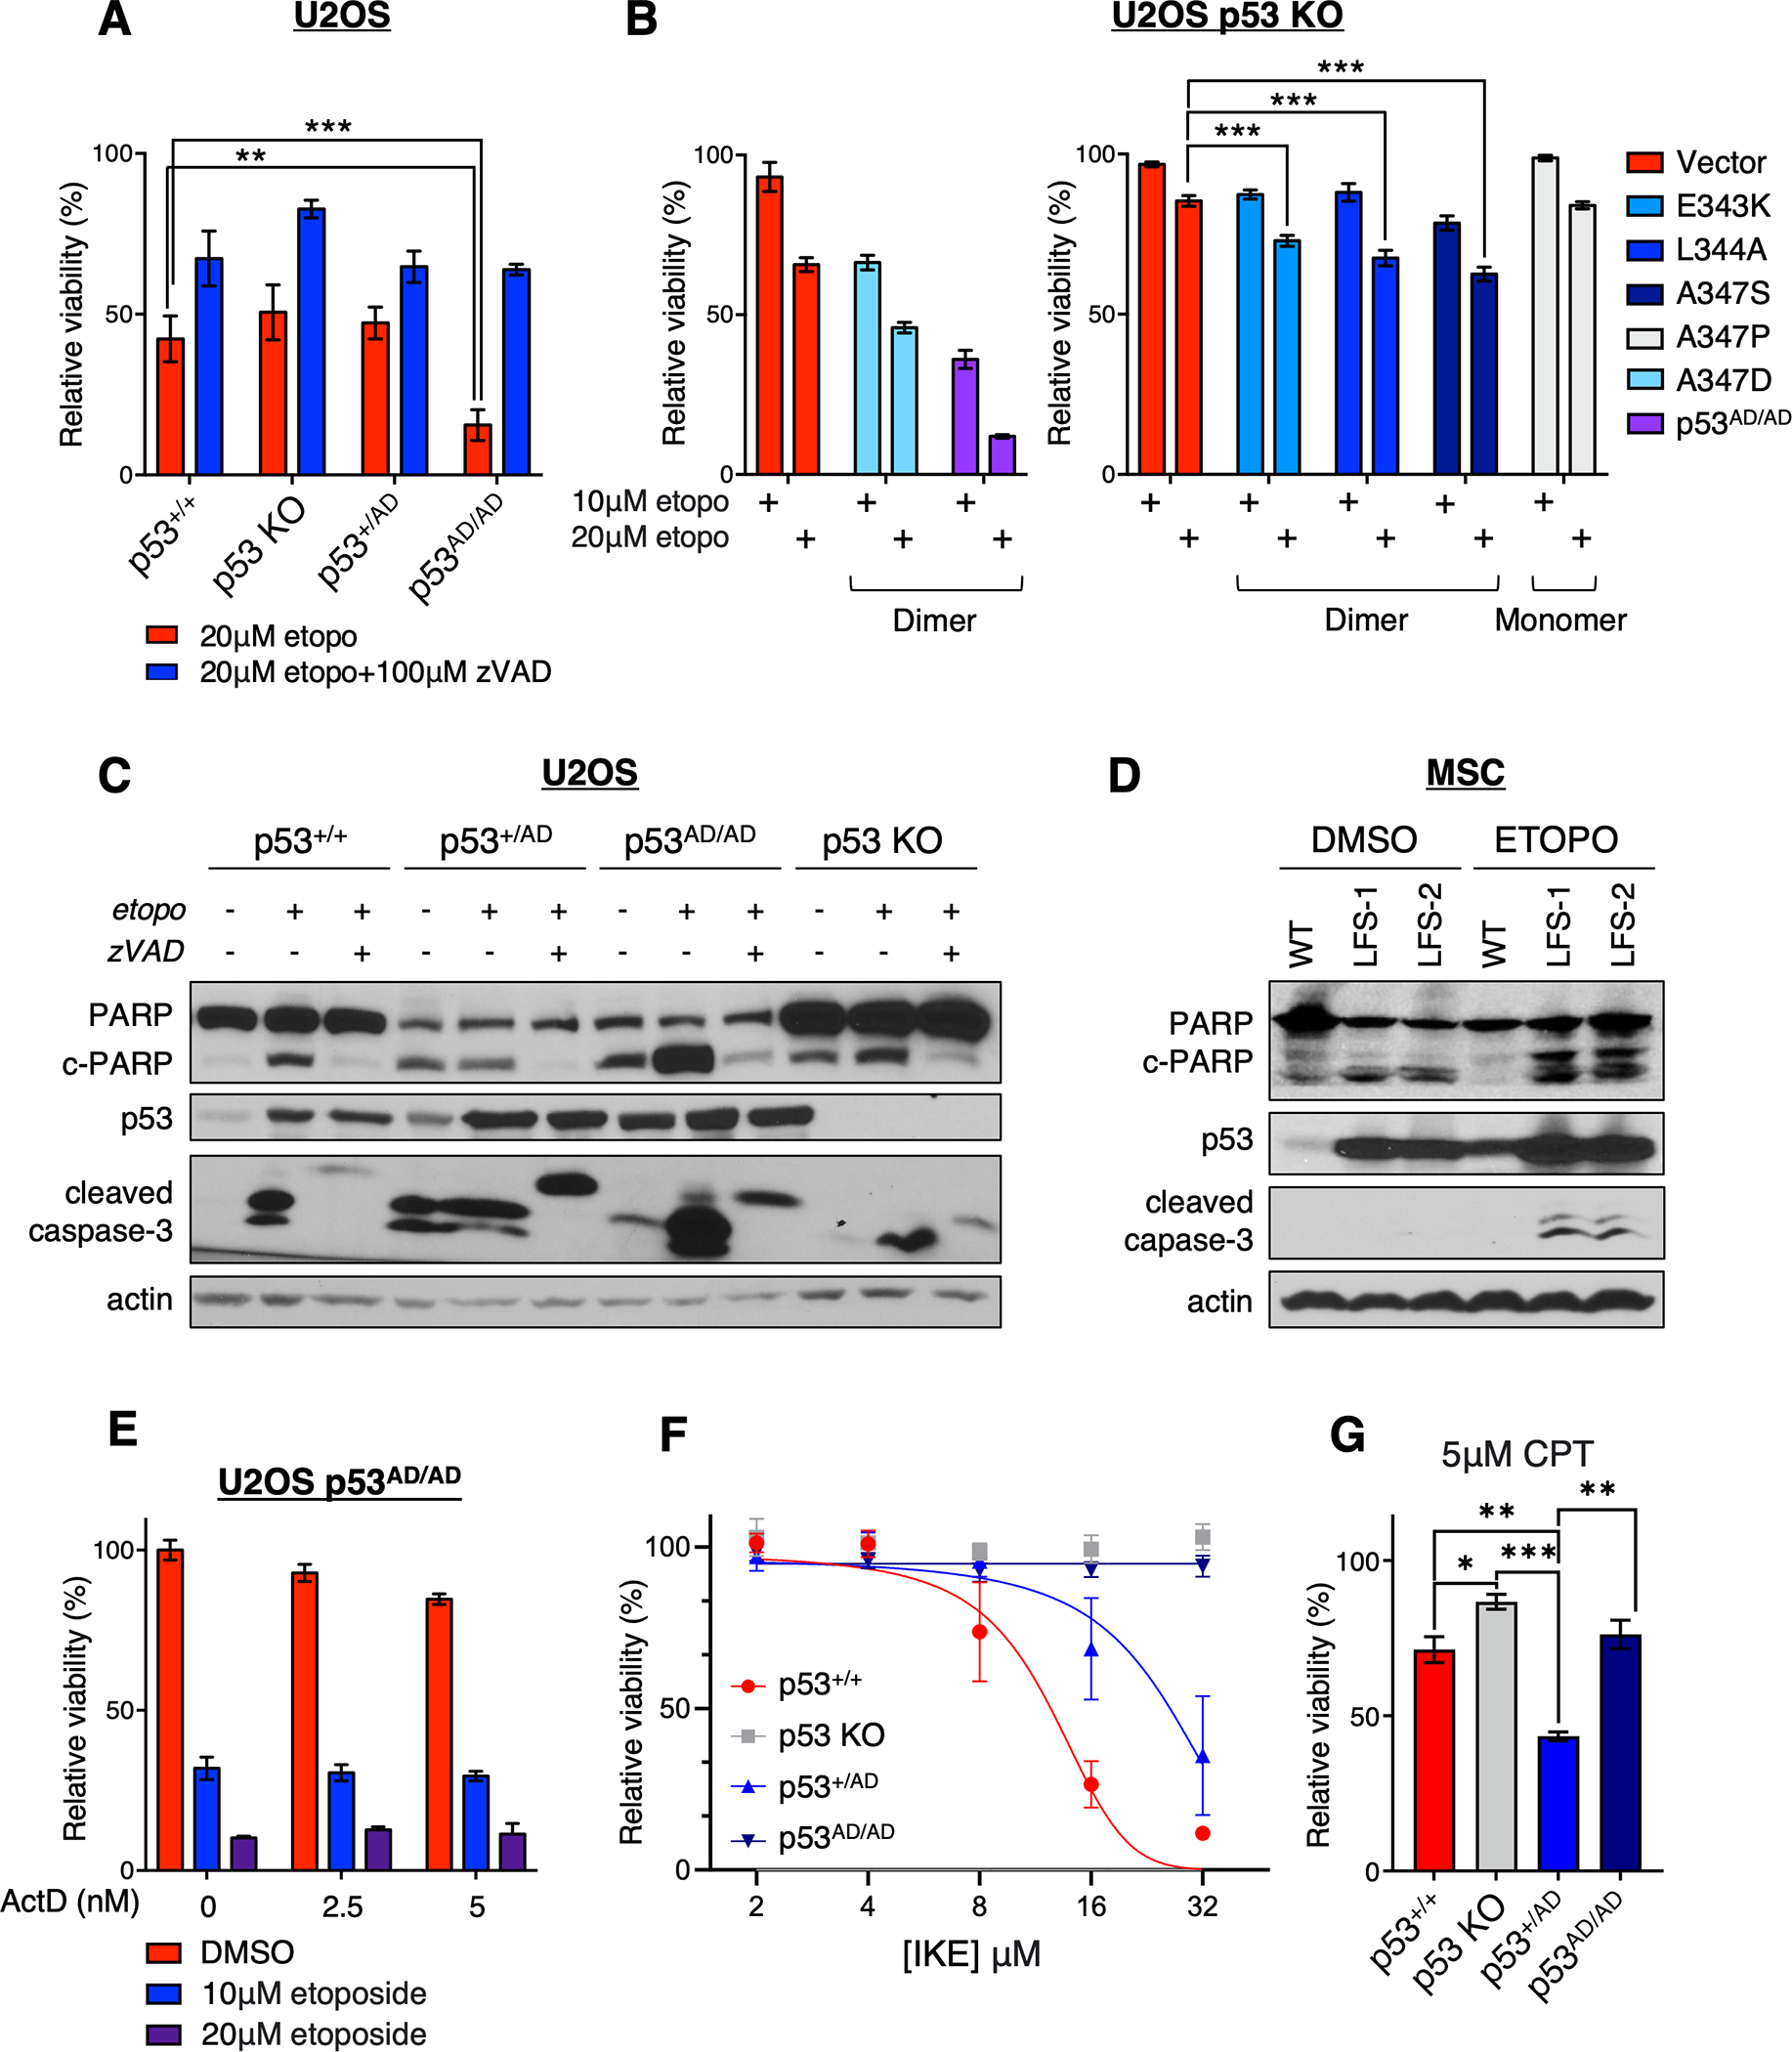
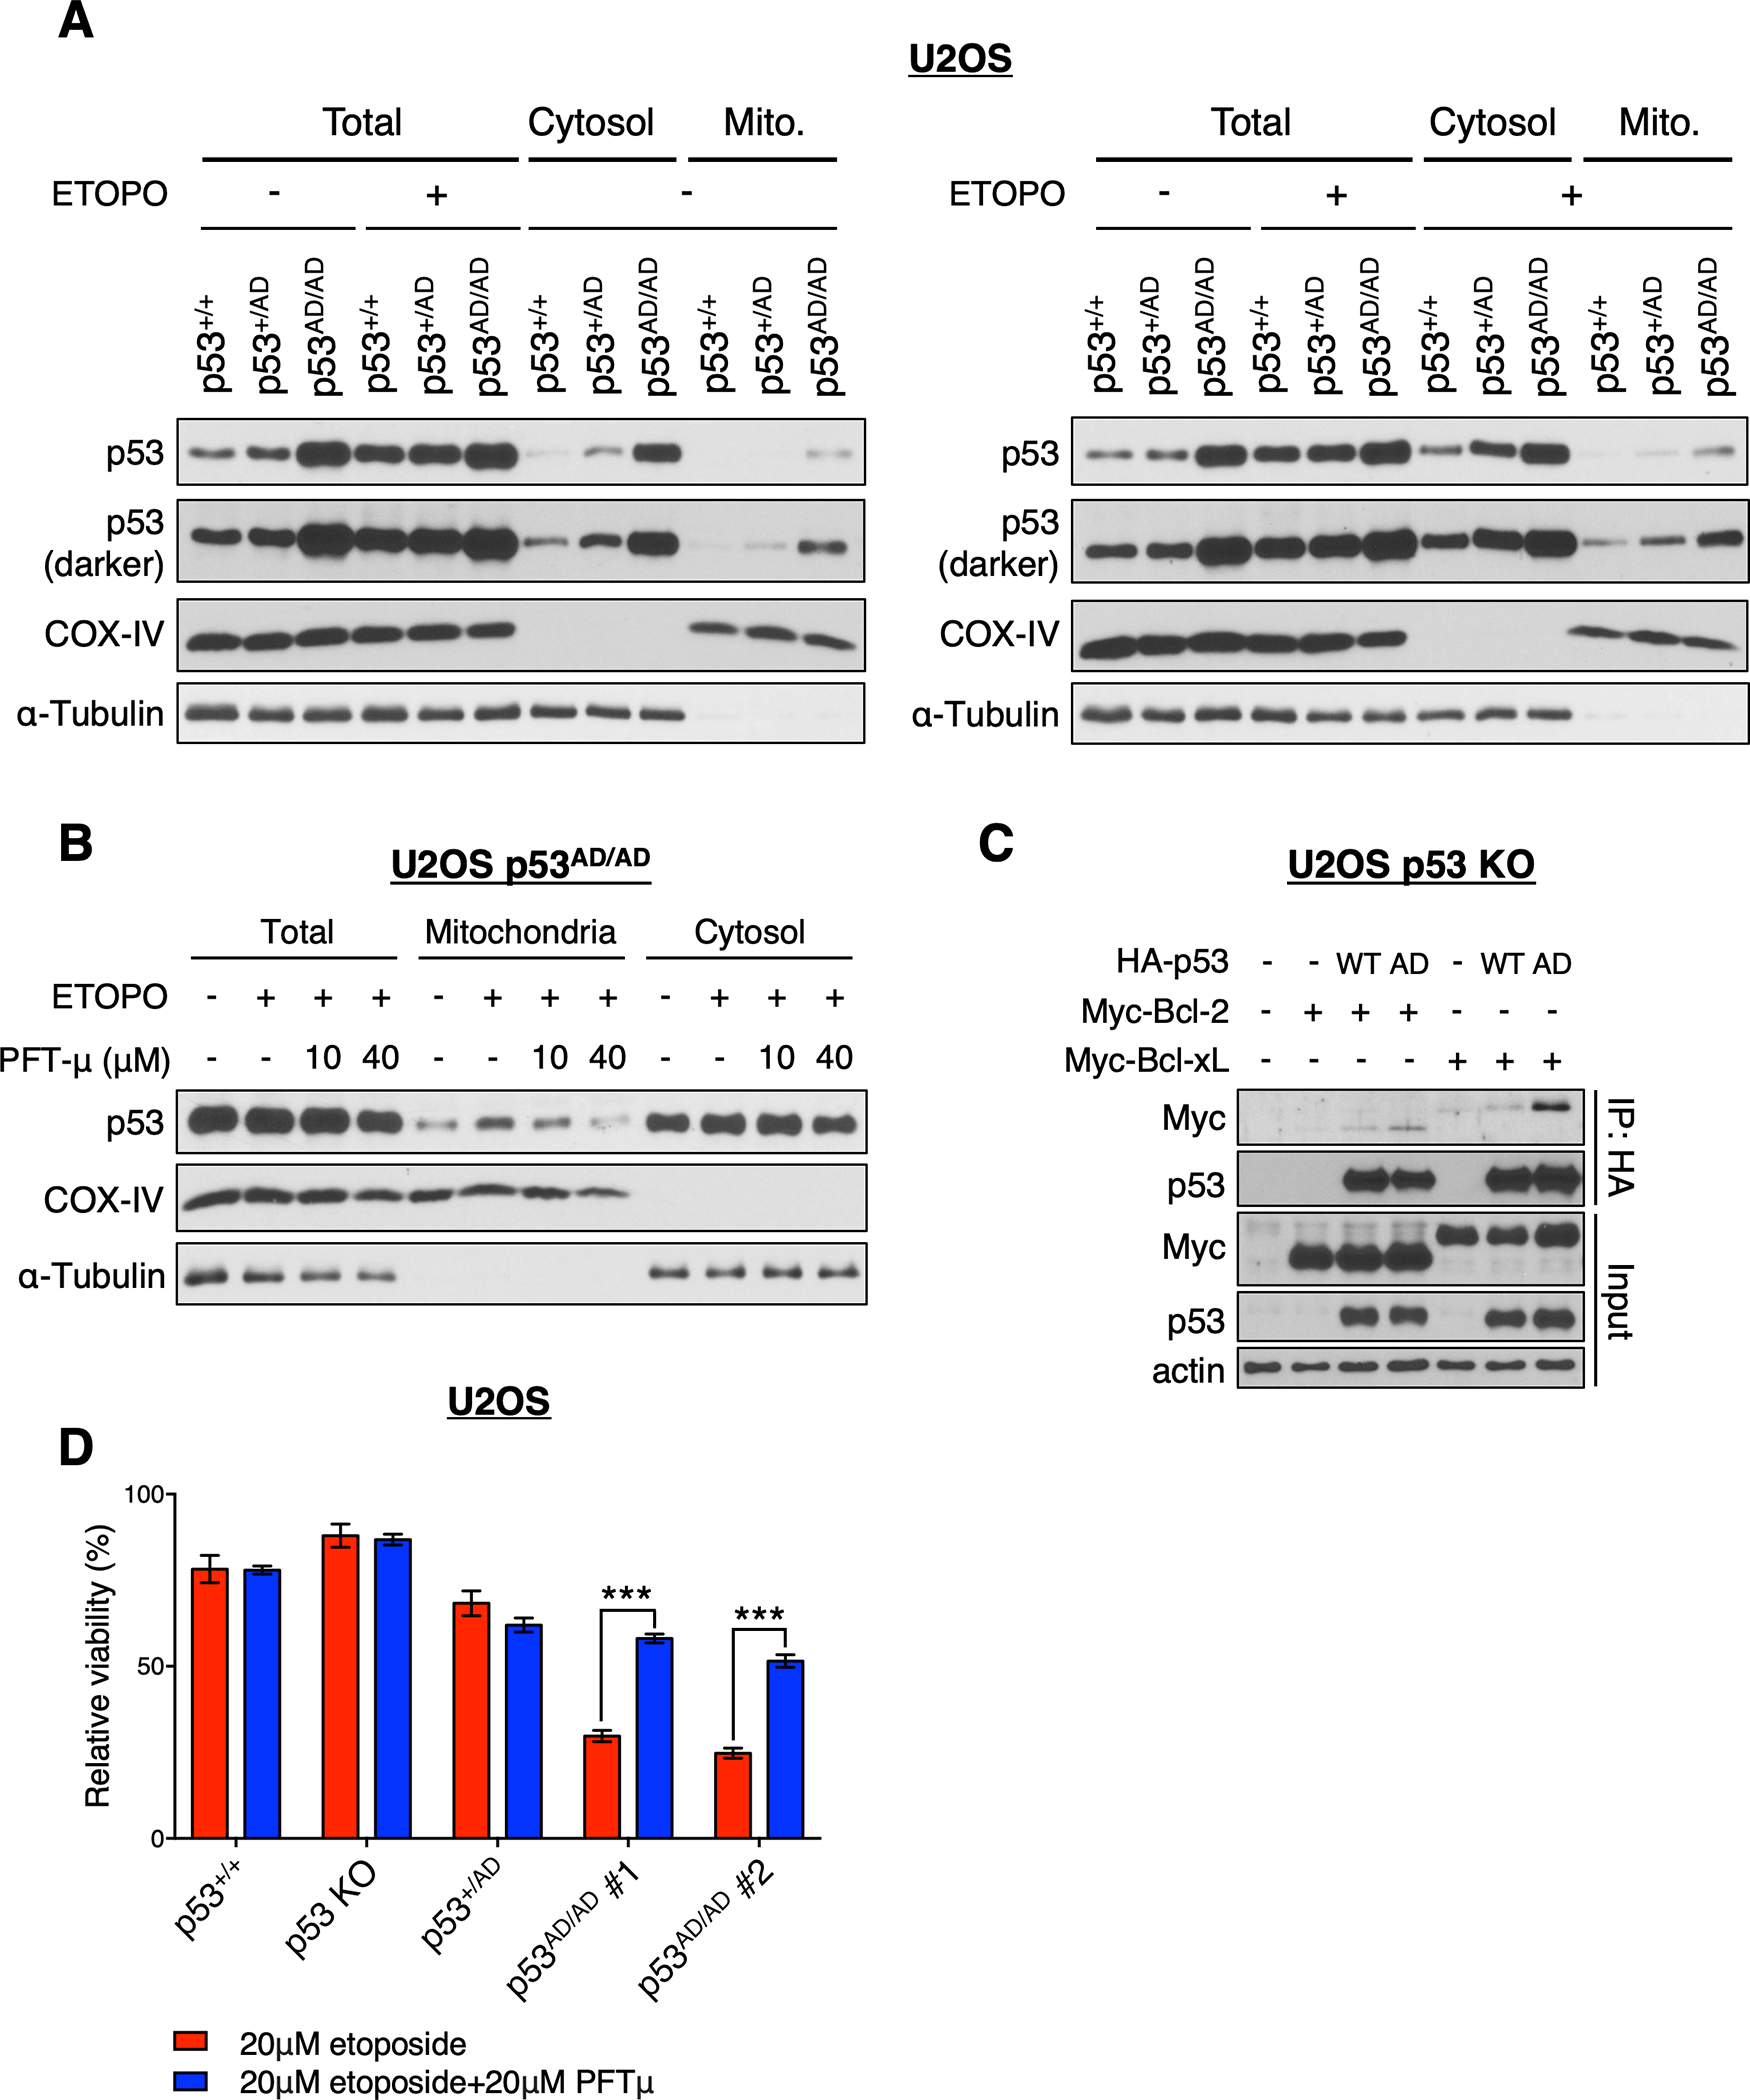
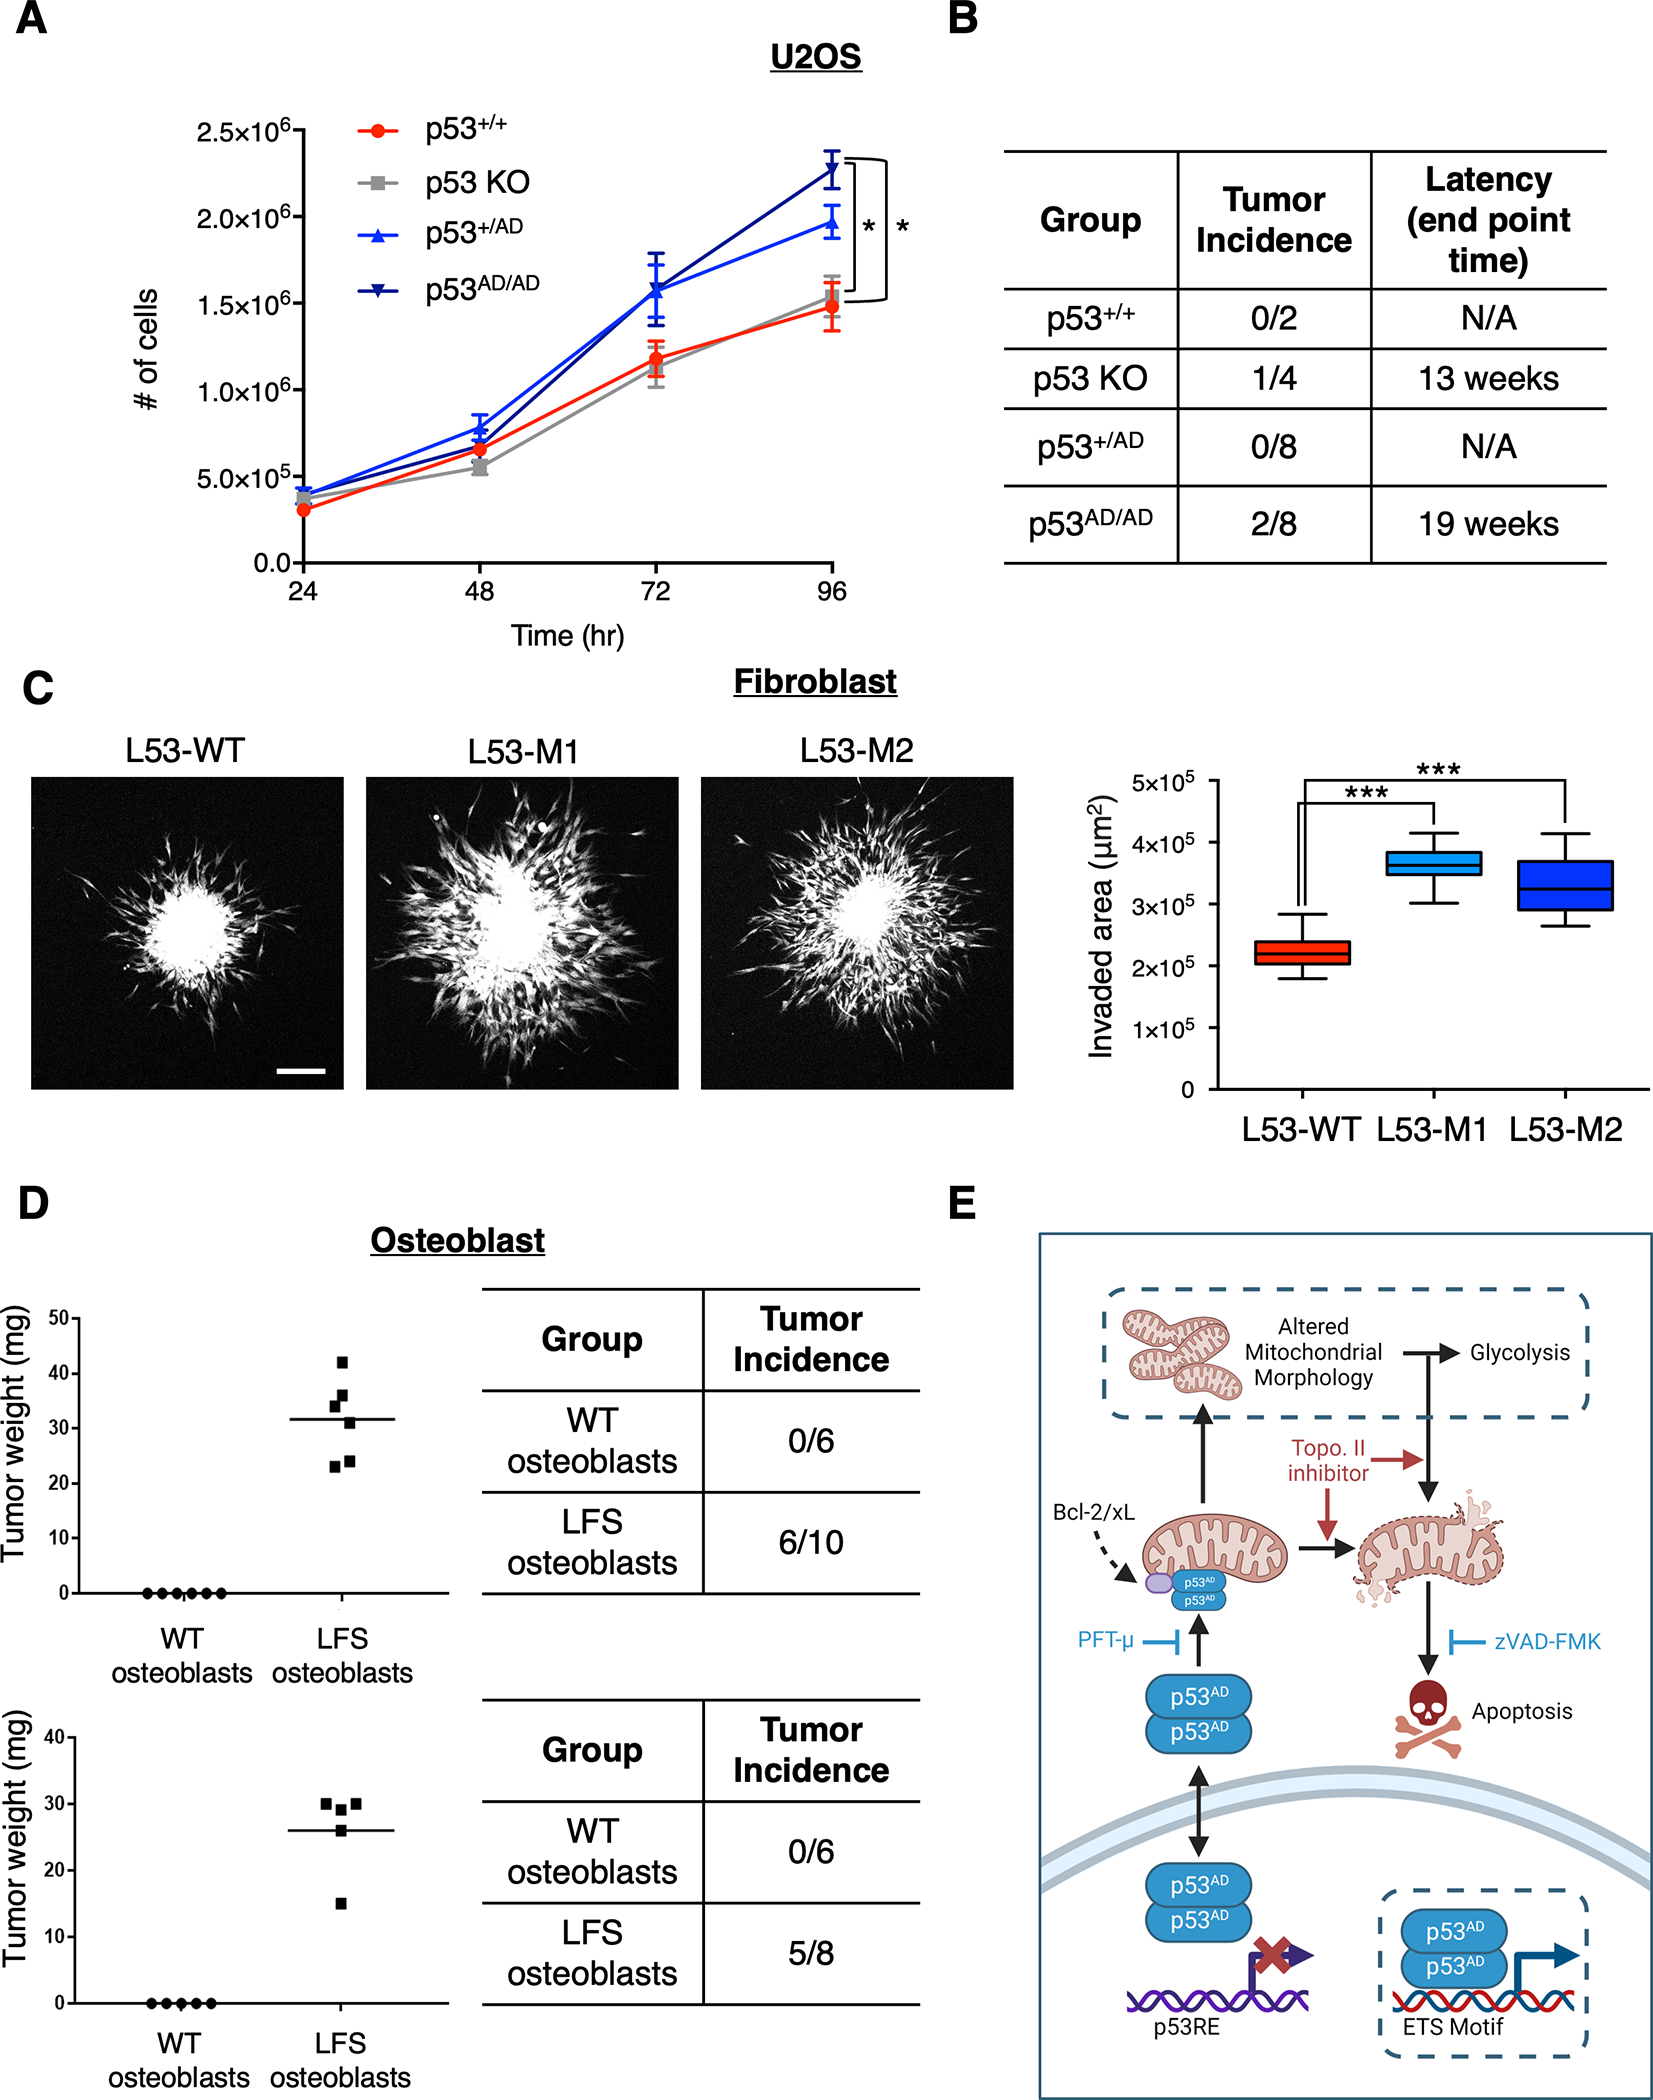
Cancer-relevant mutations in the oligomerization domain (OD) of the p53 tumor suppressor protein, unlike those in the DNA binding domain, have not been well elucidated. Here, we characterized the germline OD mutant p53(A347D), which occurs in cancer-prone Li-Fraumeni syndrome (LFS) patients. Unlike wild-type p53, mutant p53(A347D) cannot form tetramers and exists as a hyperstable dimeric protein. Further, p53(A347D) cannot bind or transactivate the majority of canonical p53 target genes. Isogenic cell lines harboring either p53(A347D) or no p53 yield comparable tumorigenic properties, yet p53(A347D) displays remarkable neomorphic activities. Cells bearing p53(A347D) possess a distinct transcriptional profile and undergo metabolic reprogramming. Further, p53(A347D) induces striking mitochondrial network aberration and associates with mitochondria to drive apoptotic cell death upon topoisomerase II inhibition in the absence of transcription. Thus, dimer-forming p53 demonstrates both loss-of-function (LOF) and gain-of-function (GOF) properties compared with the wild-type form of the protein.

Significance: A mutant p53 (A347D), which can only form dimers, is associated with increased cancer susceptibility in LFS individuals. We found that this mutant wields a double-edged sword, driving tumorigenesis through LOF while gaining enhanced apoptogenic activity as a new GOF, thereby yielding a potential vulnerability to select therapeutic approaches. See related commentary by Stieg et al., p. 1046. See related article by Gencel-Augusto et al., p. 1230. This article is highlighted in the In This Issue feature, p. 1027.


Conflict of interest statement

Conflict of Interest Statement:

The authors declare no conflicts with the research conducted in this study.

Figures

Figure 1.
Figure 1.. Dimer-forming p53(A347D) is hyperstable and transcriptionally impaired
(A) Protein lysates from U2OS p53+/+, p53+/AD, and p53AD/AD cells treated with (ETOPO) or without (NT) 20 μM etoposide for 6 h were incubated in the presence or absence of 0.005% glutaraldehyde for 20 min at room temperature (RT) and subjected to immunoblot analysis with a monoclonal p53 antibody (DO1/1801) to detect p53 oligomeric species indicated at right. (B) Protein lysates from primary dermal fibroblasts expressing WT p53 (L53-WT) or heterozygous p53(A347D) (L53-M1, L53-M2) were incubated with an increasing concentration of glutaraldehyde (0%, 0.01%, 0.05%) for 20 min at RT then subjected to immunoblot analysis as in A. (C) U2OS p53 KO cells were transfected with plasmids expressing HA-WT-p53, HA-p53(A347D), HA-p53(R175H) or the empty vector pcDNA3. Protein lysates were subjected to immunoprecipitation with anti-p53 PAb240 or PAb1620 and immunoblot analysis with anti-p53 (DO-1). (D) U2OS p53+/+, p53+/AD, p53AD/AD, and p53 KO cells were treated with 10 μM nutlin-3a for 24 h then lysed. Protein lysates were then subjected to immunoblot analysis with antibodies against indicated proteins. (E) Protein lysates from primary dermal fibroblasts varying in p53 status were treated with 10 μM nutlin-3a for 24 h, and then processed for immunoblotting with antibodies against indicated proteins. (F) (Left) Following the addition of cycloheximide (100 μg/mL), U2OS cells expressing p53+/+, p53+/AD, and p53AD/AD were harvested at the indicated times. Cell lysates were then subjected to immunoblotting. (Right) Densitometric analysis was performed using ImageJ to assess the half-life of p53. Each point represents the density of the p53 band at indicated time points relative to the initial time point. Data represent mean ± SEM for three biological replicates.
Figure 2.
Figure 2.. Dimer-forming p53(A347D) is unable to transactivate canonical p53 target genes
(A). Heatmap depicts differential gene expression of canonical p53 target genes in U2OS p53+/+, p53+/AD, p53AD/AD, or p53 KO cells that were subjected to RNA-sequencing (RNA-seq) following 24 h treatment with either DMSO or 20 μM etoposide (ETOPO). Columns represent individual technical replicates within each condition. Red indicates higher relative expression. Genes at right were assembled into different biological processes. (B) Dot plot shows pathways positively or negatively enriched in U2OS p53AD/AD cells relative to wild-type p53 and p53 KO cells after DMSO or 20 μM etoposide (ETOPO) treatment and in LFS osteoblasts (OBs) relative to wild-type OBs. Relative dot size represents enrichment score, and color indicates false discovery rate according to legend. (C) Basal glycolytic rate in p53+/+, p53 KO, p53+/AD, p53AD/AD U2OS cells seeded at equivalent densities was measured by the Seahorse XFp Analyzer. Glycolytic proton efflux rate (pmol/min) serves as a measure of glycolytic rate and was assessed in real-time. Data represent the mean ± SEM of three biologically independent experiments. (n=3). (D) Glycolytic and mitochondrial ATP production rates (pmol/min) in p53+/+, p53 KO, p53+/AD, p53AD/AD U2OS cells were measured using the Seahorse XF Real-Time ATP Rate Assay kit. Data represent the mean ± SEM of two biologically independent experiments. (n=2).
Figure 3.
Figure 3.. p53(A347D) exhibits a unique chromatin binding signature
ChIP-Seq analysis was performed on either pooled clones of p53+/+, p53+/AD, and p53AD/AD U2OS cells as described in Methods with two biological replicates (rep1 and rep2) or two clones each of p53+/+ or p53+/AD osteoblasts (WT1 and WT2 or LFS1 and LFS2). U2OS p53 KO cells were used as a negative control in experiments with U2OS cells. (A) Heatmaps depict p53 binding to 1-kb genomic loci surrounding identified ChIP-seq peaks in p53+/+ vs. p53+/AD U2OS cells (left) and p53+/+ vs. p53AD/AD cells (right) and are grouped by WT p53-specific peaks, common peaks, and either p53+/AD or p53AD/AD specific peaks. (B) Heatmaps depict p53 binding to 3-kb genomic loci surrounding peaks associated with either p53+/AD (left) or p53AD/AD (right) U2OS cells in either WT or LFS osteoblasts. (C) Heatmaps demonstrate dimeric mutant p53 binding to 3-kb genomic loci surrounding peaks identified p53AD/AD U2OS cells upon treatment with DMSO or 20 μM etoposide (ETOPO) for 24 h. (D) Heatmap depicts GO biological processes highly enriched in p53+/+ cells relative to both p53+/AD and p53AD/AD U2OS cells, p53+/AD cells, and p53AD/AD cells. (E) Heatmap illustrates expression of genes in p53 whose loci are identified to be bound by dimeric mutant p53 in p53+/+. p53 KO, p53+/AD, and p53AD/AD U2OS cells clustered by upregulated and downregulated genes.
Figure 4.
Figure 4.. Dimeric mutant p53 promotes mitochondrial network aberration
(A) Representative images of fixed p53+/+, p53 KO, p53+/AD, and p53AD/AD U2OS cells transfected with 25 nM of either a non-targeting siRNA pool (siCtrl) or siRNA pool against p53 (sip53) for 48 h and treated with DMSO for 24h. Mitochondria were visualized by MitoTracker Red staining (red). Nuclei were stained with DAPI (blue). (n=3). Scale bar, 50 μm. (B) Relative mitochondrial aberrance was determined by a trained observer counting the number of cells with aberrant mitochondria and total number of cells within each field. Images were blinded and randomized prior to counting. Bars represent the mean ± SEM of three biologically independent experiments. (n=3, 7–12 images captured per group). Statistical significance was assessed by two-tailed t-test. *p<0.05, **p<0.01 (C) Representative images of p53+/+ and p53AD/AD U2OS cells treated with etoposide for 24 h after transfection with non-targeting siRNA for 24 h then stained with MitoTracker Red (red) and DAPI (blue). (n=3). Scale bar, 50 μm. (D) Representative images of U2OS p53 KO cells stably expressing either vector or p53(A347D) and U2OS p53AD/AD cells stained with MitoTracker Red (red) and DAPI (blue). Scale bar, 50 μm.
Figure 5.
Figure 5.. Mutant p53 cells preferentially undergo apoptosis under genotoxic stress
(A) Viability of indicated U2OS cells treated with 20 μM etoposide (etopo) or 20 μM etoposide + 100 μM zVAD-FMK (zVAD) as assessed by neutral red uptake and normalized to the DMSO control. Data represent mean ± SEM of four biologically independent experiments each with four technical replicates. (B) Viability of U2OS p53 KO cells stably expressing either vector or the following p53 mutations (E343K, L344A, A347S, A347D) and U2OS p53AD/AD cells treated with 10 μM or 20 μM etoposide (etopo) as assessed by neutral red uptake and normalized to the DMSO control. Viability experiment with vector, transduced p53(A347D), and p53AD/AD cells (left) performed separately. Data represent mean ± SEM of three biologically independent experiments each with two or three technical replicates. (C) U2OS cells varying in p53 status (p53+/+. p53 KO, p53+/AD, and p53AD/AD) were treated with DMSO, 20 μM etoposide, or 20 μM etoposide + 100 μM zVAD-FMK (zVAD) for 48 h and subjected to immunoblotting with the indicated antibodies. (D) Mesenchymal stem cells (MSC) derived from primary dermal fibroblasts through the protocol described in the Methods were treated with 20 μM etoposide for 24 h, harvested, and subjected to immunoblot analysis with the indicated antibodies. (E) Viability of U2OS p53AD/AD cells treated with etoposide and/or actinomycin D (ActD) at indicated concentrations for 48 h as assessed by neutral red uptake and normalized to the DMSO control. Two biologically independent experiments were performed in triplicate, and representative data are shown as mean ± SD. (F) Viability of U2OS cells varying in p53 status treated with increasing concentrations of IKE for 48 h as assessed by neutral red uptake and normalized to DMSO-treated cells. Data represent mean ± SEM of three biologically independent experiments each with at least three technical replicates. (G) Viability of U2OS cells varying in p53 status treated with 5 μM camptothecin (CPT) for 48 h as assessed by neutral red uptake and normalized to the DMSO control. Data represent mean ± SEM of three biologically independent experiments each with three technical replicates. Statistical significance was assessed by two-tailed t-test. *p<0.05, **p<0.01, ***p<0.001
Figure 6.
Figure 6.. p53(A347D) preferentially associates with mitochondria to drive increased cell death
(A) Mitochondrial and cytosolic fractions were isolated from U2OS p53+/+, p53+/AD, and p53AD/AD cells treated with or without 10 μM etoposide for 24 h. Isolated fractions and total cell lysate were subjected to immunoblot analysis with indicated antibodies. (B) Mitochondrial and cytosolic fractions were isolated from U2OS p53AD/AD cells treated with or without 10 μM etoposide in the presence or absence of pifithrin-μ (10 μM or 40 μM) for 20 h. Isolated fractions and total cell lysate were subjected to immunoblot analysis with indicated antibodies. (C) U2OS p53 KO cells were co-transfected with the empty vector pcDNA3, HA-WT p53, or HA-p53(A347D) and myc-DDK-Bcl-2 or myc-DDK-Bcl-xL at indicated combinations and treated with 10 μM etoposide for 6 h. Protein lysates were immunoprecipitated with anti-HA agarose beads and subjected to immunoblot analysis with indicated antibodies. (D) Viability of indicated U2OS cells treated with 20 μM etoposide or 20 μM etoposide + 20 μM pifithrin-μ (PFTμ) as assessed by neutral red uptake and normalized to the DMSO control. Data represent mean ± SEM of three biologically independent experiments each with four technical replicates.
Figure 7.
Figure 7.. p53(A347D) mutants demonstrate enhanced tumorigenic capacity
(A) The allelic series of U2OS cells were seeded at equivalent densities and counted at indicated timepoints. Data show relative cell number of indicated cell lines normalized to U2OS parental and represent mean ± SEM of three biologically independent experiments each with three technical replicates per condition. (B) p53+/+, p53 KO, p53+/AD, and p53AD/AD U2OS cells were injected subcutaneously into the right and left dorsal flanks of NU/NU mice. Tumors were extracted at indicated end points post injection and weighed. (C) Spheroids of primary dermal fibroblasts harboring either p53+/+ (L53-WT) or p53+/AD (L53-M1, L53-M2) were formed and implanted into a collagen matrix as described in Methods. Fluorescent microscopy images were taken 1 hour and 24 hours after implantation from which a representative confocal microscopy image (maximum projection) is shown (left) and invaded area was calculated by subtracting the area of initial spheroid from the ellipse covering the invaded area at endpoint of the experiments for each individual spheroid (right). The data is presented in a box plot depicting the median and second and third quartiles, with whiskers representing the data from 5% to 95%. Squares indicate mean values. Data was pooled from three biologically independent experiments and contains 24 spheroids for condition L53-WT, 28 spheroids for condition L53-M1, and 26 spheroids for condition L53-M2. Scale bar, 200 μm. (D) WT and LFS iPSC-derived osteoblasts were injected subcutaneously into the right and left dorsal flanks of NU/NU mice. Tumors were extracted 1 month post injection and weighed (left). Table (right) demonstrates tumor incidence from two biologically independent experiments and indicates the number of injections per condition (n=2, 6–10 injections per group). Statistical significance was assessed by two-tailed t-test. ***p<0.001, **p<0.01, *p<0.05 (E) Model depicting novel activities of mutant p53(A347D). Dimer-forming p53(A347D) has lost the ability to bind and transactivate canonical p53 target genes yet gains the ability to bind select genes with ETS motifs, which may lead to their activation or repression. p53(A347D) can translocate to mitochondria and interact with anti-apoptotic proteins Bcl-2 and Bcl-xL, leading to apoptosis following topoisomerase ii inhibition. Although p53(A347D) induces mitochondrial network aberrations, it is yet unclear whether altered mitochondrial morphology is a result of either direct mitochondrial interactions or the novel transcriptional activity of dimeric mutant p53, which are denoted with dotted borders. Altered mitochondrial morphology and function may cause a compensatory increase in glycolysis. Model diagram was created using Biorender.com

Comment in

Comment on

References

    1. Bieging KT, Mello SS, Attardi LD. Unravelling mechanisms of p53-mediated tumour suppression. Nat Rev Cancer 2014;14(5):359–70 doi 10.1038/nrc3711. - DOI - PMC - PubMed
    1. Vousden KH, Prives C. Blinded by the Light: The Growing Complexity of p53. Cell 2009;137(3):413–31 doi 10.1016/j.cell.2009.04.037. - DOI - PubMed
    1. Hollstein M, Sidransky D, Vogelstein B, Harris CC. p53 mutations in human cancers. Science 1991;253(5015):49–53. - PubMed
    1. Mai PL, Best AF, Peters JA, DeCastro RM, Khincha PP, Loud JT, et al. Risks of first and subsequent cancers among TP53 mutation carriers in the National Cancer Institute Li-Fraumeni syndrome cohort. Cancer 2016;122(23):3673–81 doi 10.1002/cncr.30248. - DOI - PMC - PubMed
    1. Kleihues P, Schäuble B, zur Hausen A, Estève J, Ohgaki H. Tumors associated with p53 germline mutations: a synopsis of 91 families. Am J Pathol 1997;150(1):1–13. - PMC - PubMed

MeSH terms

Substances