Editorial
. 2023 May 4;13(5):1230-1249.
doi: 10.1158/2159-8290.CD-22-0872.

Dimeric p53 Mutant Elicits Unique Tumor-Suppressive Activities through an Altered Metabolic Program

Affiliations
Editorial

Dimeric p53 Mutant Elicits Unique Tumor-Suppressive Activities through an Altered Metabolic Program

Jovanka Gencel-Augusto et al. Cancer Discov. .

Abstract

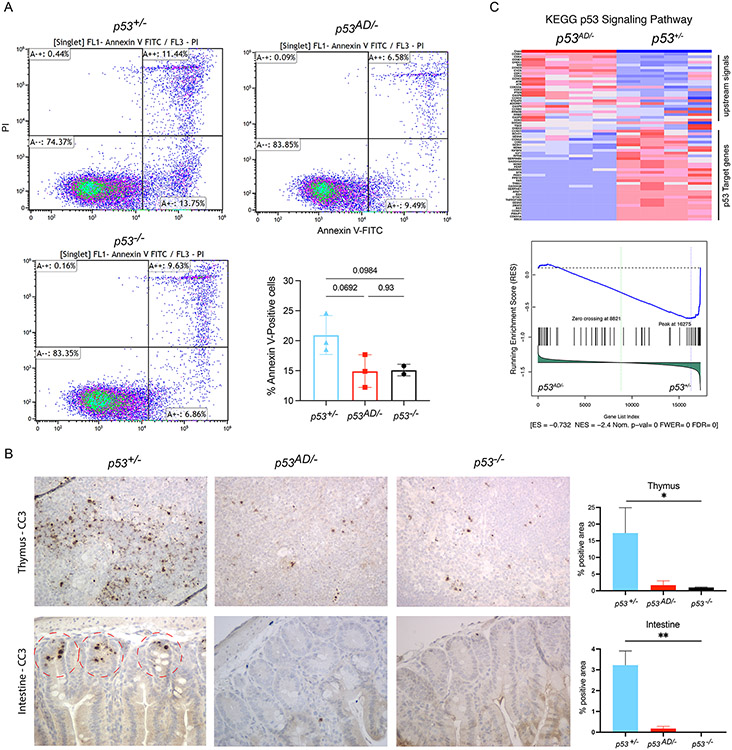
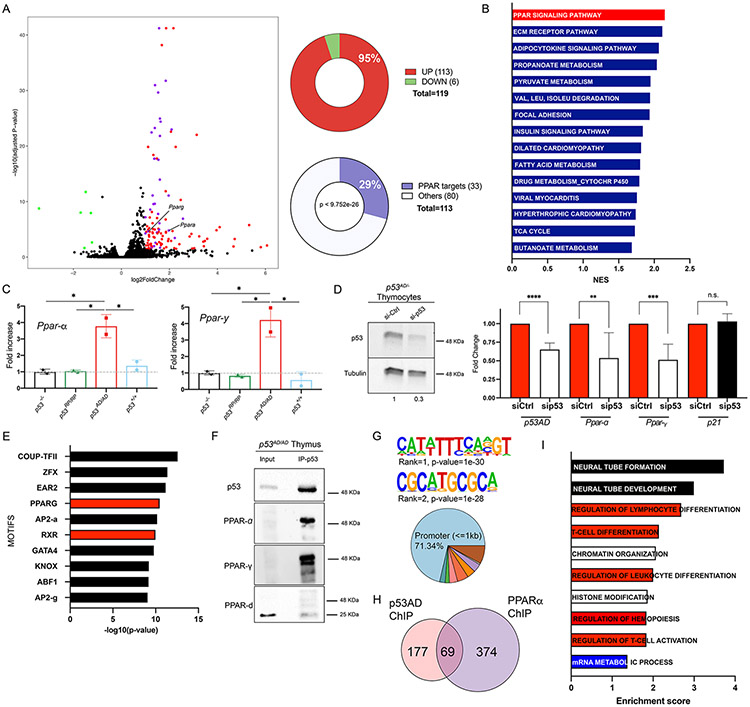
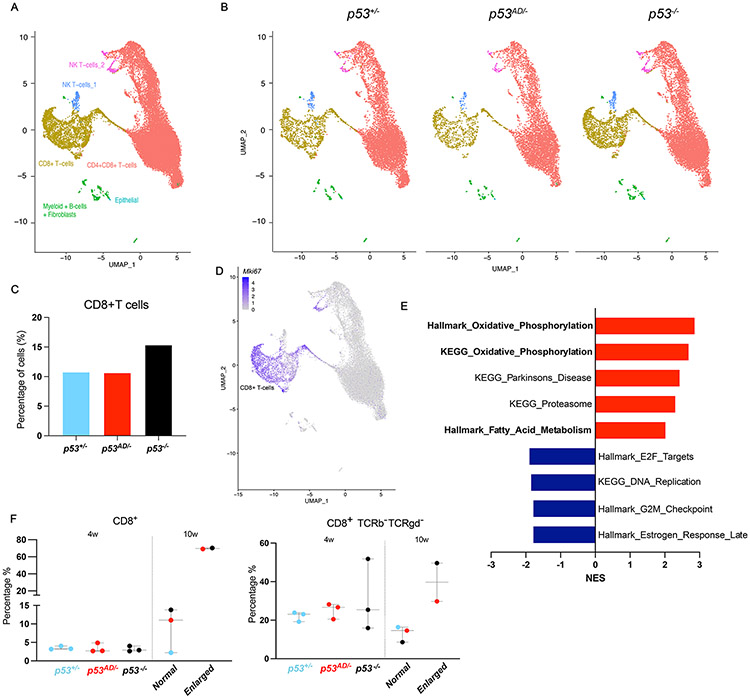
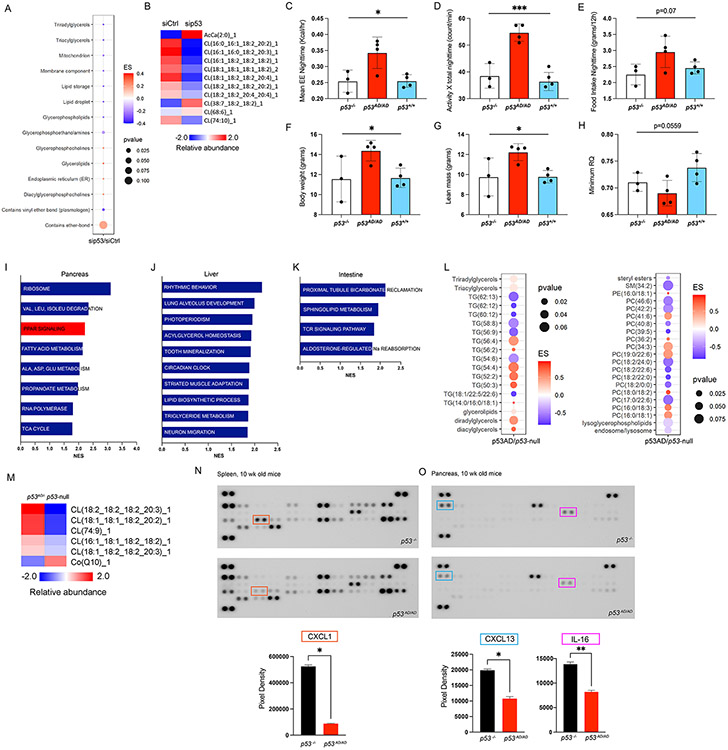
Cancer-related alterations of the p53 tetramerization domain (TD) abrogate wild-type (WT) p53 function. They result in a protein that preferentially forms monomers or dimers, which are also normal p53 states under basal cellular conditions. However, their physiologic relevance is not well understood. We have established in vivo models for monomeric and dimeric p53, which model Li-Fraumeni syndrome patients with germline p53 TD alterations. p53 monomers are inactive forms of the protein. Unexpectedly, p53 dimers conferred some tumor suppression that is not mediated by canonical WT p53 activities. p53 dimers upregulate the PPAR pathway. These activities are associated with lower prevalence of thymic lymphomas and increased CD8+ T-cell differentiation. Lymphomas derived from dimeric p53 mice show cooperating alterations in the PPAR pathway, further implicating a role for these activities in tumor suppression. Our data reveal novel functions for p53 dimers and support the exploration of PPAR agonists as therapies.

Significance: New mouse models with TP53R342P (monomer) or TP53A347D (dimer) mutations mimic Li-Fraumeni syndrome. Although p53 monomers lack function, p53 dimers conferred noncanonical tumor-suppressive activities. We describe novel activities for p53 dimers facilitated by PPARs and propose these are "basal" p53 activities. See related commentary by Stieg et al., p. 1046. See related article by Choe et al., p. 1250. This article is highlighted in the In This Issue feature, p. 1027.


Conflict of interest statement

Conflict-of-interest statement:

The authors declare no potential conflicts of interest.

Figures

Figure 1.
Figure 1.. A. Generation of p53RP and p53AD knock-in mouse models.
Mouse p53 exon 10 was independently targeted for Cas9 double strand breaks at the two desired sites (R339 in green, A344 in red) using two different sgRNAs. Donor DNAs contained desired alterations (green or red) and silent mutations (orange). B. Chemical crosslinking using glutaraldehyde (GA) in MEF lysates followed by western blot for p53. p53R245W/R245W MEFs were used as tetrameric p53 control (p53Ctrl). Monomers, ~53 KDa; dimers, ~100 KDa; tetramers, >180KDa. Survival curves for p53 mutant mice from LFS (C) or LOH (D) cohorts (**p=0.0064, ***p=0.0008, ****p<0.0001, ns= not significant). E. Prevalence of thymic lymphomas in p53 mutant mice (LOH cohort) at end point. F. Cellular composition of thymic lymphomas by genotype. CD3 (T-cells, left) and B220 (B-cells, right). p53−/− N=6, p53RP/− N=8, p53AD/− N=3. G. Thymic lymphoma weight by genotype measured as percentage of body weight (* p<0.05).
Figure 2.
Figure 2.. p53AD does not retain canonical stress-induced activities.
A. Flow cytometry for Annexin V-FITC and PI staining of thymocytes. Bar graph shows results summary. B. Cleaved caspase-3 (CC3) immunohistochemistry in thymus (top row) and intestine (bottom row) after IR. Representative figures are shown, taken at 40X magnification). Quantification plots on the right (N=2/group), *p<0.05 C. RNA sequencing of dimer (p53AD/−) and WT (p53+/−) post-IR thymus samples (N=4/group) shows downregulation of p53 signaling pathway in p53AD samples. Blue is downregulation, red is upregulation.
Figure 3.
Figure 3.. p53AD upregulates the PPAR pathway.
A. Volcano plot of DEGs in p53 dimer (p53AD/−) vs p53-null thymi in basal conditions (FDR<0.05, Log2 fold change cut-off of ∣1∣). Green dots: down-regulated genes; red dots, upregulated genes; purple dots, upregulated genes that are PPAR targets (total 33). Right: percentage of upregulated DEGs (top pie chart), and percentage of upregulated DEGs that are direct PPAR targets (p<9.752e−26, bottom pie chart). B. Top 15 upregulated KEGG pathways in p53AD/− vs. p53-null thymi in basal conditions (FDR<0.05). NES is normalized enrichment score. C. qRT-PCR validation of Ppar-α and Ppar-γ upregulation in thymi from homozygous mutant mice (p53AD/4D, dimers) in basal conditions (N=2/genotype), *p<0.05. D. p53AD knockdown in primary thymocytes derived from p53AD/− mice. Left: Western Blot for p53 and tubulin (loading control, quantification of p53 levels below blot). Right: qRT-PCR of p53, Ppar-α, Ppar-γ, and p21 in control (siCtrl) and p53 knockdown (sip53) thymocytes (N=2 mice). **p=0.0077, ***p=0.0002, ***p<0.0001, n.s.= not significant. E. Top 10 transcription factor motifs enriched in differentially open regions from p53AD/− vs p53-null ATAC-seq data (N=3/group). F. p53 immunoprecipitation in p53AD/AD thymus, followed by western blot for p53, PPAR-α, PPAR-γ, and PPAR-δ. All blots were run separately. We used secondary antibodies that do not detect denatured heavy and light IgG chains. G. Top 2 de novo motifs predicted by HOMER for p53AD binding. Genomic regions of p53AD peaks (bottom). Dark blue is 1-2kb promoter (2.44%), green is 2-3kb promoter (1.83%), pink is first exon (3.66%), red is other exon (4.88%), orange is first intron (3.66%), purple is other intron (3.66%), beige is downstream (0.61%), brown is distal intergenic (7.93%). H. Venn diagram for number of genes bound by p53AD and/or PPAR-α by ChIP-seq experiments in basal p53AD/AD thymi. I. Gene ontologies of p53AD and PPAR-α bound genes. GOBP database was used. FDR<0.005.
Figure 4.
Figure 4.. p53AD inhibits CD8+ T-cell accumulation similar to WT p53 in the thymus
A. Single-cell RNA-sequencing of 4-week old thymi from p53+/−, p53AD/−, and p53−/− mice (N=1/genotype). Figure shows merged UMAP graph with labeled clusters. B. UMAP by genotype. C. Quantification of cells per genotype in the CD8+ T-cell cluster. D. Mki67 expression by cluster shows high expression in CD8+ T-cells. E. Upregulated (red) and downregulated (blue) pathways in p53AD/− vs p53−/− CD8+ T-cells. p<0.05. F. Percentage of CD8+ (left) and CD8+ TCRb TCRgd (right) T-cells at 4 weeks (p53+/−, p53AD/−, and p53−/−, N=3) and 10 weeks (normal sized, N=3; or enlarged thymus, N=2; dot color indicates genotype) by flow cytometry.
Figure 5.
Figure 5.. p53AD promotes systemic biological changes.
A. Lipid ontologies affected by p53AD knock-down (KD) in p53AD/− thymocytes treated with siCtrl or sip53 (N=3/group). ES is enrichment score. B. Changes in mitochondrial lipids in thymocytes. CLAMS test in p53−/− (N=3), p53AD/AD (N=4), and p53+/+ (N=4) female mice shows increase in energy expenditure -EE- at nighttime (C), nighttime ambulatory activity (D), nighttime food intake (E), body weight (F), lean mass (G), and minimum respiratory quotient (RQ, or respiratory exchange ratio – RER) (H) in homozygous dimer mutant mice. *p<0.05, **p<0.004, ***p<0.0005. Pathways upregulated in p53AD/− vs p53−/− basal tissues through RNA-seq in pancreas (I), liver (J), intestine (K) (N=3/group). L. Lipid ontologies with changes in blood from p53AD/− vs p53−/− mice (N=2/group). M. Mitochondrial lipid changes in blood from p53AD/− vs p53−/− mice. Cytokine array analysis from 10-week-old basal spleen (N) or pancreas (O) from p53−/− and p53AD/AD mice. Quantification of the most significantly different cytokines per tissue are plotted below.

Comment in

Comment on

References

    1. Wasylishen AR and Lozano G, Attenuating the p53 Pathway in Human Cancers: Many Means to the Same End. Cold Spring Harb Perspect Med, 2016. 6(8). - PMC - PubMed
    1. Riley T, Sontag E, Chen P, and Levine A, Transcriptional control of human p53-regulated genes. Nat Rev Mol Cell Biol, 2008. 9(5): p. 402–12. - PubMed
    1. Moyer SM, Wasylishen AR, Qi Y, Fowlkes N, Su X, and Lozano G, p53 drives a transcriptional program that elicits a non-cell-autonomous response and alters cell state in vivo. Proc Natl Acad Sci U S A, 2020. 117(38): p. 23663–23673. - PMC - PubMed
    1. el-Deiry WS, Kern SE, Pietenpol JA, Kinzler KW, and Vogelstein B, Definition of a consensus binding site for p53. Nat Genet, 1992. 1(1): p. 45–9. - PubMed
    1. Weinberg RL, Veprintsev DB, and Fersht AR, Cooperative binding of tetrameric p53 to DNA. J Mol Biol, 2004. 341(5): p. 1145–59. - PubMed

MeSH terms

Substances