

Persistence of the Omicron variant of SARS-CoV-2 in Australia: The impact of fluctuating social distancing
- PMID: 37068078
- PMCID: PMC10109475
- DOI: 10.1371/journal.pgph.0001427
Persistence of the Omicron variant of SARS-CoV-2 in Australia: The impact of fluctuating social distancing
Abstract
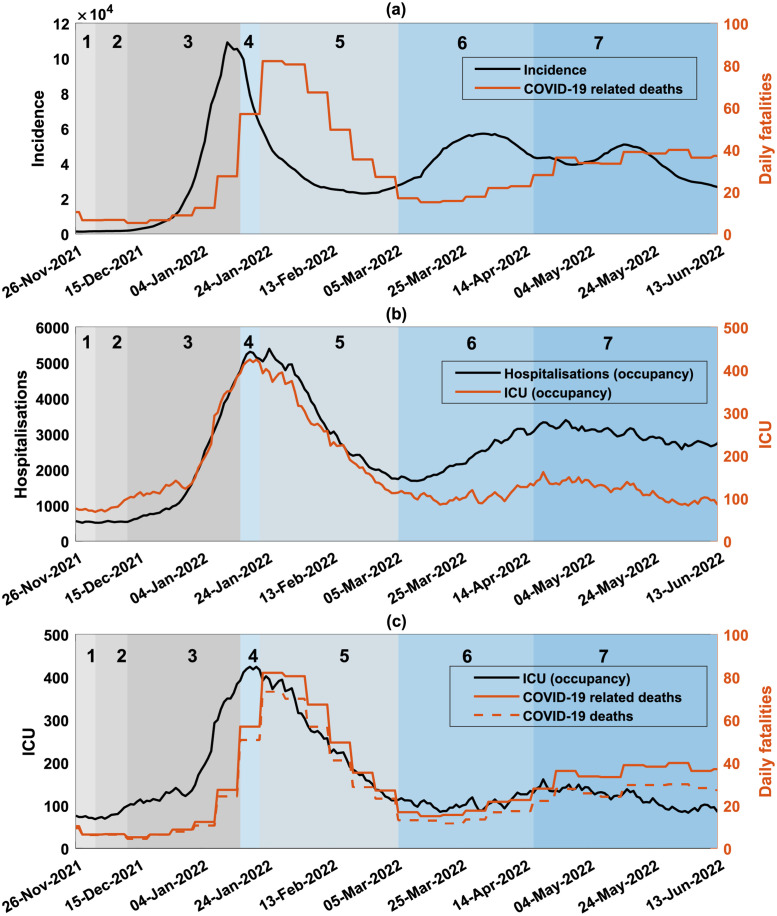
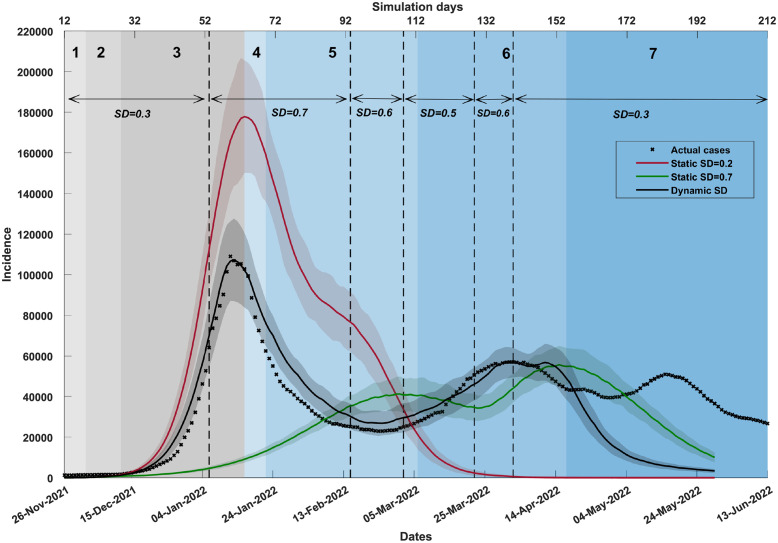
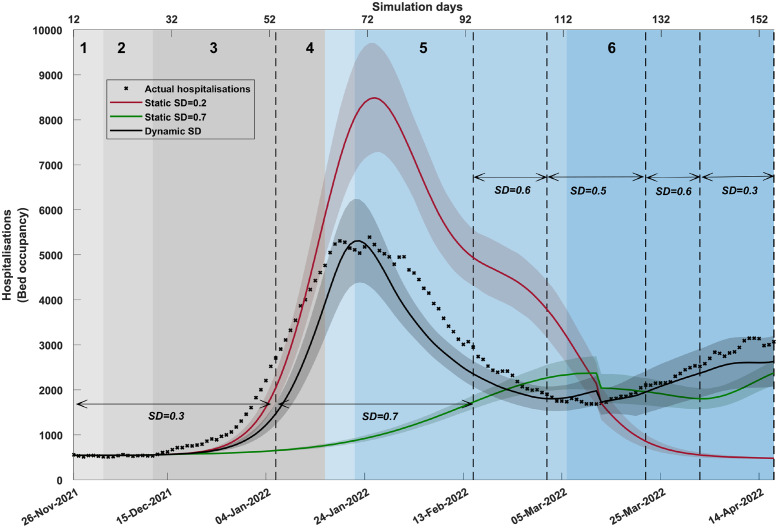
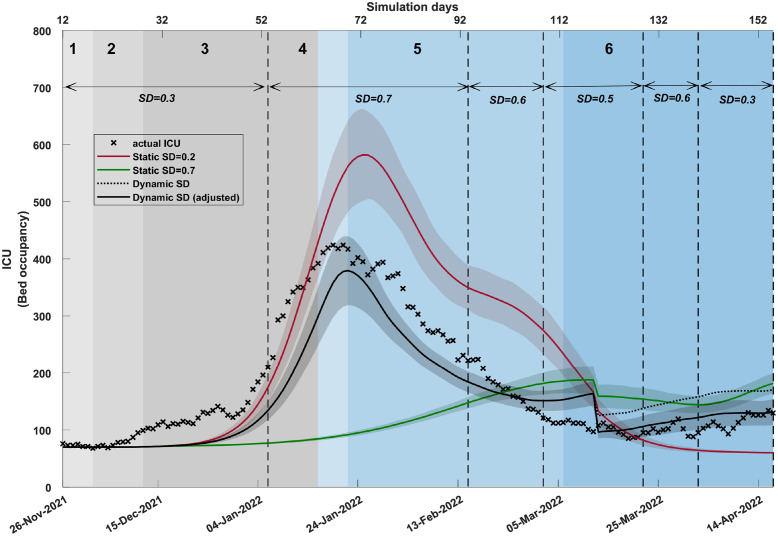
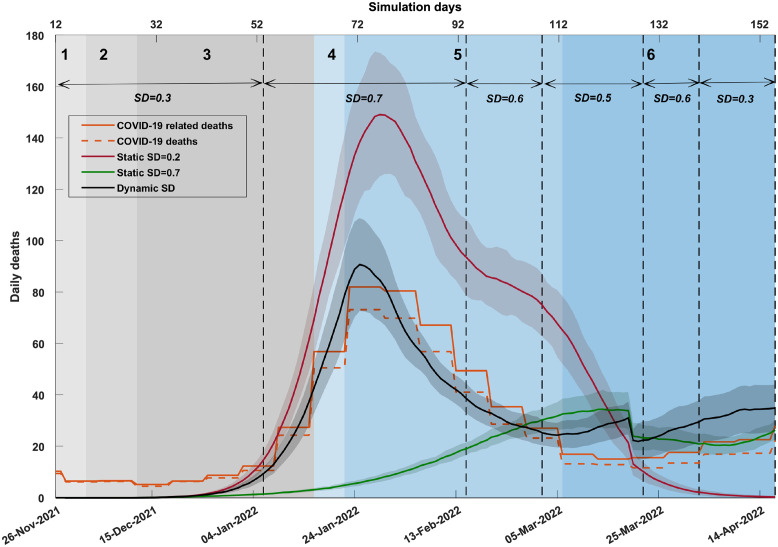
We modelled emergence and spread of the Omicron variant of SARS-CoV-2 in Australia between December 2021 and June 2022. This pandemic stage exhibited a diverse epidemiological profile with emergence of co-circulating sub-lineages of Omicron, further complicated by differences in social distancing behaviour which varied over time. Our study delineated distinct phases of the Omicron-associated pandemic stage, and retrospectively quantified the adoption of social distancing measures, fluctuating over different time periods in response to the observable incidence dynamics. We also modelled the corresponding disease burden, in terms of hospitalisations, intensive care unit occupancy, and mortality. Supported by good agreement between simulated and actual health data, our study revealed that the nonlinear dynamics observed in the daily incidence and disease burden were determined not only by introduction of sub-lineages of Omicron, but also by the fluctuating adoption of social distancing measures. Our high-resolution model can be used in design and evaluation of public health interventions during future crises.
Copyright: © 2023 Chang et al. This is an open access article distributed under the terms of the Creative Commons Attribution License, which permits unrestricted use, distribution, and reproduction in any medium, provided the original author and source are credited.
Conflict of interest statement
The authors have declared that no competing interests exist.
Figures
Similar articles
-
Baseline Sequencing Surveillance of Public Clinical Testing, Hospitals, and Community Wastewater Reveals Rapid Emergence of SARS-CoV-2 Omicron Variant of Concern in Arizona, USA.mBio. 2023 Feb 28;14(1):e0310122. doi: 10.1128/mbio.03101-22. Epub 2023 Jan 9. mBio. 2023. PMID: 36622143 Free PMC article.
-
Molecular evolution of SARS-CoV-2 from December 2019 to August 2022.J Med Virol. 2023 Jan;95(1):e28366. doi: 10.1002/jmv.28366. J Med Virol. 2023. PMID: 36458547 Free PMC article. Review.
-
Trends in Disease Severity and Health Care Utilization During the Early Omicron Variant Period Compared with Previous SARS-CoV-2 High Transmission Periods - United States, December 2020-January 2022.MMWR Morb Mortal Wkly Rep. 2022 Jan 28;71(4):146-152. doi: 10.15585/mmwr.mm7104e4. MMWR Morb Mortal Wkly Rep. 2022. PMID: 35085225 Free PMC article.
-
Replacement dynamics and the pathogenesis of the Alpha, Delta and Omicron variants of SARS-CoV-2.Epidemiol Infect. 2022 Dec 20;151:e32. doi: 10.1017/S0950268822001935. Epidemiol Infect. 2022. PMID: 36535802 Free PMC article.
-
The emergence of SARS-CoV-2 Omicron subvariants: current situation and future trends.Infez Med. 2022 Dec 1;30(4):480-494. doi: 10.53854/liim-3004-2. eCollection 2022. Infez Med. 2022. PMID: 36482957 Free PMC article. Review.
Cited by
-
Defining the correlates of lymphopenia and independent predictors of poor clinical outcome in adults hospitalized with COVID-19 in Australia.Sci Rep. 2024 May 15;14(1):11102. doi: 10.1038/s41598-024-61729-5. Sci Rep. 2024. PMID: 38750134 Free PMC article.
-
Bounded risk disposition explains Turing patterns and tipping points during spatial contagions.R Soc Open Sci. 2024 Oct 2;11(10):240457. doi: 10.1098/rsos.240457. eCollection 2024 Oct. R Soc Open Sci. 2024. PMID: 39359464 Free PMC article.
-
Long Covid Symptom Clusters, Correlates and Predictors in a Highly Vaccinated Australian Population in 2023.Health Expect. 2025 Jun;28(3):e70273. doi: 10.1111/hex.70273. Health Expect. 2025. PMID: 40342248 Free PMC article.
-
Emergence of shield immunity during spatial contagions.Npj Complex. 2025;2(1):19. doi: 10.1038/s44260-025-00044-0. Epub 2025 Jun 4. Npj Complex. 2025. PMID: 40612878 Free PMC article.
-
Measuring unequal distribution of pandemic severity across census years, variants of concern and interventions.Popul Health Metr. 2023 Oct 29;21(1):17. doi: 10.1186/s12963-023-00318-6. Popul Health Metr. 2023. PMID: 37899455 Free PMC article.
References
-
- World Health Organization. Classification of Omicron (B.1.1529): SARS-CoV-2 Variant of Concern; 2021. https://www.who.int/news/item/26-11-2021-classification-of-omicron-(b.1.....
-
- Department of Health, NSW. COVID-19 weekly surveillance reports—Archive; 2022. https://www.health.nsw.gov.au/Infectious/covid-19/Pages/weekly-reports-a....
LinkOut - more resources
Full Text Sources
Miscellaneous