. 2023 Apr 17;19(4):e1010724.
doi: 10.1371/journal.pgen.1010724. eCollection 2023 Apr.

A frame-shift mutation in COMTD1 is associated with impaired pheomelanin pigmentation in chicken

Affiliations

A frame-shift mutation in COMTD1 is associated with impaired pheomelanin pigmentation in chicken

Huijuan Bi et al. PLoS Genet. .

Abstract

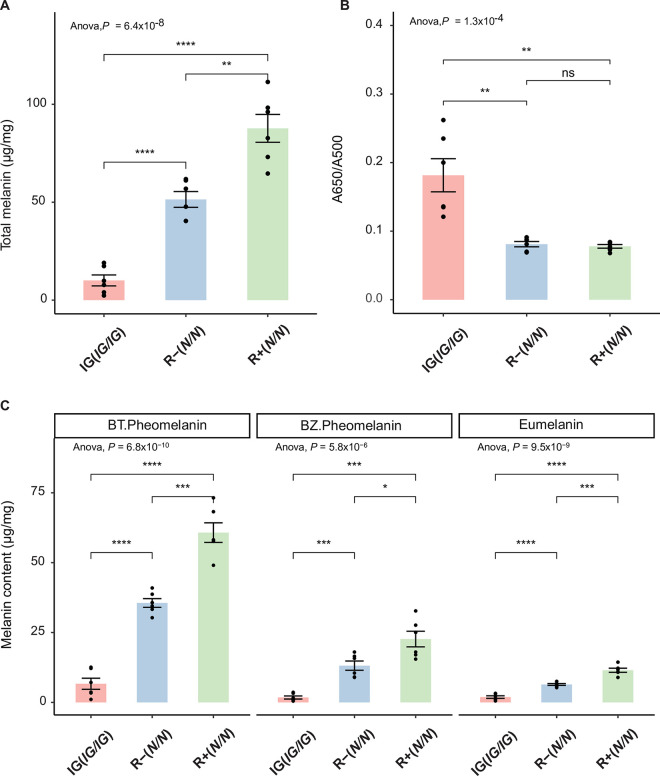
The biochemical pathway regulating the synthesis of yellow/red pheomelanin is less well characterized than the synthesis of black/brown eumelanin. Inhibitor of gold (IG phenotype) is a plumage colour variant in chicken that provides an opportunity to further explore this pathway since the recessive allele (IG) at this locus is associated with a defect in the production of pheomelanin. IG/IG homozygotes display a marked dilution of red pheomelanin pigmentation, whilst black pigmentation (eumelanin) is only slightly affected. Here we show that a 2-base pair insertion (frame-shift mutation) in the 5th exon of the Catechol-O-methyltransferase containing domain 1 gene (COMTD1), expected to cause a complete or partial loss-of-function of the COMTD1 enzyme, shows complete concordance with the IG phenotype within and across breeds. We show that the COMTD1 protein is localized to mitochondria in pigment cells. Knockout of Comtd1 in a mouse melanocytic cell line results in a reduction in pheomelanin metabolites and significant alterations in metabolites of glutamate/glutathione, riboflavin, and the tricarboxylic acid cycle. Furthermore, COMTD1 overexpression enhanced cellular proliferation following chemical-induced transfection, a potential inducer of oxidative stress. These observations suggest that COMTD1 plays a protective role for melanocytes against oxidative stress and that this supports their ability to produce pheomelanin.


Conflict of interest statement

No competing interest.

Figures

Fig 1
Fig 1. Illustration of plumage phenotypes associated with different genotypes at the Inhibitor of gold locus in chicken on different genetic backgrounds.
The birds in (A) and (B) carry the bottom recessive wheaten allele (Y) at the MC1R locus and shows red pheomelanin-based pigmentation. The birds in (C) and (D) carry the brown allele (B) at the same locus that allows expression of both eumelanin and pheomelanin and IG dilution is apparent as regards pheomelanin pigmentation. (A) and (B) depict F2 birds from the mapping pedigree with the wild-type phenotype or the recessive IG phenotype (IG/IG), respectively. (C) and (D) depict two IG/IG birds from the Lemon Millefleur Sabelpoot (Fig 1C) and Sebright-Lemon (Fig 1D) breeds, respectively. Photo by Michèle Tixier-Boichard (A and B) and C and D were taken by Nicolas Bruneau, INRAE.
Fig 2
Fig 2. Chemical characterization of feather melanin.
(A) depicts levels of total melanin in wild-type birds (R+ and R-) and in IG birds analyzed by Soluene-350 solubilization. (B) depicts A650/A500 ratios analyzed by Soluene-350 solubilization. (C) depicts eumelanin (EM), benzothiazine-pheomelanin (BT-PM), and benzothiazole-pheomelanin (BZ-PM) analyzed as PTCA, 4-AHP, and TTCA, respectively. Feather samples were obtained from neck regions from 3 males and 3 females. Results are shown with the means ± SEM of 6 birds. ns: not significant, P > 0.05; *: P < 0.05; **: P <0.01; ***: P <0.001; ****: P <0.0001 (Student’s t test).
Fig 3
Fig 3. Gene content of the IG interval.
The annotation is based on the chicken genome assembly as presented on the UCSC sequence browser. Both the larger (433 kb) and the smaller (262 kb) IBD regions associated with the IG allele are marked.
Fig 4
Fig 4. RT-PCR analysis of COMTD1 using mRNA from feather follicles and protein sequence alignment of COMTD1 homologs.
(A) Agarose gel electrophoresis of COMTD1 RT-PCR products from feather follicles representing all three possible Ig genotypes. The wild-type (N) allele expresses only the full-length transcript while two transcripts is expressed from the IG allele. (B) The annotated COMTD1 gene with the wild-type transcript (COMTD1N) together with the two COMTD1 transcripts (COMTD1IG1 and COMTD1IG2) transcribed from the IG-allele. The bottom track shows vertebrate sequence conservation scores from the USCS browser. (C) Clustal X alignment of predicted COMTD1 sequence in chicken (Gallus gallus)–including the putative protein products of COMTD1IG1 and COMTD1IG2 and homologs in zebra finch (Taeniopygia guttata), anolis lizard (Anolis carolinensis), green pufferfish (Tetraodon nigroviridis), dog (Canis familiaris), mouse (Mus musculus), human (Homo sapiens) and salmon (Salmo salar). Dots (.) indicate identity to the full-length chicken master sequence. The arrows indicate amino acids that are in direct contact with the cofactor, SAM, based on the crystal structure model of COMTD1 (Protein Database accession number: 2AVD). The black square indicates the putative O-methyltransferase domain.
Fig 5
Fig 5. HA-tagged COMTD1 localizes to mitochondria in immortalized mouse melanocytes.
(A-D) Immortalized melan-Ink4a cells from Ink4a-deficient C57BL/6J mice were transiently transfected to express COMTD1 fused with the HA11 epitope at either the N-terminus (HA-COMTD1; A, C) or C-terminus (COMTD1-HA; B, D). Two days later, cells were fixed and analyzed by bright field (BF) and immunofluorescence microscopy for HA and either the mitochondrial resident protein MAVS (A, B) or the ER resident protein calnexin (CNX; C, D). Individual images of labelled cells or the bright field image are shown in addition to an overlay of HA (green) with MAVS (red; HA/ MAVS), CNX (red; HA/ CNX), or the pseudocolored bright field image (magenta; HA/BF). Insets show a 5-fold magnified image of the boxed region to emphasize overlap or lack thereof. Main scale bar, 10 μm; inset scale bar, 2 μm. (E) Quantification of the degree of overlap of COMTD1-HA or HA-COMTD1, as indicated, with markers of the ER (CNX; N = 29 for COMTD1-HA, N = 17 for HA-COMTD1), mitochondria (MAVS; N = 25 for COMTD1-HA, N = 16 for HA-COMTD1), mature melanosomes (TYRP1; N = 16), immature melanosomes (PMEL; N = 17), late endosomes/ lysosomes (LAMP2; N = 15), or early endosomes (STX13; N = 21). Data from 4–5 individual experiments are presented as a box and whiskers plot in which the area of overlap is shown relative to the total area occupied by HA (e.g., CNX vs. HA) or by the indicated marker (e.g., HA vs. CNX). See S2 Fig for examples of the data for TYRP1, PMEL, LAMP2 and STX13. Statistical significance was determined by ordinary one-way ANOVA with Tukey’s tests for multiple comparisons; ****, P < 0.0001.
Fig 6
Fig 6. CRISPR/Cas9 mediated inactivation of Comtd1 in B16F10 cells.
(A) Schematic description of CRISPR/Cas9 mediated inactivation of murine Comtd1. Black bars indicate the target sites of two gRNAs in the exons of Comtd1. Yellow arrow indicates a 236bp deletion introduced by paired sgRNAs. The primer pair indicated by red arrows is used for amplifying genomic DNA. (B) Six colonies retrieved from Comtd1 knockout in B16F10 cells. The PAM sequence is in red. Dash (-) indicates deleted nucleotides. The top one is wild type and the others are KO clones, of which, three lines (KO1, KO2, KO3) were generated using sgRNA1, one line was generated using sgRNA2, and the last two lines carrying 236bp deletion were generated by the sgRNA pair. (C) Western blot analysis of whole-cell lysates prepared from six COMTD1 knockout clones and one WT cell line using antibodies against COMTD1 and the control β-actin. (D) Quantitative RT-PCR analysis of Comtd1 expression in KO and WT cell lines. Date are presented as mean ± SD (n = 3 biological replicates). (E) Cell growth curves of KO (grey) and WT (black) were recorded by the Incucyte Zoom live-cell imaging system and data are expressed as cell confluence (%; mean ± SEM, n = 6 in KO, n = 3 in WT).
Fig 7
Fig 7. Metabolomics analysis reveal several metabolic pathways involved in oxidative stress that are altered in Comtd1-KO B16F10 cells.
(A) Schematic representation of possible impact on biosynthesis of pheomelanin by COMTD1. Upregulated metabolites are highlighted in red and downregulated in blue. The solid and dashed lines denote significant and nonsignificant difference, respectively. (B-D) Mass spectrometric peak intensity of the corresponding metabolites in wild-type and knockout cell lines. Data are presented as mean ± SD from experimental replicates (N = 6 in KO; N = 12 in WT). ns: not significant, P > 0.05; *: P < 0.05; **: P <0.01; ***: P <0.001. Peak intensity of metabolites was acquired by UPLC-MS analysis.
Fig 8
Fig 8. Proliferation curves of wild-type and Comtd1 null B16F10 cell lines after transfection.
A-B, Proliferation curves of Comtd1 WT (A) and Comtd1 KO B16F10 cell lines (B) after introducing either COMTD1 expression vector (Circle) or its corresponding empty vector pcDNA3.1 (triangle). Growth was recorded by the Incucyte Zoom live-cell imaging system and data are expressed as cell confluence (%; mean ± SEM, n = 4 in KO, n = 2 in WT). **: P <0.01; ***: P <0.001.

Similar articles

Cited by

References

    1. Lin JY, Fisher DE. Melanocyte biology and skin pigmentation. Nature. 2007;445:843–50. doi: 10.1038/nature05660 . - DOI - PubMed
    1. Ito S, Wakamatsu K. Quantitative analysis of eumelanin and pheomelanin in humans, mice, and other animals: a comparative review. Pigment Cell Res. 2003;16:523–31. doi: 10.1034/j.1600-0749.2003.00072.x . - DOI - PubMed
    1. Zadlo A, Szewczyk G, Sarna M, Camenisch TG, Sidabras JW, Ito S, et al.. Photobleaching of pheomelanin increases its phototoxic potential: Physicochemical studies of synthetic pheomelanin subjected to aerobic photolysis. Pigment Cell Melanoma Res. 2019;32:359–72. doi: 10.1111/pcmr.12752 . - DOI - PubMed
    1. Tanaka H, Yamashita Y, Umezawa K, Hirobe T, Ito S, Wakamatsu K. The Pro-oxidant activity of pheomelanin is significantly enhanced by UVA irradiation: Benzothiazole moieties are more reactive than Benzothiazine moieties. Int J Mol Sci. 2018;19. doi: 10.3390/ijms19102889 . - DOI - PMC - PubMed
    1. Chedekel MR, Agin PP, Sayre RM. Photochemistry of pheomelanin: action spectrum for superoxide production. Photochem Photobiol. 1980;31:553–5. doi: 10.1111/j.1751-1097.1980.tb03745.x - DOI

Publication types