. 2023 May 2;56(9):1031-1042.
doi: 10.1021/acs.accounts.3c00030. Epub 2023 Apr 17.

Digital and Absolute Assays for Low Abundance Molecular Biomarkers

Affiliations

Digital and Absolute Assays for Low Abundance Molecular Biomarkers

Chia-Wei Kuo et al. Acc Chem Res. .

Abstract

There has been a recent surge of advances in biomolecular assays based on the measurement of discrete molecular targets as opposed to signals averaged across molecular ensembles. Many of these "digital" assay designs derive from now-mature technologies involving single-molecule imaging and microfluidics and provide an assortment of new modalities to quantify nucleic acids and proteins in biospecimens such as blood and tissue homogenates. A primary new benefit is the robust detection of trace analytes at attomolar to femtomolar concentrations for which many ensemble assays cannot distinguish signals above noise levels. In addition, multiple biomolecules can be differentiated within a mixture using optical barcodes, with much faster and simpler readouts compared with sequencing methods. In ideal digital assays, signals should, in theory, further represent absolute molecular counts, rather than relative levels, eliminating the need for calibration standards that are the mainstay of typical assays. Several digital assay platforms have now been commercialized but challenges hinder the adoption and diversification of these new formats, as there are broad needs to balance sensitivity and dynamic range of detection, increase analyte multiplexing, improve sample throughput, and reduce cost. Our lab and others have developed technologies to address these challenges by redesigning molecular probes and labels, improving molecular transport within detection focal volumes, and applying solution-based readout methods in flow.This Account describes the principles, formats, and design constraints of digital biomolecular assays that apply optical labels toward the goal of simple and routine target counting that may ultimately approach absolute readout standards. The primary challenges can be understood from fundamental concepts in thermodynamics and kinetics of association reactions, mass transport, and discrete statistics. Major advances include (1) new inorganic nanocrystal probes for more robust counting compared with dyes, (2) diverse molecular amplification tools that endow attachment of numerous labels to single targets, (3) specialized surfaces with patterned features for electromagnetic coupling to labels for signal amplification, (4) surface capture enhancement methods to concentrate targets through disruption of diffusion depletion zones, and (5) flow counting in which analytes are rapidly counted in solution without pull-down to a surface. Further progress and integration of these tools for biomolecular counting could improve the precision of laboratory measurements in life sciences research and benefit clinical diagnostic assays for low abundance biomarkers in limiting biospecimen volumes that are out of reach of traditional ensemble-level bioassays.


Figures

Figure 1.
Figure 1.
Examples of analog molecular assays and commercialized digital assay platforms. (a) Surface-capture analog assay showing protein target capture and labeling with antibodies in wells with typical sizes near 2.5 mm. Calibration standards are used to convert ensemble well intensities to target concentrations. (b) Nanostring nCounter. Surface-captured target nucleic acids are labeled with a reporter probe which further binds to numerous fluorescent probes functioning as a digital fluorescent barcode that is linearized by an electric field. High-resolution multicolor imaging allows counting and identification of multiple distinct targets. (c) Quanterix single-molecule array (Simoa). Antigens are captured by antibodies on a microbead, labeled using enzyme-conjugated antibodies, and then isolated in arrayed femtoliter microwells. Colorimetric readouts of the enzymes allow digital counting of single protein targets. Distinct colors of fluorescent beads bound to different antibodies can be used to identify different proteins. (d) Droplet digital PCR. Individual nucleic acid targets and PCR reagents are compartmentalized in single aqueous nanoliter droplets. PCR-based amplification results in either positive or negative fluorescence intensity in each droplet. Readout of individual droplets is performed in a flow stream or through imaging.
Figure 2.
Figure 2.
Comparison between digital and analog fluorescence-based surface-capture assays and their integration. (a) Digital counts and analog intensity measurements are shown for microRNA-375 targets labeled with dye-based probes after rolling circle amplification (RCA). Analog intensities are calibrated to digital counts using the method shown in panel b. (b) Fluorescently labeled targets on a surface are imaged at high resolution. Low-intensity images are analyzed digitally using a spot-detection algorithm that identifies PSFs to measure the average spot intensity (IS). For high-intensity images, pixel intensities are calibrated to spot counts using IS, the number of pixels (Np), and the average pixel intensity with target (I+) and without target (I_). Adapted with permission from ref . Copyright 2018 American Chemical Society.
Figure 3.
Figure 3.
Photophysical properties of avidin-conjugated fluorophores for single-molecule surface-capture counting assays. (a) Extinction coefficient (ε) spectra and fluorescence emission spectra (FL) are shown for a dye (red), QD (orange), PE protein (green), and bead (blue). (b) Widefield single-molecule fluorescence images of labels sparsely bound to coverglass. (c) Spot detection counts are shown for different PSF detection thresholds for bare coverglass (gray) and coverglass with several hundred fluorophores per field of view (black). The red line indicates the difference between the two. Error bars indicate standard deviation. Adapted with permission from ref . Copyright 2018 American Chemical Society.
Figure 4.
Figure 4.
Controlling emission wavelength to enhance signal-to-noise ratio for digital target counting. (a) Images of cells labeled with epidermal growth factor (EGF) bound to either a dye or QD with 3 emission wavelengths (565, 605, or 744 nm). Brightfield (B.F.) micrographs are overlaid with nuclear stain (blue). Blackboxes indicate zoomed-in areas in fluorescence images. Yellow arrows indicate background fluorescence; red arrows indicate single dye or QD. (b) Fluorescence spectra of mean background, dye, and QDs. (c) Intensities of background, single dyes, and single QDs in each spectral band. Gray corresponds to background and color corresponds to specific signals of labeled foci. (d) Receiver operating characteristic (ROC) curves show higher detection accuracy of single QD744 (dark red) compared with dye (blue), QD565 (green), and QD605 (orange) amid background signals from cells. Numbers show area under the ROC curve. Adapted with permission from ref . Published 2019 by Springer Nature under a Creative Commons Attribution 4.0 International License.
Figure 5.
Figure 5.
Examples of amplification methods to enhance digital molecular readouts. (a) Fluorescence in situ hybridization using ssDNA–dye (top row) or ssDNA–QD (bottom row) probes for glyceraldehyde-3-phosphate dehydrogenase (GAPDH) mRNA in fixed HeLa cells. Fluorescence micrographs show mRNA foci (red) and nuclei (blue). (b) Intensity histograms are shown for FISH spots (black) and single fluorophores (gray). (c) Counts per cell are shown with different PSF detection thresholds for FISH (blue) or cells without labels (red), with flatter curves for QDs indicating higher count fidelity. Shading indicates standard deviation. (d) Fluorescence images and spot intensities of single fluorescent molecules (PE) in comparison with (e) RCA-amplified nucleic acids labeled with PE. The schematic depicts numerous PE labels per target molecule. (f) Intensity histograms are shown for targets labeled with PE (cyan) or RCA-PE (red) compared with background (gray). Adapted with permission from refs and . Copyright 2018 American Chemical Society and published 2018 by Springer Nature under a Creative Commons Attribution 4.0 International License.
Figure 6.
Figure 6.
Impact of off-target molecules and tag affinity, showing equilibrium calculations. (a) Schematic depiction of a probe bearing a 13 nucleotide (nt) tag that binds to a target sequence or a single-base mismatch. (b) Counts per microliter for the indicated probe concentrations with target present at 1000 copies μL−1, calculated for tag lengths between 7 and 15 nt. (c) Counts per microliter for target or single-base mismatch at 1000 copies μL−1 with 13 nt tag. (d) Target-to-mismatch count ratio with both target and single-base mismatch present at 1000 copies μL−1. (e) Counts at the indicated target concentrations with different off-target sequences present at the indicated ratios from 1:0 to 1:50 with 10,000 probes μL−1. Values in panels b–e were calculated from the simple thermodynamic models depicted in panel a.
Figure 7.
Figure 7.
Sampling and surface-capture considerations for attomolar digital assays. (a) Dependence of target counts on sample volume from 0.1 nL to 100 μL, assuming samples collected randomly from biospecimens with concentrations from 1 aM to 100 fM. Shaded regions are 90% prediction intervals of the Poisson distribution. (b) Surface capture dependence on time and solution thickness. Random walks of 60 individual molecules were simulated in a 10 μL (1 aM) volume with thickness from 0.5 mm to 10 mm above a flat capture surface. Diffusion coefficient corresponds to that of a 22-mer RNA (138 μm2 s−1). Counts correspond in time for target collisions with the surface, assuming instantaneous, irreversible binding. (c) Enhancement of mass transport of trace targets to surfaces using an aqueous two-phase system of saline (salt phase) and poly(ethylene glycol) (PEG phase) that condenses the targets to the surface. (d) Nanoporous substrates eliminate nonslip layers on surfaces for more efficient surface-capture. Fluid near the surface can flow through surface pores (red lines) to increase the rate of capture. (e) Three-dimensional single molecule deconvolution microscopy image analysis to digitally count molecules in 3D substrates such as single cells across a z-height of 20 μm or more. (f) Photonic crystal capture surface propagates evanescent waves from line-scanned excitation beams to enhance the emission of proximal QDs for digital counting of surface-captured targets in an excess of unbound QD probes in solution. Adapted with permission from refs , , and . Published 2019 and 2022 by Springer Nature under a Creative Commons Attribution 4.0 International License and Copyright 2021 American Chemical Society.
Figure 8.
Figure 8.
Digital counting of nucleic acids by single-molecule flow analysis. (a) Schematic illustration depicting labeling of RCA products with fluorescent probes and counting using a flow cytometer. (b, c) Scatter plots show detected events for microRNA RCA amplicons labeled with both ssDNA–dye probes (Cy3 and Cy5) and intercalating dye SYBR Green, with an additional measure of side scattering. Black lines indicate gates of specific events. (d) Counts measured for indicated microRNA concentrations. Red line indicates linear dynamic range. (e) Fluorophore absorbance (A, red) and fluorescence (FL, blue) spectra for dyes to create optical barcodes. Gray highlight indicates emission bandpass filters. (f) Events in 2-color ratiometric channels using Cy3 and Cy5 dye combinations. (g) Intensity distribution of RCA products calibrated to the number of bound ssDNA–dye is shown in comparison with (h) the calculated number of free dye–ssDNA probes remaining in the focal volume for different target concentrations (3,000 fL focal volume). (i) Dependence of RCA product detection efficiency on target concentration in different focal volumes. Adapted with permission from ref . Copyright 2020 American Chemical Society.

Similar articles

Cited by

References

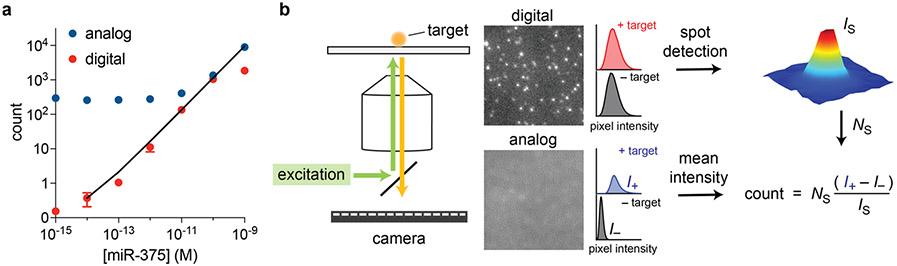
    1. Smith L; Kohli M; Smith AM Expanding the Dynamic Range of Fluorescence Assays through Single-Molecule Counting and Intensity Calibration. J. Am. Chem. Soc 2018, 140 (42), 13904–13912.

      Continuity of dynamic range across digital and ensemble fluorescence assays is achieved by calibrating single molecule intensities on an imaging substrate.

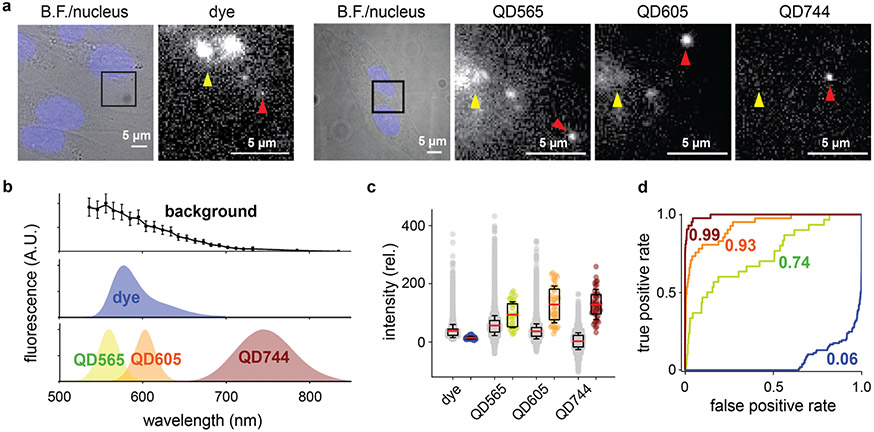
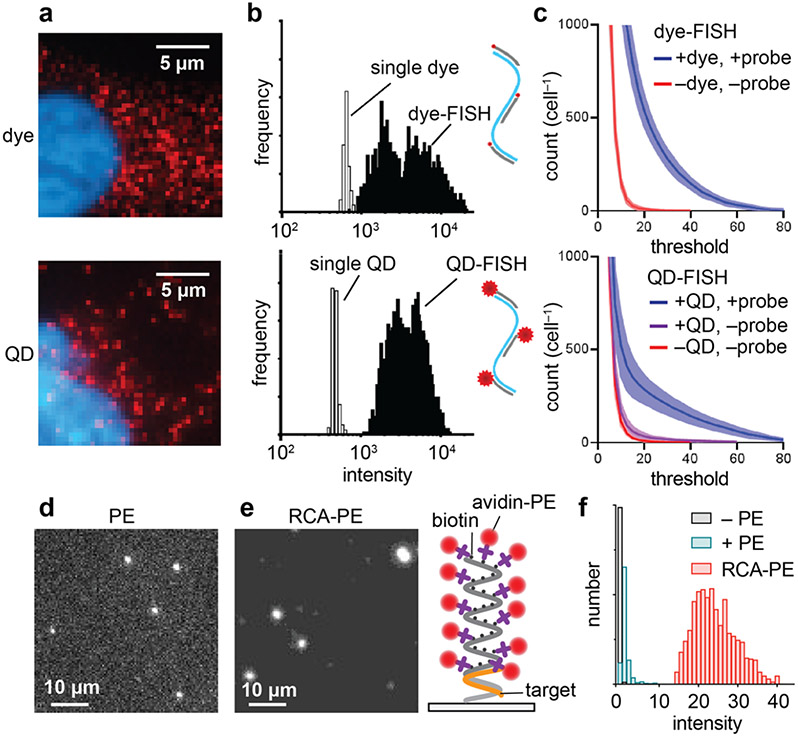
    1. Le P; Lim SJ; Baculis BC; Chung HJ; Kilian KA; Smith AM Counting Growth Factors in Single Cells with Infrared Quantum Dots to Measure Discrete Stimulation Distributions. Nat. Commun 2019, 10 (1), 909.

      Absolute counting of labeled proteins is achieved in single cells through three-dimensional imaging of individual quantum dots.

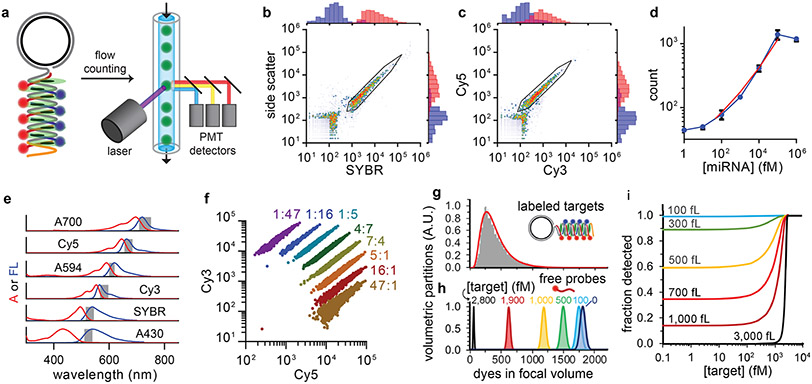
    1. Smith LD; Liu Y; Zahid MU; Canady TD; Wang L; Kohli M; Cunningham BT; Smith AM High-Fidelity Single Molecule Quantification in a Flow Cytometer Using Multiparametric Optical Analysis. ACS Nano 2020, 14 (2), 2324–2335.

      Flow counting is used to quantify nucleic acids that are enzymatically extended and labeled with dyes without purification.

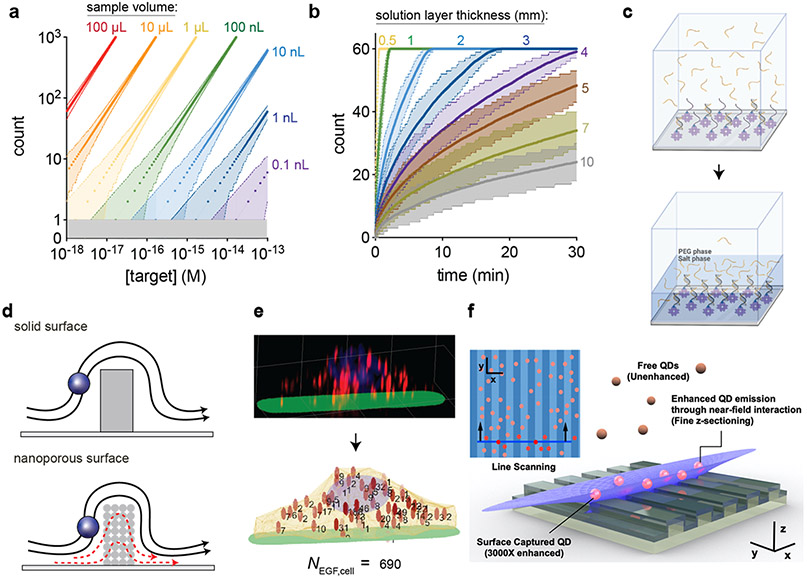
    1. Xiong Y; Huang Q; Canady TD; Barya P; Liu S; Arogundade OH; Race CM; Che C; Wang X; Zhou L; Wang X; Kohli M; Smith AM; Cunningham BT Photonic Crystal Enhanced Fluorescence Emission and Blinking Suppression for Single Quantum Dot Digital Resolution Biosensing. Nat. Commun 2022, 13 (1), 4647.

      Photonic crystal surfaces improve the sensitivity of digital surface capture assays to allow the use of low numerical aperture objectives and inexpensive optical setups.

    1. Lequin RM Enzyme Immunoassay (EIA)/Enzyme-Linked Immunosorbent Assay (ELISA). Clin. Chem 2005, 51 (12), 2415–2418. - PubMed

Publication types