. 2023 Apr 25;120(17):e2205576120.
doi: 10.1073/pnas.2205576120. Epub 2023 Apr 17.

Fear circuit-based neurobehavioral signatures mirror resilience to chronic social stress in mouse

Affiliations

Fear circuit-based neurobehavioral signatures mirror resilience to chronic social stress in mouse

Sarah Ayash et al. Proc Natl Acad Sci U S A. .

Abstract

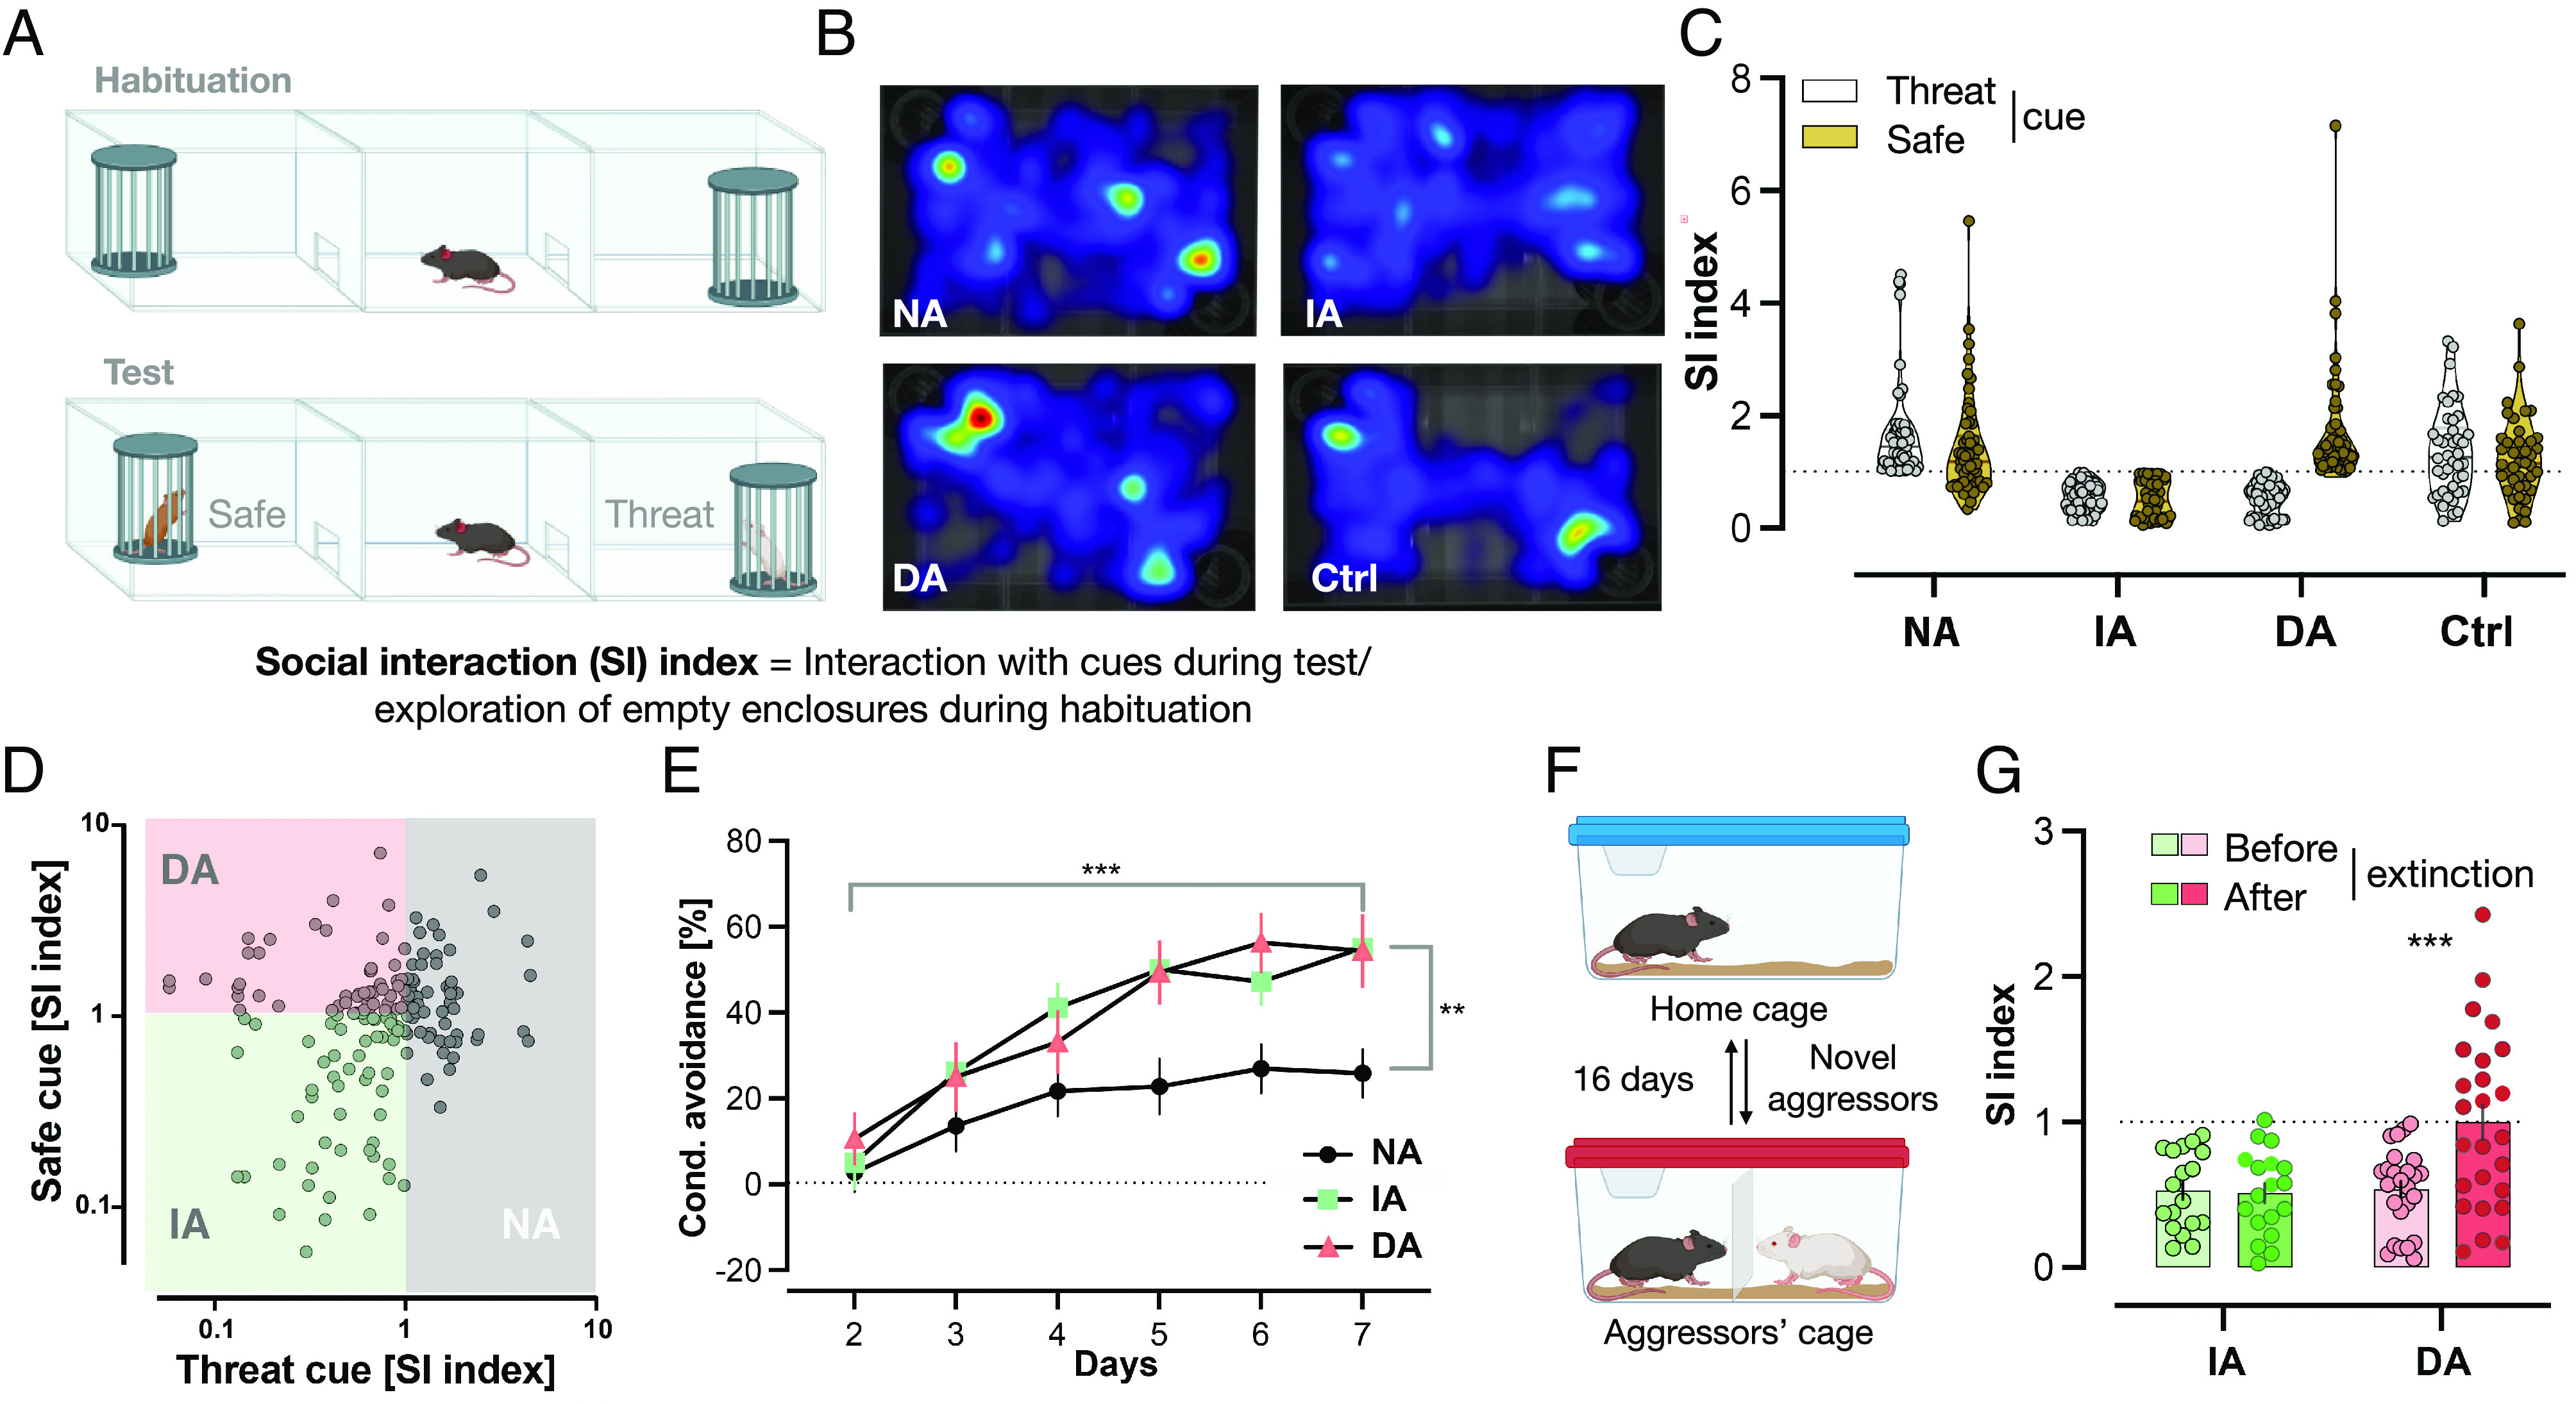
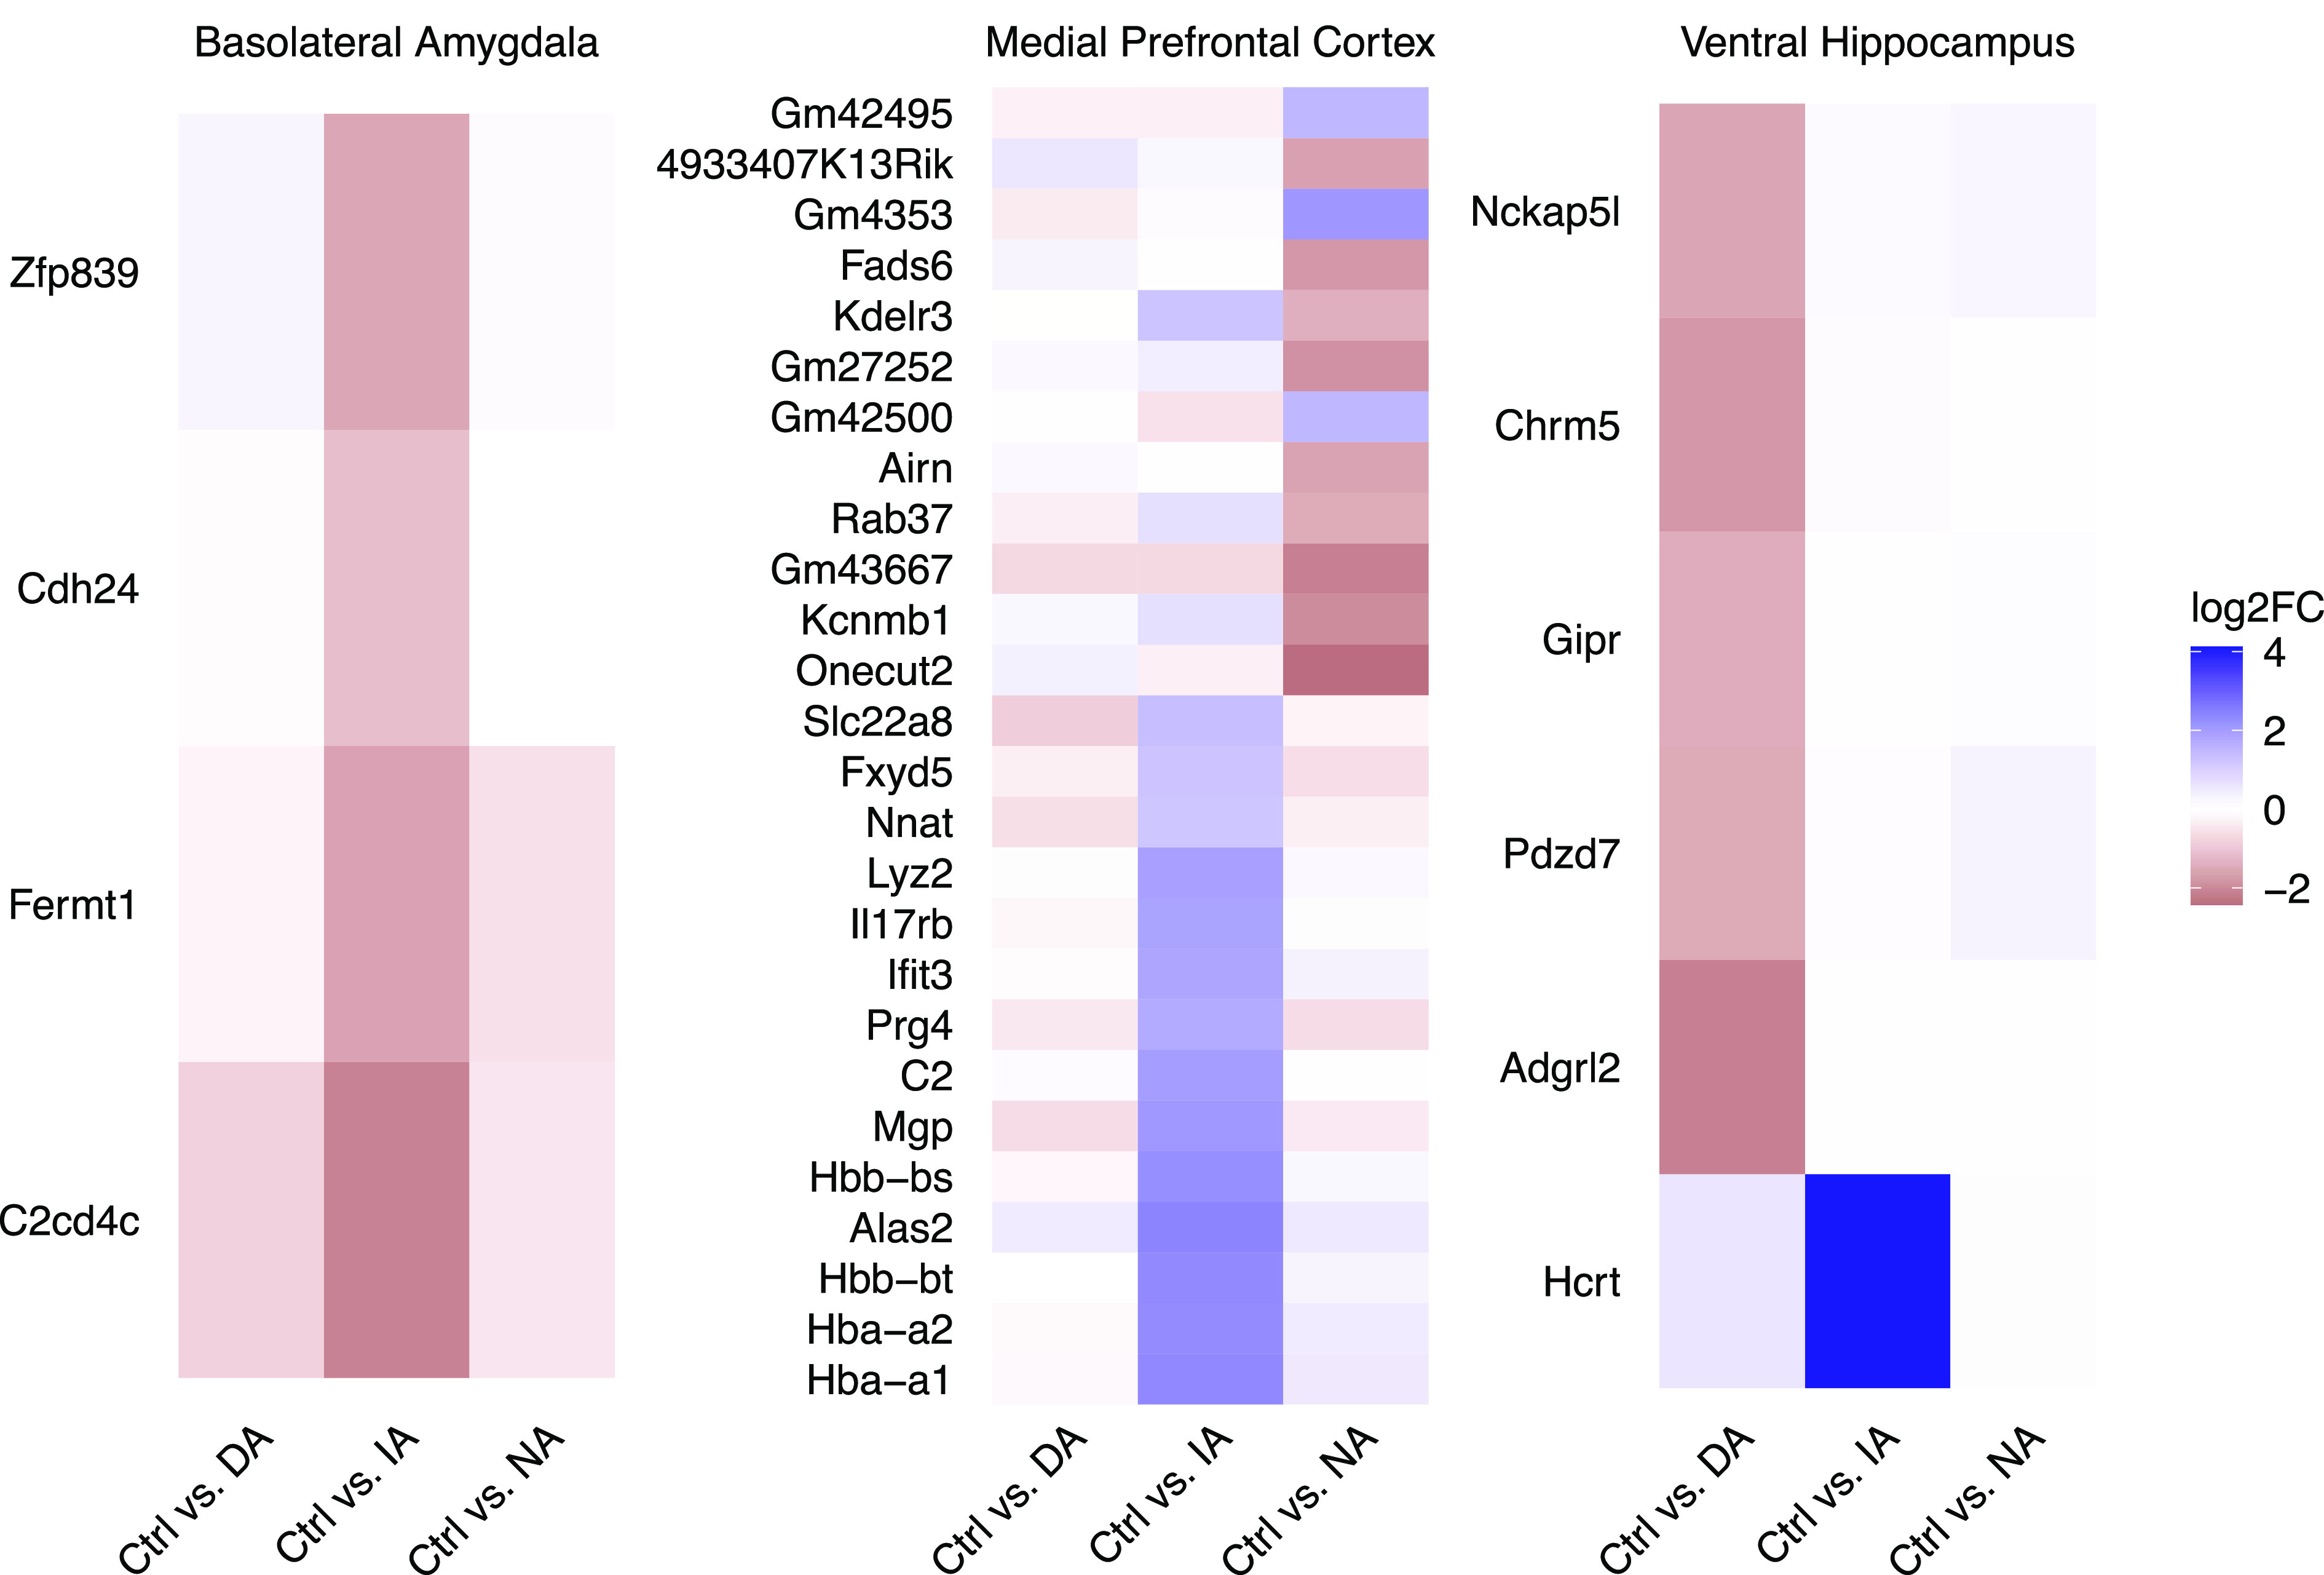
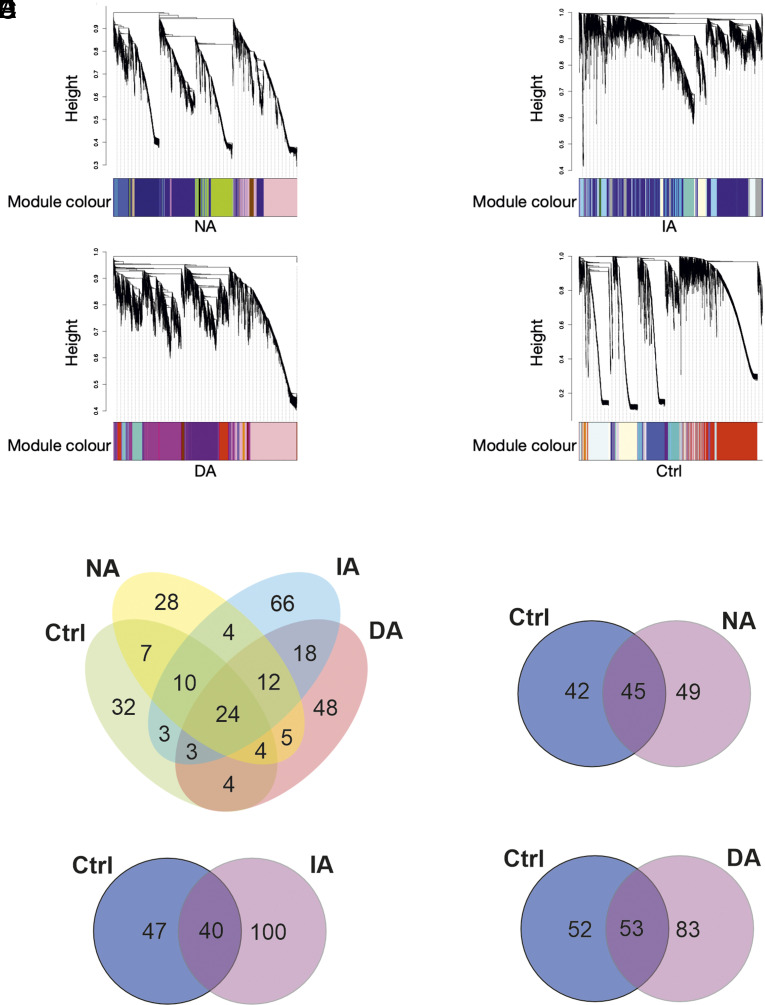
Consistent evidence from human data points to successful threat-safety discrimination and responsiveness to extinction of fear memories as key characteristics of resilient individuals. To promote valid cross-species approaches for the identification of resilience mechanisms, we establish a translationally informed mouse model enabling the stratification of mice into three phenotypic subgroups following chronic social defeat stress, based on their individual ability for threat-safety discrimination and conditioned learning: the Discriminating-avoiders, characterized by successful social threat-safety discrimination and extinction of social aversive memories; the Indiscriminate-avoiders, showing aversive response generalization and resistance to extinction, in line with findings on susceptible individuals; and the Non-avoiders displaying impaired aversive conditioned learning. To explore the neurobiological mechanisms underlying the stratification, we perform transcriptome analysis within three key target regions of the fear circuitry. We identify subgroup-specific differentially expressed genes and gene networks underlying the behavioral phenotypes, i.e., the individual ability to show threat-safety discrimination and respond to extinction training. Our approach provides a translationally informed template with which to characterize the behavioral, molecular, and circuit bases of resilience in mice.

Keywords: extinction; fear circuit; mouse model; threat–safety discrimination; transcriptional signatures.


Conflict of interest statement

The authors have organizational affiliations to disclose, Raffael Kalisch received advisory honoraria from JoyVentures.

Figures

Fig. 1.
Fig. 1.
The STST identifies three distinct phenotypes within a defeated group. (A) STST: Following the habituation phase, the testing phase took place where two novel cues were presented with one belonging to the same strain that defeated the mice during CSD days (threat), while the other belonging to a novel strain (safe). (B) Differing occupancy of areas within the arena between the different subgroups: Representative heatmaps of each subgroup during the testing phase of STST. Darker colors indicate more time spent in the area. (C) STST identifies three phenotypic subgroups within a single defeated group: Mice with a social interaction index ≥1 with the threat-associated cue were termed Non-avoiders (NA; n = 55), mice with a social interaction index <1 with both strains were termed Indiscriminate-avoiders (IA; n = 54), and mice with a social interaction index ≥1 only with the safe cue were termed Discriminating-avoiders (DA; n = 56). Nondefeated Control (Ctrl; n = 42) had similar indices with both strains. Results are presented as truncated violin plots. Each animal is represented by two data points, one with each cue. (D) Scatter plot of the same data from C. (E) Non-avoiders show impairment in conditioned learning of aversive cues: All Defeated subgroups had a significant increase in conditioned avoidance response% throughout the training days; however, the Non-avoiders did so to a lesser extent with a significantly lower value on the seventh (last) day compared to the other two subgroups. Results are presented as mean ± SEM, two-way ANOVA, days: F (5, 160) = 46.27, < 0.0001***, subgroups: F(2, 32) = 4.359, P = 0.0212*, interaction: F(10, 160) = 3.042, P = 0.0015**. Bonferroni’s multiple comparisons test on last day: DA (n = 8) vs. IA (n = 9), P = ns, DA or IA vs. DA (n = 18), P < 0.01**. (F) Social Avoidance Extinction Training: Mice were placed for 15 min in the same cages of the same aggressors from CSD days with a mesh wall in-between before being returned to their home cages. The training took place for 16 d; every day, a new aggressor was encountered. (GIndiscriminate-avoiders display resistance to extinction of averse memories: The DA (n = 25) had a significantly greater social interaction (SI) index with the aggressors’ strain in the STST following extinction training compared to their index in the test before the training (following CSD), whereas the IA (n = 18) maintained similar indices between both time points. Results are presented as mean ± SEM, two-way ANOVA, extinction training: F (1, 41) = 7.092, P = 0.0110**, subgroups: F(1, 41) = 7.061, P = 0.0112**, interaction: F(1, 41) = 8.293, P = 0.0063**, and Bonferroni’s multiple comparisons test within each subgroup: before vs. after extinction, P = 0.0002***.
Fig. 2.
Fig. 2.
Conceptual graphical overview. Following CSD and employing the STST, the single Defeated group is stratified based on social avoidance development toward the threat-associated cue (conditioned learning of aversive cues). The single subgroup of avoiders is further stratified based on social avoidance development toward the safe cue (threat–safety discrimination). The Discriminating-avoiders do not display social avoidance toward the safe cue and thus are characterized by successful threat–safety discrimination as well as responsiveness to Social Avoidance Extinction Training (extinction of aversive memories). In line with research in humans, they express resilience after adversity. In contrast, the Indiscriminate-avoiders display social avoidance toward the safe cue and thus are characterized by aversive response generalization to safe stimuli as well as resistance to extinction, reflecting stress susceptibility. Finally, the Non-avoiders are characterized by an impaired ability to conditionally learn aversive cues, thus are out of the “resilience susceptibility” spectrum.
Fig. 3.
Fig. 3.
Subgroup- and brain region-specific DEGs. Heatmaps of identified subgroup-specific DEGs in blA, mPFC, and vHC: For each region, change of gene expression between the nondefeated Control group (Ctrl) and each of the three Defeated subgroups is shown. The color code represents the log2 fold change of the average normalized gene expression where blue values indicate greater expression in the respective Defeated subgroup compared to the Control group. Discriminating-avoiders (DA), Indiscriminate-avoiders (IA), and Non-avoiders (NA), n = 4 to 7 per subgroup.
Fig. 4.
Fig. 4.
Subgroup-specific gene coexpression networks. (ADefeated subgroups exhibit a considerably different similarity structure of modules: Gene expression similarity structure across modules of coexpressed genes identified within the three different Defeated subgroups and the Control (Ctrl) group. Height of the dendrogram corresponds to dissimilarity of gene expression profiles across samples from all animals (lower value=more similar) used for clustering genes into modules. Colors of modules are arbitrarily assigned within each subgroup. (B) More subgroup-specific functionally enriched terms of modules than shared: While 24 terms are shared across all subgroups, 32 terms are specific to the Control (Ctrl) group and between 28 and 66 terms are specific to one of the three Defeated subgroups. (CE) Unique numbers of functionally enriched terms of modules between the Control group and each of the three Defeated subgroups: Control (Ctrl) group-specific terms seen as “lost” in the respective Defeated subgroup, and Defeated subgroup-specific terms seen as “gained.” Note that the terms “loss” and “gain” reflect change of expression pattern and not of function. Non-avoiders (NA) n = 17, Indiscriminate-avoiders (IA) n = 19, Discriminating-avoiders (DA) n = 15, and Control (Ctrl) n = 15.

References

    1. Global Burden of Disease Study 2013 Collaborators, Global, regional, and national incidence, prevalence, and years lived with disability for 301 acute and chronic diseases and injuries in 188 countries, 1990–2013: A systematic analysis for the Global Burden of Disease Study 2013. Lancet 386, 743–800 (2015). - PMC - PubMed
    1. Bonanno G. A., Westphal M., Mancini A. D., Resilience to loss and potential trauma. Annu. Rev. Clin. Psychol. 7, 511–535 (2011). - PubMed
    1. Kalisch R., et al. , The resilience framework as a strategy to combat stress-related disorders. Nat. Hum. Behav. 1, 784–790 (2017). - PubMed
    1. Chang L. J., Reddan M., Ashar Y. K., Eisenbarth H., Wager T. D., The challenges of forecasting resilience. Behav. Brain Sci. 38, e98 (2015). - PubMed
    1. Veer I. M., et al. , Psycho-social factors associated with mental resilience in the Corona lockdown. Transl. Psychiatry 11, 1–11 (2021). - PMC - PubMed

Publication types