. 2023 Apr 25;120(17):e2302152120.
doi: 10.1073/pnas.2302152120. Epub 2023 Apr 17.

The human malaria parasite Plasmodium falciparum can sense environmental changes and respond by antigenic switching

Affiliations

The human malaria parasite Plasmodium falciparum can sense environmental changes and respond by antigenic switching

Victoria M Schneider et al. Proc Natl Acad Sci U S A. .

Abstract

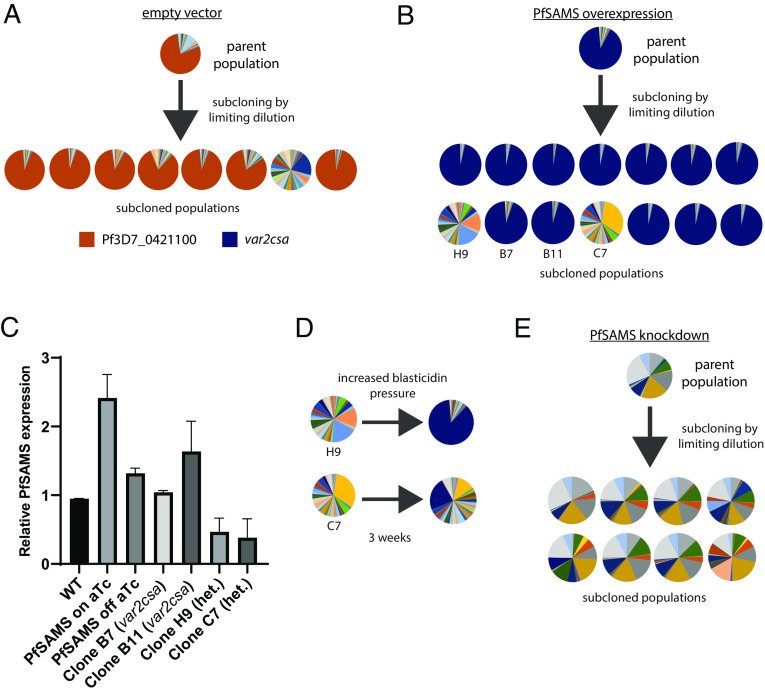
The primary antigenic and virulence determinant of the human malaria parasite Plasmodium falciparum is a variant surface protein called PfEMP1. Different forms of PfEMP1 are encoded by a multicopy gene family called var, and switching between active genes enables the parasites to evade the antibody response of their human hosts. var gene switching is key for the maintenance of chronic infections; however, what controls switching is unknown, although it has been suggested to occur at a constant frequency with little or no environmental influence. var gene transcription is controlled epigenetically through the activity of histone methyltransferases (HMTs). Studies in model systems have shown that metabolism and epigenetic control of gene expression are linked through the availability of intracellular S-adenosylmethionine (SAM), the principal methyl donor in biological methylation modifications, which can fluctuate based on nutrient availability. To determine whether environmental conditions and changes in metabolism can influence var gene expression, P. falciparum was cultured in media with altered concentrations of nutrients involved in SAM metabolism. We found that conditions that influence lipid metabolism induce var gene switching, indicating that parasites can respond to changes in their environment by altering var gene expression patterns. Genetic modifications that directly modified expression of the enzymes that control SAM levels similarly led to profound changes in var gene expression, confirming that changes in SAM availability modulate var gene switching. These observations directly challenge the paradigm that antigenic variation in P. falciparum follows an intrinsic, programed switching rate, which operates independently of any external stimuli.

Keywords: gene expression; immune evasion; metabolism; methylation; var genes.


Conflict of interest statement

The authors declare no competing interest.

Figures

Fig. 1.
Fig. 1.
Schematic drawing of the metabolic pathways resulting in the production of the lipid phosphatidylcholine (PtdCho, green) in P. falciparum infected red blood cells. The inner, dark red circle represents the parasite, the larger circle surrounding the parasite represents the infected red blood cell (iRBC), while the white background represents the extracellular environment. Uptake of three key nutrients is highlighted, choline and serine (blue) and methionine (Met, red). Two alternative pathways for the production of CDP-choline are shown; the serine decarboxylase phosphoethanolamine methyltransferase (SDPM) and the cytidine diphosphate (CDP)-choline pathway (also known as the Kennedy pathway). Importantly, the SDPM pathway requires the enzyme phosphoethanolamine N-methyltransferase (PfPMT) and consumes three molecules of S-adenosylmethionine (SAM, red) for the production of phosphocholine. The role of SAM in histone methylation by histone methyltransferases (HMTs) and demethylation by histone demethylases (HDMs) is highlighted in orange. The conversion of Met to SAM by SAM synthase (PfSAMS) and the conversion of S-adenosylhomocysteine (SAH) to homocysteine by SAH hydrolase (PfSAHH) are also shown.
Fig. 2.
Fig. 2.
Effect of changes in serine and choline availability on var gene expression. (A) Pie charts representing var gene expression profiles in parasite populations. The expression level of each individual var gene was determined using qRT-PCR using a standardized protocol originally described by Salanti et al. (18). Each slice of the pie represents the expression level of a specific var gene. A single initial population of parasites primarily expressing the var gene Pf3D7_0421100 (orange) was divided into parallel cultures and exposed to different concentrations of choline and serine as described in SI Appendix, Table S1. var expression profiles were determined after 2 and 4 wk of culture. Expression of var2csa is shown in blue. (B) Intracellular abundance of choline (Cho), serine (Ser), S-adenosylmethionine (SAM) and S-adenosylhomocysteine (SAH) are shown at the right of each condition.
Fig. 3.
Fig. 3.
Effect of changes in methionine availability on var gene expression. (A) Pie charts representing var gene expression profiles in parasite populations with each slice of the pie representing the expression level of a specific var gene. A single initial population of parasites primarily expressing the var gene Pf3D7_0421100 (orange) was divided into parallel cultures and exposed to different concentrations of methionine as described in SI Appendix Table S1. var expression profiles were determined after 2 and 4 wk of culture. Expression of var2csa is shown in blue. (B) Intracellular abundance of methionine (Met), S-adenosylmethionine (SAM) and S-adenosylhomocysteine (SAH) are shown at the right of both conditions.
Fig. 4.
Fig. 4.
Effect of overexpression of PfSAMS on var gene expression. (A) Schematic representation of the TetR-DOZI system for protein overexpression. This construct was transfected into cultured parasites and maintained as an episome, allowing inducible expression of an HA-tagged version of the protein through the addition of anhydrotetracycline (ATc) to the culture media. (B) Western showing expression of the HA-tagged version of PfSAMS in transfected, late-stage parasites. Expression of the protein is detectable even in the absence of ATc, although expression increases dramatically 36 h after addition of ATc. Antibodies against Hsp70, HA and SAMS were used for detection. (C) Quantitation of total PfSAMS expression in the presence or absence of ATc as detected by Western blot. (D) Intracellular levels of SAM (Left) and SAH (Right) in wild-type and PfSAMS overexpressing parasites with and without the addition of ATc to the media. Intracellular SAM and SAH levels were determined by LC-MS and are displayed as the calculated area under the signal curve per 1 × 103 parasites for each metabolite. (E) Pie charts representing var gene expression profiles in parasite populations with each slice of the pie representing the expression level of a specific var gene. Top: An initial population of parasites primarily expressing the var gene Pf3D7_0421100 (orange) was transfected with an empty vector, then var gene expression profiles determined after growth in the presence or absence of ATc for 2 wk. Bottom: var gene expression profiles are shown for a population of parasites immediately after transfection with the PfSAMS overexpression construct (Left) as well as after 2 wk of growth in the presence or absence of ATc (middle pies). Growth in the absence of blastidin for 2 mo (Right) results in the loss of the expression vector and a shift away from var2csa expression (blue). (F). Q-RT-PCR assays showing total transcript levels of PfSAMS in parasites transfected with an empty vector, with the PfSAMS overexpression construct and grown in the presence of ATc, or after removal of blasticidin from the media for 2 mo. Removal of blasticidin selection allows PfSAMS expression levels to return to those of the empty vector control. *P < 0.05, **P < 0.01, ***P < 0.005, ns P > 0.05, paired student’s t test.
Fig. 5.
Fig. 5.
Effect of knockdown of PfSAMS expression on var gene expression. (A) Schematic representation of the GlmS system for mRNA knockdown. The DNA sequence encoding a HA-tag and the glms ribozyme was integrated into the 3′ end of the PfSAMS locus, thereby incorporating a ribozyme into the 3′ UTR of the mRNA. Addition of glucosamine (GlcN) results in degradation of the mRNA and reduced protein expression. (B) Western blot of proteins extracted from late-stage parasites showing reduced expression of the HA-tagged version of PfSAMS after 36 h of growth in the presence of 2.5 mM glucosamine. (C) Quantification of PfSAMS showing an ~50% reduction in PfSAMS expression upon the addition of glucosamine. (D and E) Pie charts representing var gene expression profiles in the PfSAMS-glms parasite populations with each slice of the pie representing the expression level of a specific var gene. The profile for the initial transfected population is shown on the left with additional profiles from 2 wk and 4 wk with and without glucosamine added to the culture media. The annotation numbers of the dominantly expressed var genes are shown in E. (F) var expression profiles for wild-type parasites grown with or without glucosamine for 4 wk.
Fig. 6.
Fig. 6.
Conditions that increase SAM availability lead to increases in histone methylation. Whole genome cut-and-run analysis was used to assess differences in the levels of H3K9me3 and H3K4me3 in parasites grown under media conditions that increase SAM levels (20× excess choline) compared to conditions that reduced SAM levels (depleted choline and methionine). The plots display the mean change in H3K4me3 (blue) and H3K9me3 (red) coverage across three regions of heterochromatin found within the P. falciparum genome. Positive values indicate an increase in histone methylation under conditions of increased SAM. (A) The subtelomeric region at the left end of chromosome 2. (B) A central region of chromosome 4 containing multicopy gene family members. (C) A central region of chromosome 3 containing the clag3.1/3.2 genes. (D) The subtelomeric region at the left end of chromosome 12. Green and light blue arrows beneath each plot indicate open reading frames, with gene annotation numbers and gene names displayed next to each arrow. Abbreviations: pseudo- pseudogene; pol α- DNA polymerase alpha catalytic subunit A; zinc finger- LITAF-like zinc finger protein, putative; S12- ribosomal protein S12, mitochondrial; ppc ligase- phosphopantothenoylcysteine synthetase, putative; ruf 6- RNA of unknown function 6; pgm-ase 2- phosphoglucomutase-2; 26S subunit 6B- 26S protease regulatory subunit 6B, putative; lysine DC- lysine decarboxylase-like protein, putative; 50S L10- 50S ribosomal protein L10, putative; uc-th 13- ubiquitin carboxyl-terminal hydrolase 13, putative; smcp 3- structural maintenance of chromosomes protein 3; protein kinase- serine/threonine protein kinase; ncRNA- noncoding RNA; ABC B4- ABC transporter B family member 4, putative; acs7- acyl-CoA synthetase 7; fikk- serine/threonine protein kinase, FIKK family.
Fig. 7.
Fig. 7.
Volcano plots displaying differential expression of genes known to undergo clonally variant expression linked to changes in the deposition of the chromatin mark H3K9me3. Upregulated genes are shown in red while down regulated genes are in blue. var genes are displayed as open circles while non-​var genes are labeled with the name of the encoded protein. Full annotation numbers for all genes are included in Dataset S1. (A) Volcano plot derived from comparison of ring-stage parasites overexpressing PfSAMS to wild-type ring-stage parasites grown under standard culture conditions. (B) Volcano plot derived from comparison of ring-stage parasites in which PfSAMS has been knocked down to wild-type ring-stage parasites grown under standard culture conditions. Differentially expressed genes were defined as having a log2foldchange of at least 1.95 and an adjusted P value is less than 0.05. All var genes are shown by open circles, while all other genes are shown by solid circles and labeled appropriately.
Fig. 8.
Fig. 8.
Detection of var expression switching through limiting dilution cloning. (A) Pie charts representing var gene expression profiles for wild-type parasites transfected with an empty expression vector are shown. Expression profiles for populations isolated from a single “parent” population by limiting dilution are shown. All but one clone display dominant expression of the var gene Pf3D7_0421100 (orange). (B) Using the same methodology as in A, 14 subclones of a PfSAMS overexpression line were obtained and var expression profiles determined. Two subclones (H9 and C7) had switched away from expressing var2csa (blue). (C) Expression levels of PfSAMS were determine using Q-RT-PCR. Two clones (H9 and C7) that displayed a heterogenous var expression profile also displayed reduced levels of PfSAMS expression. (D) var expression profiles from the PfSAMS overexpression lines H9 and C7. Initial expression profiles from populations displaying reduced PfSAMS expression (Left) and after 3 wk of growth in media containing increased blasticidin concentration (Right). (E) Using the same methodology as in A, eight subclones of the PfSAMS knockdown line were obtained and var expression profiles determined.

References

    1. Boddey J. A., Cowman A. F., Plasmodium nesting: Remaking the erythrocyte from the inside out. Annu. Rev. Microbiol. 67, 243–269 (2013). - PubMed
    1. Su X., et al. , A large and diverse gene family (var) encodes 200–350 kD proteins implicated in the antigenic variation and cytoadherence of Plasmodium falciparum-infected erythrocytes. Cell 82, 89–100 (1995). - PubMed
    1. Baruch D. I., et al. , Cloning the P. falciparum gene encoding PfEMP1, a malarial variant antigen and adherence receptor on the surface of parasitized human erythrocytes. Cell 82, 77–87 (1995). - PubMed
    1. Smith J. D., et al. , Switches in expression of Plasmodium falciparum var genes correlate with changes in antigenic and cytoadherent phenotypes of infected erythrocytes. Cell 82, 101–110 (1995). - PMC - PubMed
    1. Gardner M. J., et al. , Genome sequence of the human malaria parasite Plasmodium falciparum. Nature 419, 498–511 (2002). - PMC - PubMed

Publication types

Substances

LinkOut - more resources