Review
. 2023 Jun:150:131-175.
doi: 10.1016/j.clinph.2023.03.010. Epub 2023 Mar 29.

Clinical diagnostic utility of transcranial magnetic stimulation in neurological disorders. Updated report of an IFCN committee

Affiliations
Review

Clinical diagnostic utility of transcranial magnetic stimulation in neurological disorders. Updated report of an IFCN committee

Steve Vucic et al. Clin Neurophysiol. 2023 Jun.

Abstract

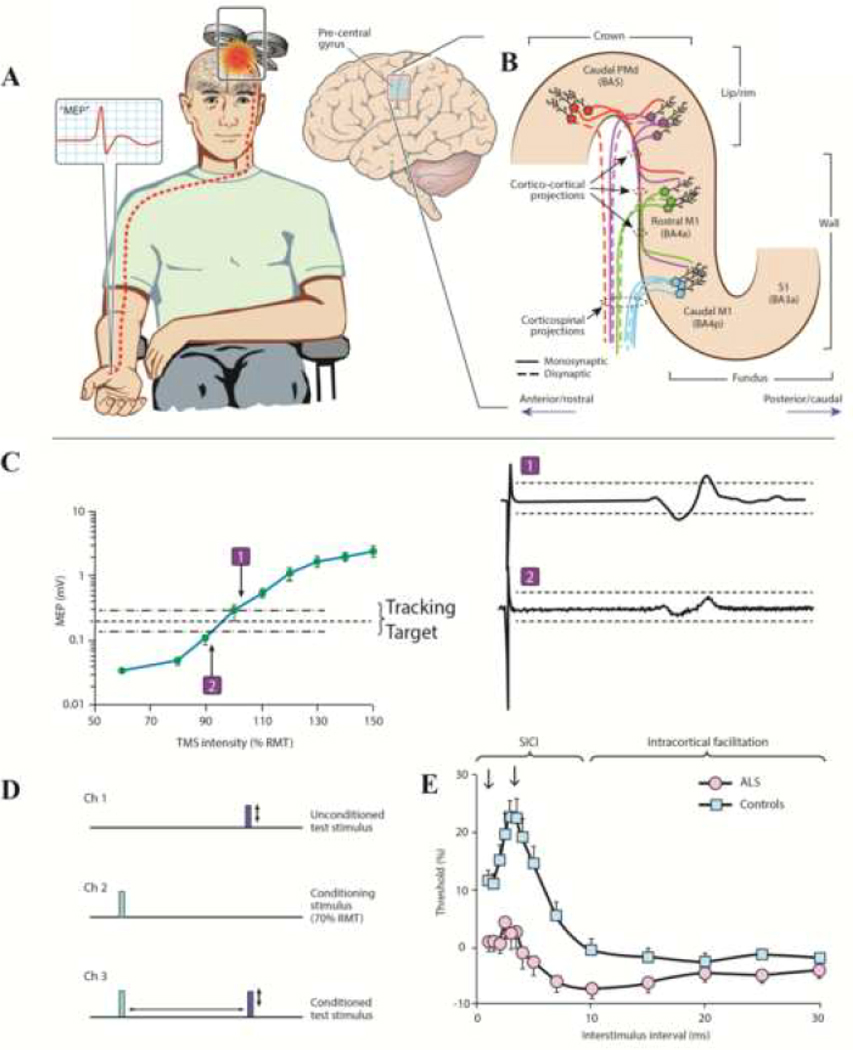
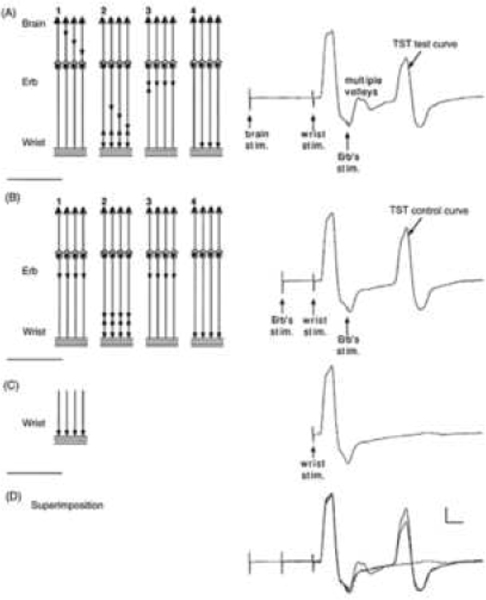
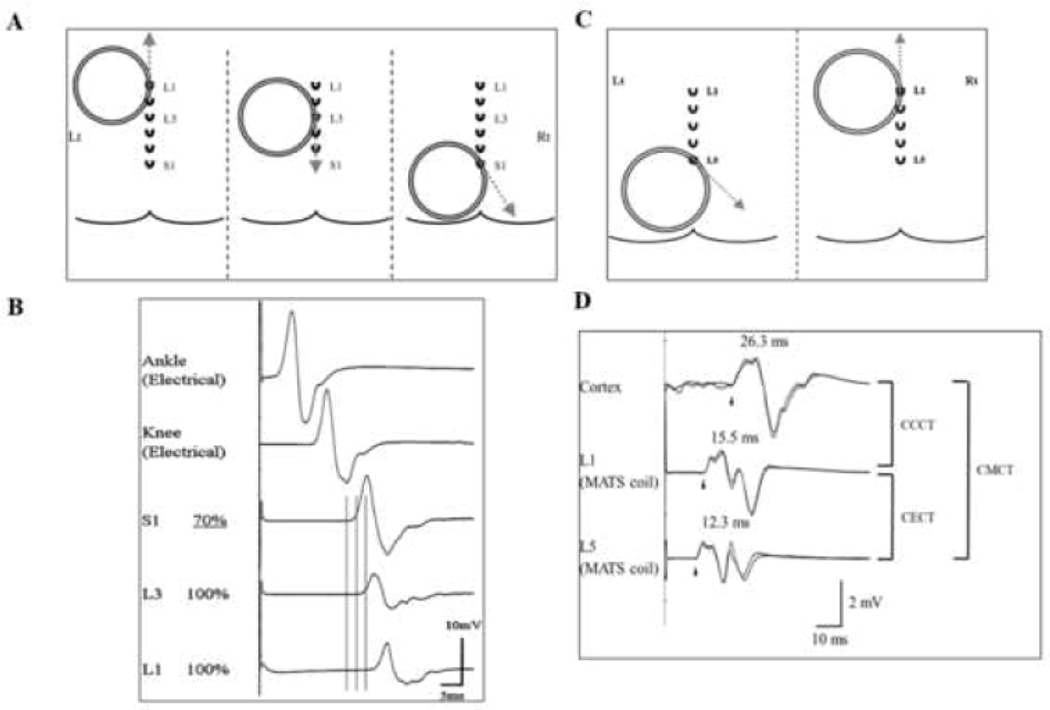
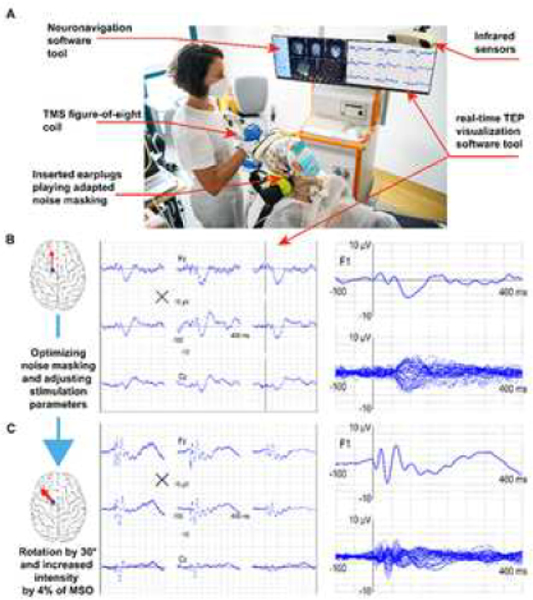
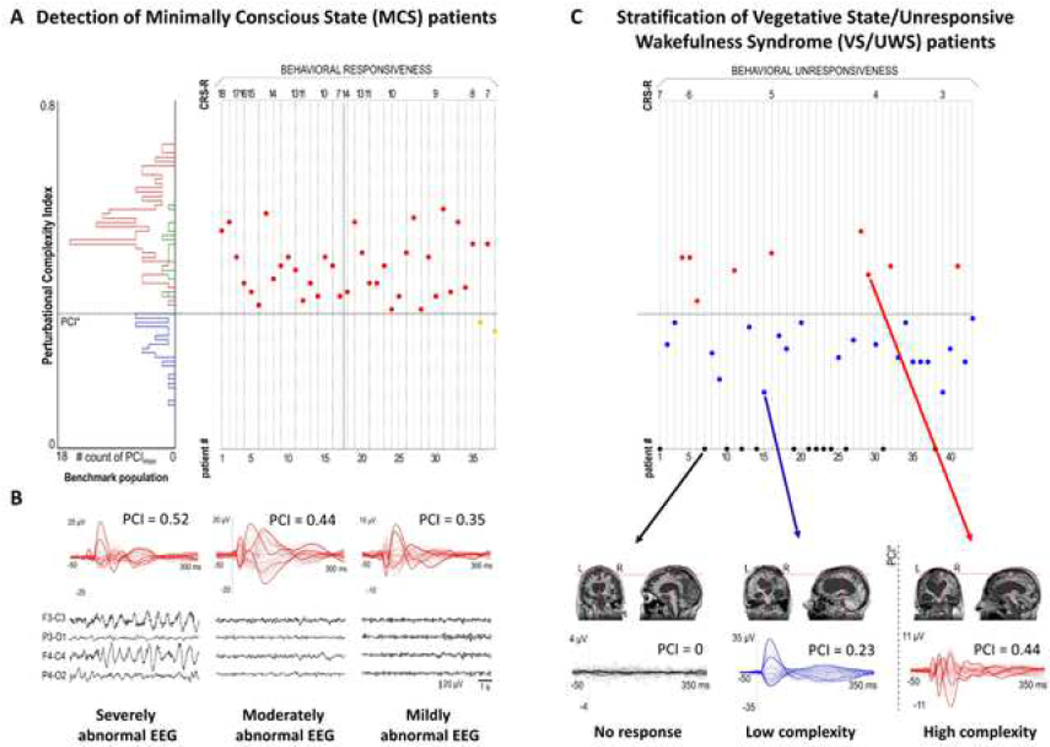
The review provides a comprehensive update (previous report: Chen R, Cros D, Curra A, Di Lazzaro V, Lefaucheur JP, Magistris MR, et al. The clinical diagnostic utility of transcranial magnetic stimulation: report of an IFCN committee. Clin Neurophysiol 2008;119(3):504-32) on clinical diagnostic utility of transcranial magnetic stimulation (TMS) in neurological diseases. Most TMS measures rely on stimulation of motor cortex and recording of motor evoked potentials. Paired-pulse TMS techniques, incorporating conventional amplitude-based and threshold tracking, have established clinical utility in neurodegenerative, movement, episodic (epilepsy, migraines), chronic pain and functional diseases. Cortical hyperexcitability has emerged as a diagnostic aid in amyotrophic lateral sclerosis. Single-pulse TMS measures are of utility in stroke, and myelopathy even in the absence of radiological changes. Short-latency afferent inhibition, related to central cholinergic transmission, is reduced in Alzheimer's disease. The triple stimulation technique (TST) may enhance diagnostic utility of conventional TMS measures to detect upper motor neuron involvement. The recording of motor evoked potentials can be used to perform functional mapping of the motor cortex or in preoperative assessment of eloquent brain regions before surgical resection of brain tumors. TMS exhibits utility in assessing lumbosacral/cervical nerve root function, especially in demyelinating neuropathies, and may be of utility in localizing the site of facial nerve palsies. TMS measures also have high sensitivity in detecting subclinical corticospinal lesions in multiple sclerosis. Abnormalities in central motor conduction time or TST correlate with motor impairment and disability in MS. Cerebellar stimulation may detect lesions in the cerebellum or cerebello-dentato-thalamo-motor cortical pathways. Combining TMS with electroencephalography, provides a novel method to measure parameters altered in neurological disorders, including cortical excitability, effective connectivity, and response complexity.

Keywords: Motor evoked potential; Neurological disorders; Short interval intracortical inhibition; Transcranial magnetic stimulation.


Conflict of interest statement

Conflict of Interest

A Benussi was partially supported by the Airalzh-AGYR2020, by Fondazione Cariplo (grant n° 2021–1516), and by the Fondation pour la Recherche sur Alzheimer. M. Hallett is an inventor of a patent held by NIH for the H-coil for magnetic stimulation for which he receives license fee payments from the NIH (from Brainsway). He is on the Medical Advisory Board of Brainsway (unpaid position). S. Kreig reports being a consultant for Brainlab and receiving honorarium for lectures provided for Nexstim and Inomed. M Massimini is a co-founder and shareholder of Intrinsic Powers, a spin-off of the University of Milan, Milan, Italy. T. Picht served as a consultant for the TMS system manufacturer Nexstim Oy, Helsinki, Finland. U. Ziemann reports receiving a grant from Takeda Pharmaceutical Company Ltd., and consulting fees CorTec GmbH. The other authors have no potential conflicts of interest to disclose.

Figures

Figure 1:
Figure 1:. Principles of single and paired-pulse TMS.
(A) Transcranial magnetic stimulation using a figure of eight coil and applied over the primary motor cortex (M1), elicits a motor evoked potential (MEP, red potential in inset) from a target muscle. (B) Candidate descending corticomotoneuronal pathways from the precentral gyrus that contribute to the MEP response. Direct neuronal activation most likely occurs in the lip/rim regions of the motor hand knob. Activation spreads to the rostral and caudal parts of the M1, via cortico-cortical synaptic transmission, potentially contributing to indirect waves (I-waves). There is a greater preponderance of fast-conducting monosynaptic cortico-motoneuronal neurons in the caudal M1 (BA4p) compared to the rostral M1 (BA4a) is highlighted. The exact transition between rostral M1 and caudal dorsal premotor cortex (PMd) in the lip/rim region of the gyrus is gradual and varies across subjects. Additional corticospinal pathways may be activated by TMS via excitation of postcentral primary somatosensory cortex (S1) and its cortico-cortical projections to rostral/caudal M1. (C) For threshold tracking TMS, a target of 0.2 mV (±20%) is selected which lies in the steepest portion of the stimulus response curve. As such, if the MEP response is larger than the tracking target (potential-1) the subsequent stimulus intensity is reduced, while if the MEP response is smaller than the tracking target (potential-2), the subsequent stimulus intensity is reduced. (D) The paired pulse paradigm is illustrated. Channel 1 records an unconditioned test stimulus, defined as TMS intensity required to generate and maintain the tracking target, which signifies the resting motor threshold (RMT) when using the threshold tracking technique. Channel 2 monitors the subthreshold conditioning stimulus (does not generate MEP) and channel 3 records the conditioned-test stimulus at interstimulus intervals of 1–30 ms. (E) When utilizing the threshold tracking TMS technique, short interval intracortical inhibition (SICI) is represented as increased conditioned-test stimulus intensity required to generate and maintain the tracking target, developed between 1–7 ms. Intracortical facilitation is represented as reduced conditioned-test stimulus intensity. In amyotrophic lateral sclerosis (ALS) patients SICI is reduced and ICF increased, signifying cortical hyperexcitability.
Figure 2:
Figure 2:. The triple stimulation test (TST) principle.
On the left, a schematic diagram of the motor tract is simplified to four corticospinal axons with monosynaptic connections to four peripheral axons (a simplification which does not account for the complexity of corticospinal connections); horizontal lines represent the muscle fibres of the four motor units. Recordings are shown on the right: (A) TST test, (B) TST control, (C) response to a single stimulus at wrist and (D) superimposition of recordings A, B and C. In this example a submaximal transcranial stimulus excites 75% of the axons (three axons out of four). Desynchronization of the three action potentials is assumed to occur within the corticospinal tract (or possibly at the spinal cell level). (A, 1) Transcranial stimulation excites three out of four axons. (A, 2) After a delay, a maximal stimulus applied to the wrist evokes the first negative (upward) deflection in the TST test trace; this response is followed by that of the multiple-discharge volleys (not figured on the left scheme). (A, 3) After a delay, a maximal stimulus is applied to Erb’s point; (A, 4) a synchronized response from the three axons excited initially by the transcranial stimulus is recorded as the second large deflection of TST test trace. (B, 1) A maximal stimulus is applied to Erb’s point; (B, 2) after a delay, a maximal stimulus applied to the wrist evokes the first deflection of TST control trace; (B, 3) after a delay, a maximal stimulus is applied to Erb’s point; (B, 4) a synchronized response from the four axons is recorded as the second deflection of TST control trace. (C) The response evoked by stimulating the wrist serves as a baseline for measurement of the amplitude and area of the second deflection of the TST curves. (D) On the superimposed traces, the smaller size of the second deflection of the TST test trace, compared with that of the TST control trace, demonstrates that not all spinal axons of the target muscle were excited by transcranial stimulation (in this example both amplitude and area ratios should be 75% if the four individual MUPs have identical sizes). Calibrations: 2 mV and 5 ms. (Figure from Magistris, M. R., K. M. Rosler, A. Truffert and J. P. Myers (1998). “Transcranial stimulation excites virtually all motor neurons supplying the target muscle. A demonstration and a method improving the study of motor evoked potentials.” Brain 121: 437–450 (with kind permission of the authors and Oxford University Press (Magistris et al., 1998a).)
Figure 3:
Figure 3:. Stimulation of the lumbosacral region.
(A) Position of the magnetic augmented translumbosacral stimulation (MATS) coil in magnetic stimulation of cauda equina with motor evoked potentials (MEP) recorded over the adductor hallucis (AH). The coil edge was positioned over the L1, L3, and S1 spinous processes. The induced current directions are illustrated by grey dashed lines and are tangential to the direction of coil winding over the activation sites. (B) At L1 and L3 levels, MATS coil stimulations failed to elicit a supramaximal MEP response. At the S1 level, stimulating nerves within the neuro-foramina, the MEP responses are supramaximal elicited at a TMS intensity of 70% maximal stimulator output. The MEP onset latency differences between the L1 and L3 stimulation levels suggest that cauda equina in the spinal canal at L1 and L3 levels were activated separately. Cauda equina conduction time (CECT) is calculated by subtracting the S1 from L1 elicited MEP onset latencies when recoding from AH. Tibial nerve compound muscle action potential (CMAP) responses were illustrated with ankle and knee stimulation. (C) Conus stimulation method when recoding over the right tibialis anterior muscle. For proximal cauda equina stimulation, the edge of MATS coil is positioned over the L1 spinous process for inducing currents in an upward direction (dashed grey arrow), while for neuroforaminal activation the edge of the MATS coil is positioned over L5 with induced current direction being 45° downward from a horizontal direction. (D) The MEP responses elicited with cortical, L1 and L5 stimulation are illustrated. The cortico-conus motor conduction time (CCCT) is calculated by subtracting the MEP onset latency elicited by L1 from cortical stimulation. Additionally, CECT is measured by subtracting MEP onset latency elicited by L1 form L5 stimulation. Central motor conduction time (CMCT) is represented by addition of CCCT and CECT.
Figure 4:
Figure 4:. TMS-EEG principles.
(A) Key elements (pointed by red arrows) of a TMS-EEG set-up employed in a clinical setting. (B and C) These panels directly compare the final average TMS evoked potentials [(TEP] (150 trials) collected during two sessions. Although both responses have been obtained by setting stimulation parameters based on reasonable a priori anatomical (position and orientation with respect to the cortical gyrus) and physiological (maximum stimulator output [MSO, %] at or above resting motor threshold [RMT]) information, they differ in fundamental ways. The responses in B show small early activations and are characterized by larger, late symmetric components which are maximal over midline channels, like those reported previously (Conde et al., 2019; Chung et al., 2018). These waveforms are hardly consistent with the effects of direct cortical stimulation, which is expected to trigger responses that are large immediately after the pulse and specific for the stimulation site (Keller et al., 2014; Kundu et al., 2020). Conversely, the TEP reported in C fulfills these basic criteria and is similar to those described in previous studies (Rosanova et al., 2009; Casarotto et al., 2016; Sinitsyn et al., 2020). In this case, a strong initial activation is followed by an overall asymmetric wave shape with high signal-to-noise ratio (SNR). Obtaining this kind of responses only required maximizing the immediate impact of TMS on early (8–50 ms) components through slight adjustments of the intensity (by 4% MSO) and orientation of stimulation (30° counterclockwise), while at the same time optimizing noise masking. Making such adjustments is relatively straightforward but would be impossible based on a priori information alone and can only be done if the operator is guided in real-time by informative visual feedback (rt-TEP) about the immediate effects of TMS.
Figure 5:
Figure 5:. TMS-EEG
and Perturbational Complexity Index (PCI) in a benchmark population, in minimally conscious state and Unresponsiveness Wakefulness Syndrome patients. (A) Distribution of maximum PCI values computed in the benchmark population (left) in the absence of subjective report (blue line) and in the presence of subjective report (delayed, green line; immediate, red line). The dashed horizontal line indicates the cut-off (PCI*) optimally discriminating consciousness from unconsciousness in the benchmark population. The scatter plot shows the maximum PCI values obtained in individual minimally conscious state (n = 38) patients, sorted by the Coma Recovery Scale-Revised (CRS-R). For each patient, the PCI is represented by a color-filled circle (Modified from Casarotto et al., 2016). (B) The upper row shows TMS evoked potentials [TEPs] (butterfly plot of all EEG channels superimposed, with three illustrative channels highlighted by bold red traces) together with the corresponding PCI values in three representative minimally conscious state patients with PCI higher than PCI*. The lower row shows 10 s of spontaneous EEG recorded from four bipolar EEG channels (F3-C3, P3-O1, F4-C4, and P4-O2) in the same patients. Note that despite having all PCI values above PCI*, minimally conscious state patients displayed patterns of spontaneous background EEG activity that were severely abnormal (left), moderately abnormal (center), and mildly abnormal (right) (Modified from Casarotto et al., 2016). (C) PCI-based stratification of Unresponsiveness Wakefulness Syndrome patients. The scatter plot shows all the maximum PCI values obtained in individual Unresponsiveness Wakefulness Syndrome (n = 43) patients. For each patient, the PCI is represented by a colour-filled circle. Unresponsiveness Wakefulness Syndrome patients could be stratified into three subgroups according to PCI values: high-complexity patients with PCI > PCI* (n = 9, red), low-complexity patients with PCI < PCI* (n = 21, blue), and no-response patients with PCI = 0 (n = 13, black). The lower row shows the structural MRI, the TEP and the corresponding PCI value reported for a representative subject of each subgroup (modified from Casarotto et al., 2016).

References

    1. Abbruzzese G, Assini A, Buccolieri A, Schieppati M, Trompetto C. Comparison of intracortical inhibition and facilitation in distal and proximal arm muscles in humans. J Physiol (Lond) 1999;514:895–903. - PMC - PubMed
    1. Abbruzzese G, Buccolieri A, Marchese R, Trompetto C, Mandich P, Schieppati M. Intracortical inhibition and facilitation are abnormal in Huntington’s disease: a paired magnetic stimulation study. Neurosci Lett 1997;228(2):87–90. - PubMed
    1. Abbruzzese G, Marchese R, Buccolieri A, Gasparetto B, Trompetto C. Abnormalities of sensorimotor integration in focal dystonia: a transcranial magnetic stimulation study. Brain 2001;124:537–45. - PubMed
    1. Abbruzzese G, Tabaton M, Morena M, Dall’Agata D, Favale E. Motor and sensory evoked potentials in progressive supranuclear palsy. Mov Disord 1991;6(1):49–54. - PubMed
    1. Afra J, Mascia A, Gérard P, Maertens de Noordhout A, Schoenen J. Interictal cortical excitability in migraine: a study using transcranial magnetic stimulation of motor and visual cortices. Ann Neurol 1998;44(2):209–15. - PubMed

Publication types

MeSH terms