. 2023 May;115(3):110625.
doi: 10.1016/j.ygeno.2023.110625. Epub 2023 Apr 15.

Genome-wide gene expression responses to experimental manipulation of Saccharomyces cerevisiae repressor activator protein 1 (Rap1) expression level

Affiliations

Genome-wide gene expression responses to experimental manipulation of Saccharomyces cerevisiae repressor activator protein 1 (Rap1) expression level

S Kalra et al. Genomics. 2023 May.

Abstract

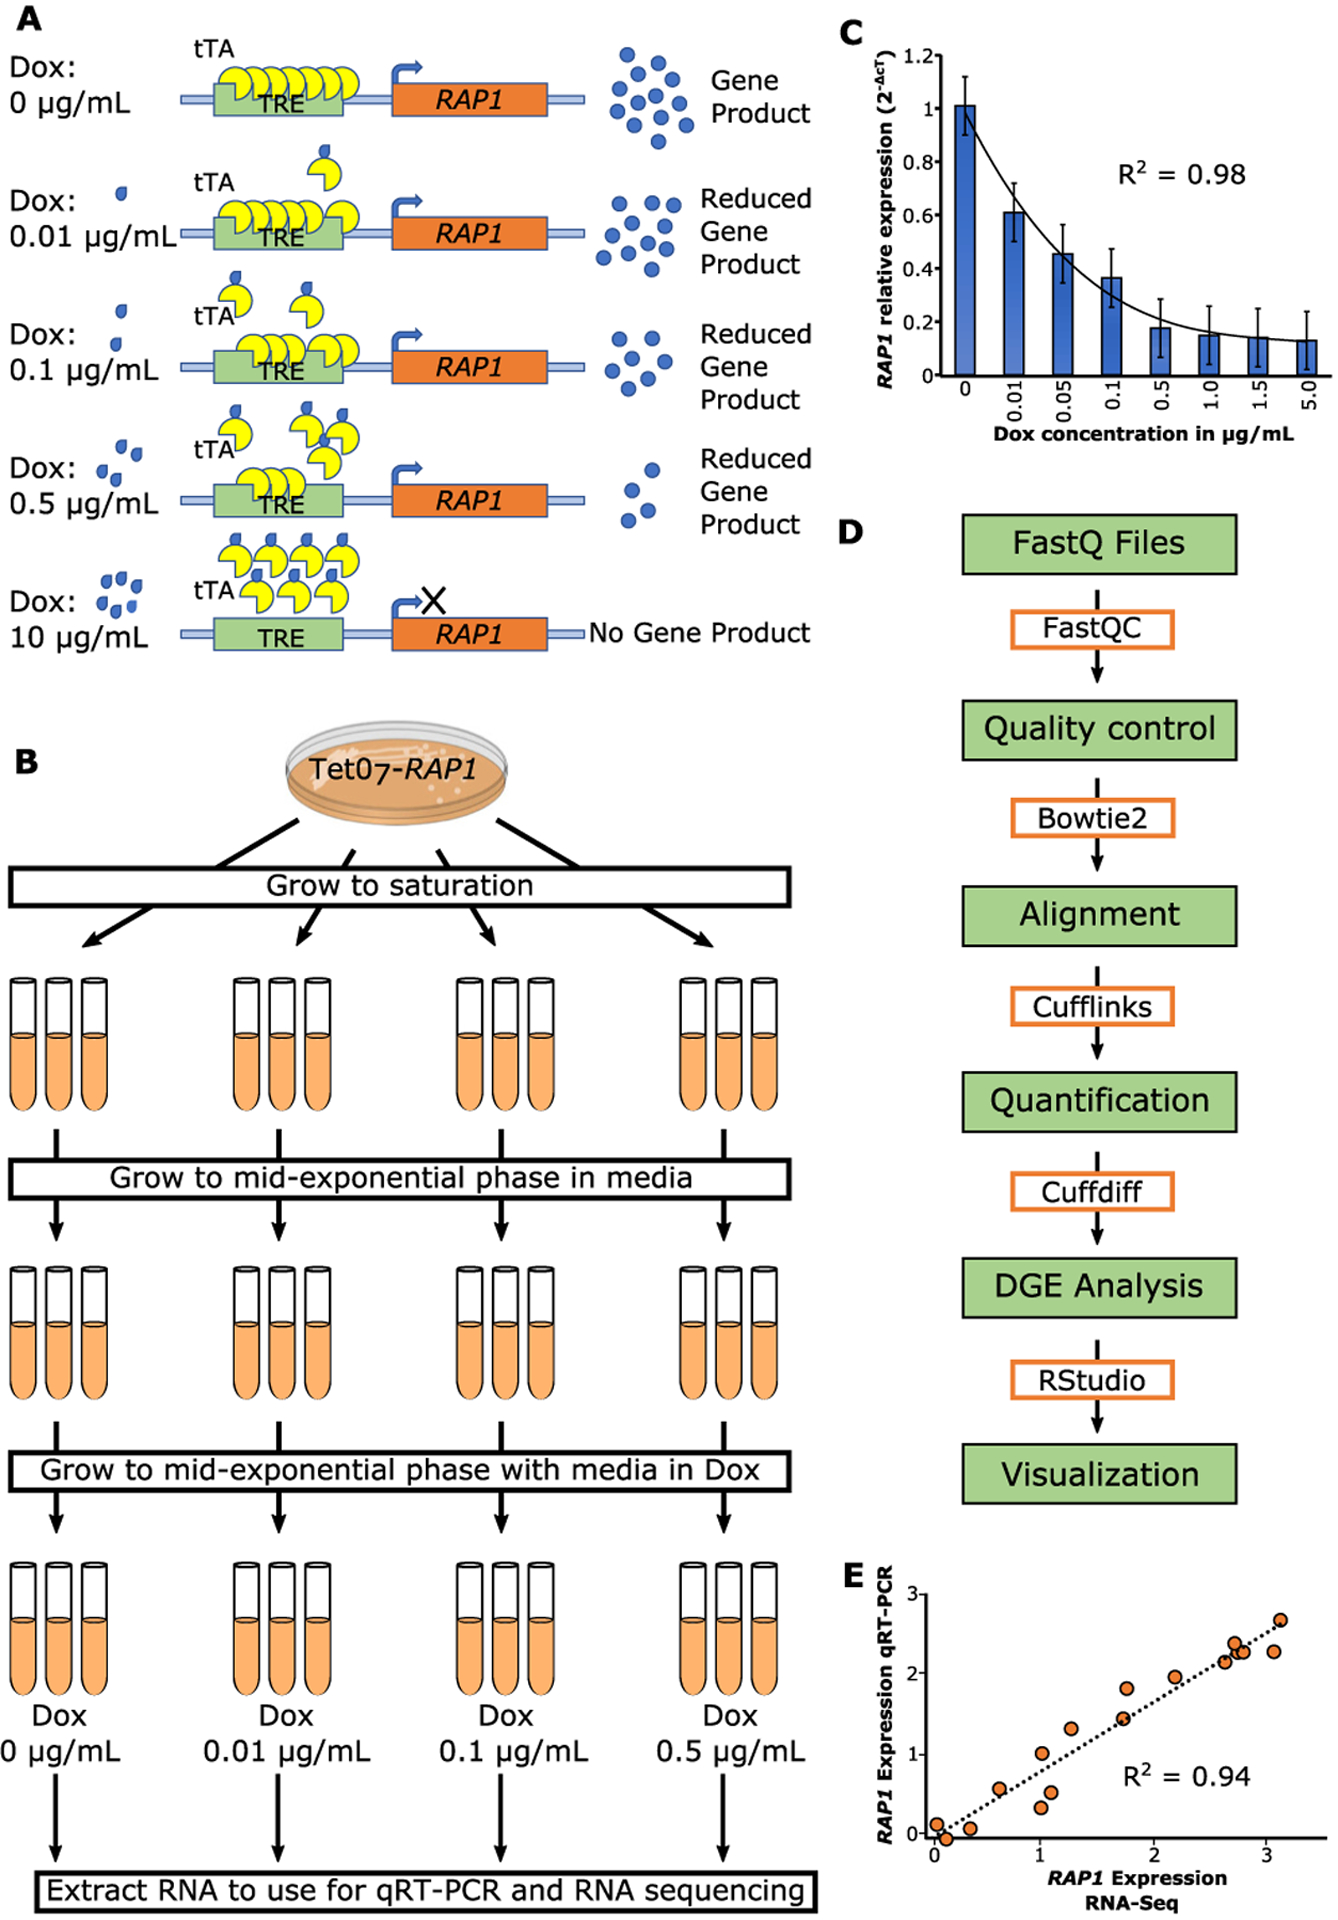
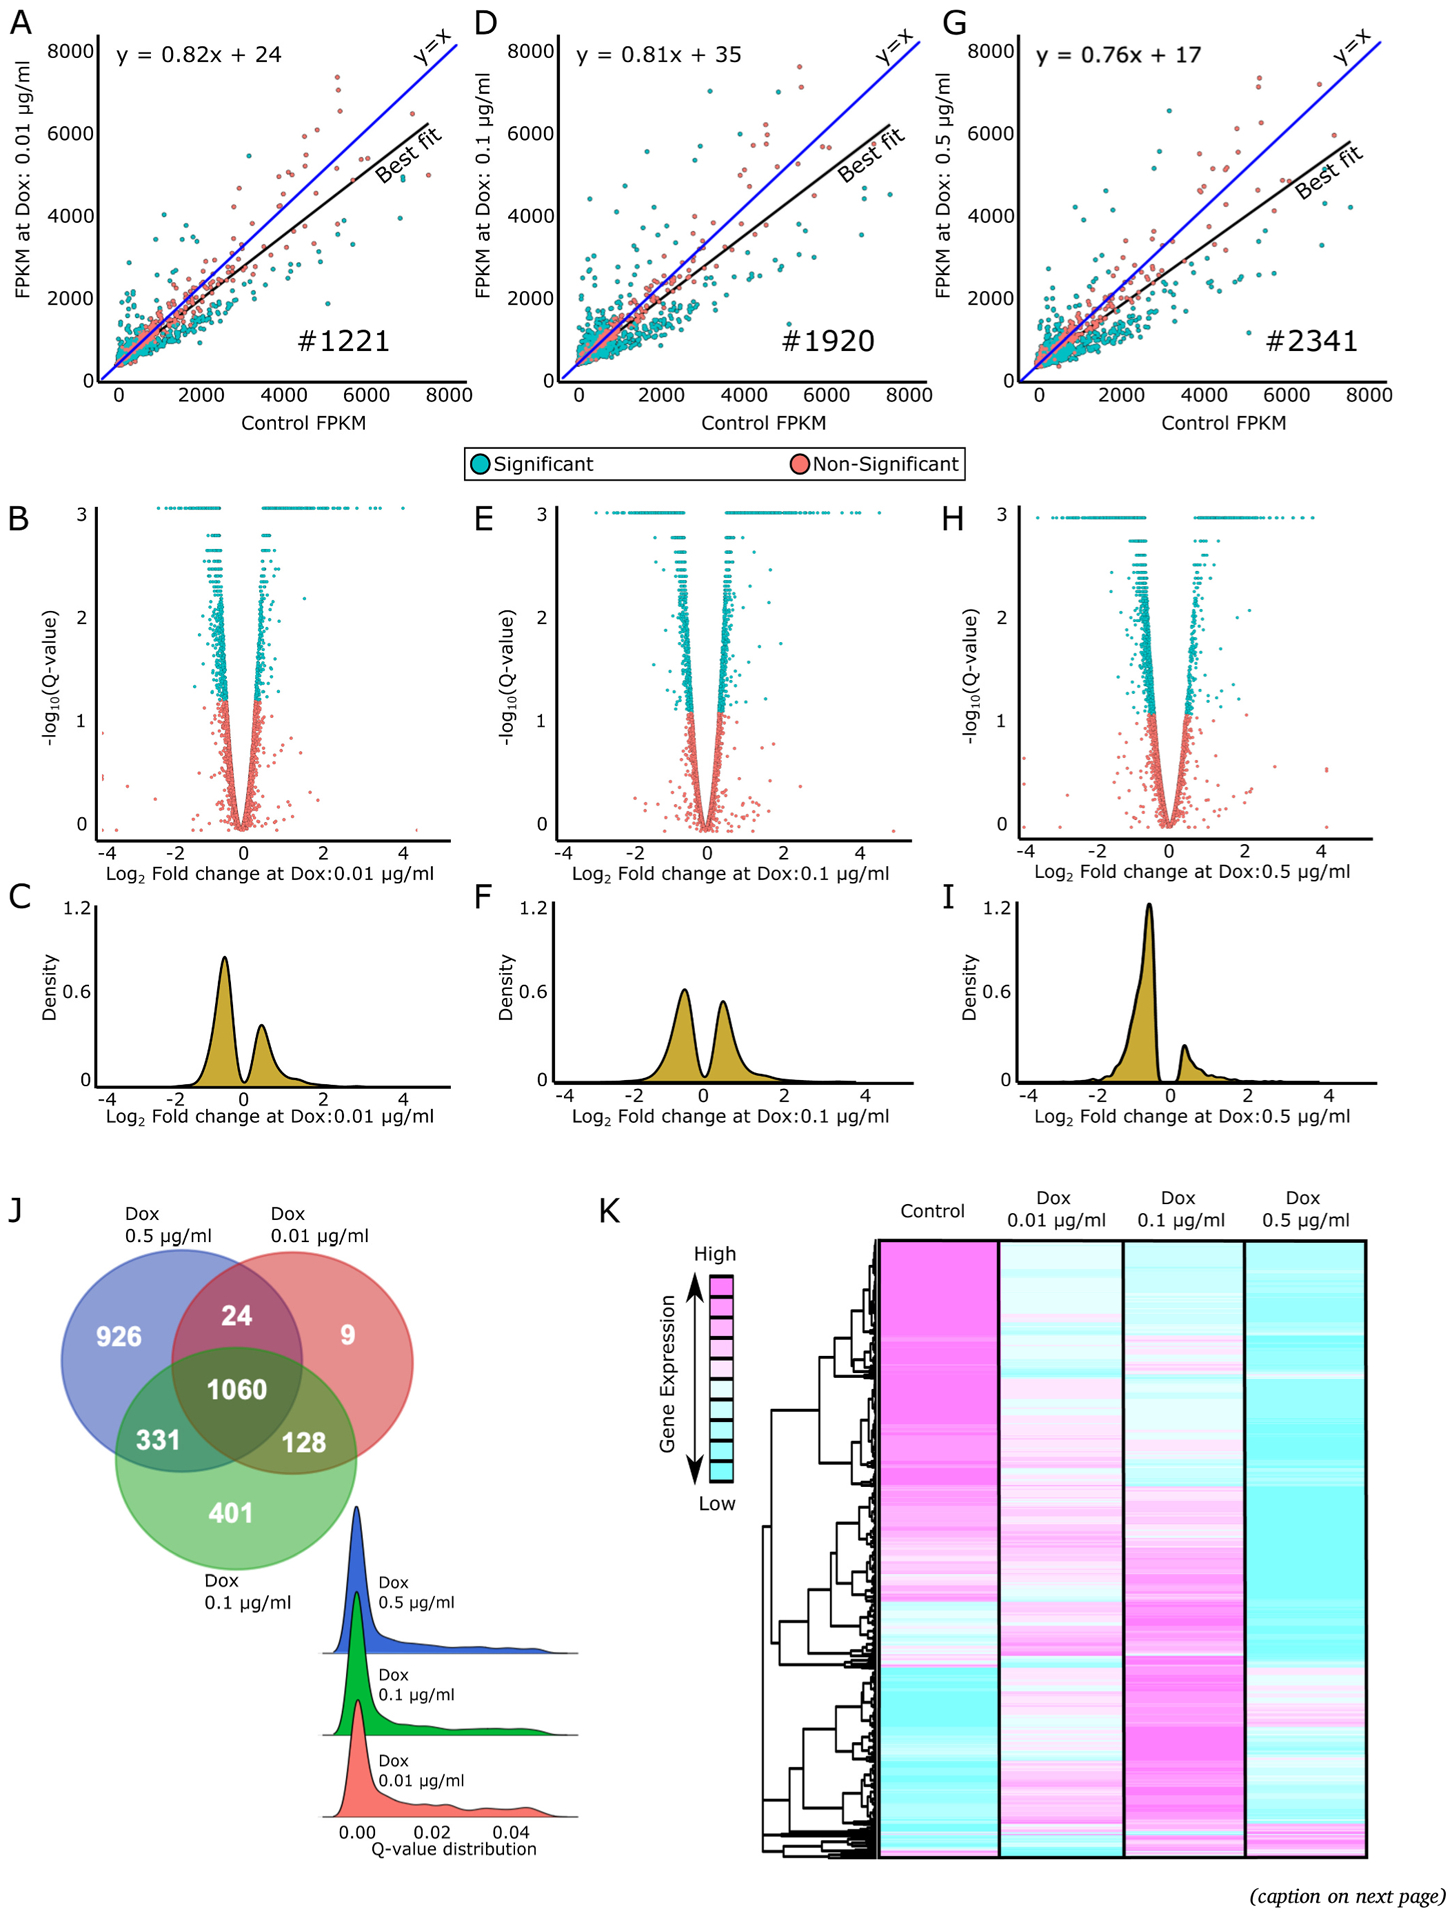
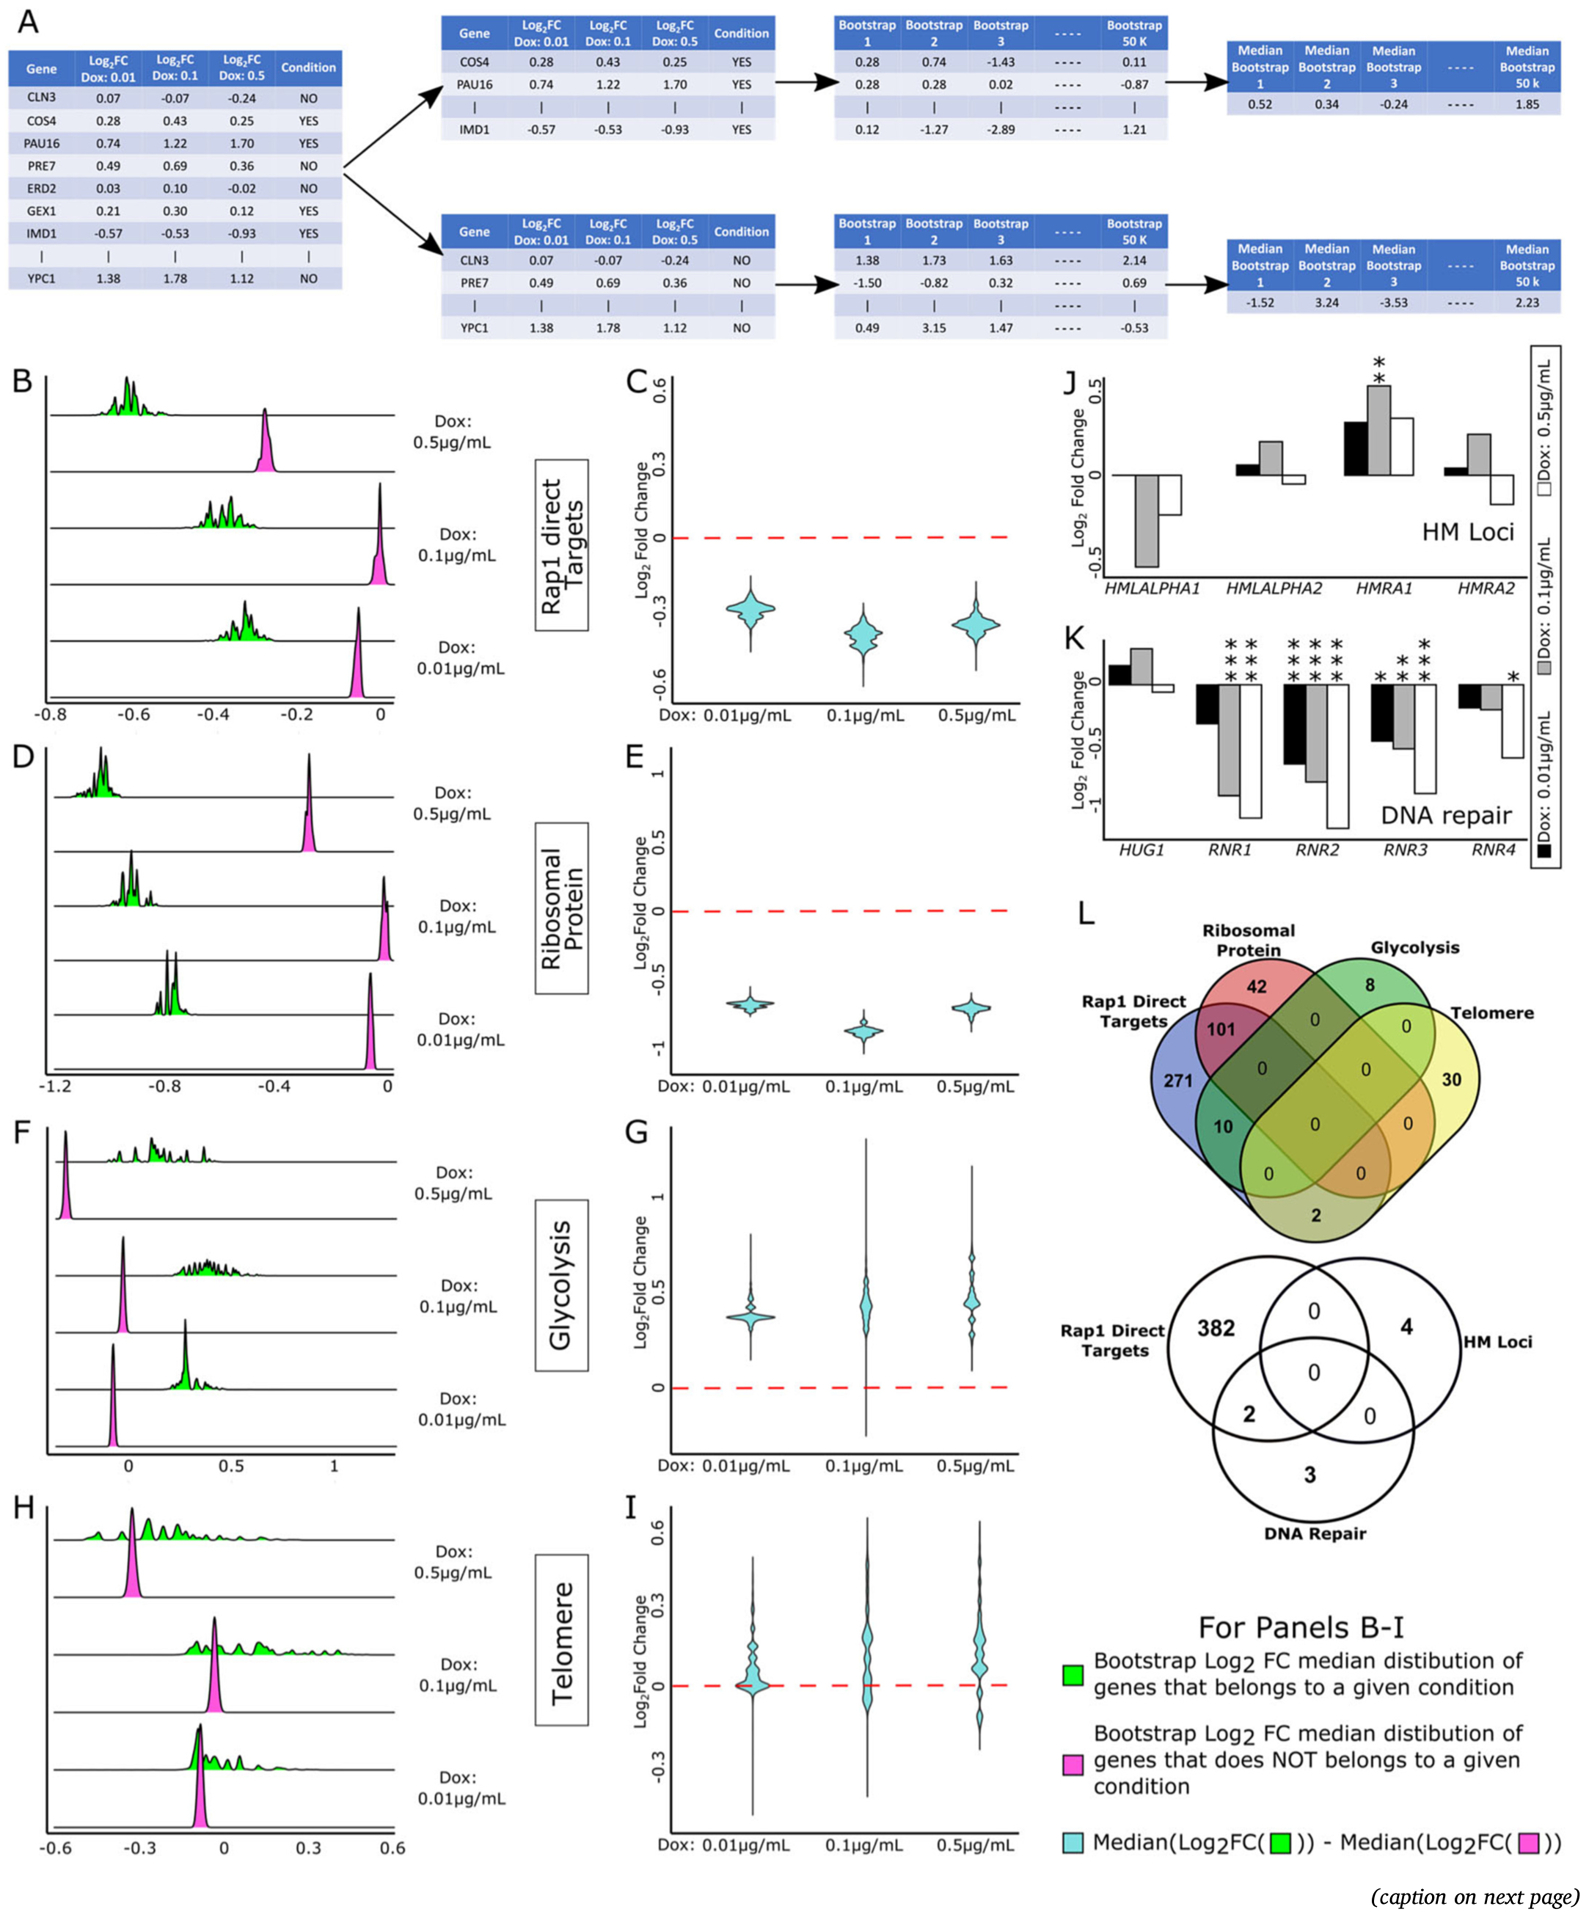
Precise regulation of transcription in gene expression is critical for all aspects of normal organism form, fitness, and function and even minor alterations in the level, location, and timing of gene expression can result in phenotypic variation within and between species including evolutionary innovations and human disease states. Eukaryotic transcription is regulated by a complex interplay of multiple factors working both at a physical and molecular levels influencing this process. In Saccharomyces cerevisiae, the TF with the greatest number of putative regulatory targets is the essential gene Repressor Activator Protein 1 (RAP1). While much is known about the roles of Rap1 in gene regulation and numerous cellular processes, the response of Rap1 target genes to systematic titration of RAP1 expression level remains unknown. To fill this knowledge gap, we used a strain with a tetracycline-titratable promoter replacing wild-type regulatory sequences of RAP1 to systematically reduce the expression level of RAP1 and followed this with RNA sequencing (RNA-seq) to measure genome-wide gene expression responses. Previous research indicated that Rap1 plays a significant regulatory role in particular groups of genes including telomere-proximal genes, homothallic mating (HM) loci, glycolytic genes, DNA repair genes, and ribosomal protein genes; therefore, we focused our analyses on these groups and downstream targets to determine how they respond to reductions in RAP1 expression level. Overall, despite being known as both an activator and as a repressor of its target genes, we found that Rap1 acts as an activator for more target genes than as a repressor. Additionally, we found that Rap1 functions as an activator of ribosomal protein genes and a repressor for HM loci genes consistent with predictions from the literature. Unexpectedly, we found that Rap1 functions as a repressor of glycolytic enzyme genes contrary to prior reports of it having the opposite effect. We also compared the expression of RAP1 to five different genes related to DNA repair pathway and found that decreasing RAP1 downregulated four of those five genes. Finally, we found no effect of RAP1 depletion on telomere-proximal genes despite its functioning to silence telomeric repeat-containing RNAs. Together our results enrich our understanding of this important transcriptional regulator.

Keywords: Bootstrapping; Gene expression; RNA-Seq; Rap1; Saccharomyces cerevisiae; Transcription factor.


Conflict of interest statement

Declaration of Competing Interest The authors declare no conflicts of interest.

Figures

Fig. 1.
Fig. 1.
Experimental design, workflow, and validation. A) Demonstration of the effect of Dox on TetO7-RAP1 strain in a Tet-Off system. The endogenous promoter of RAP1 has been replaced with the Tet-titratable promoter known as Tetracycline Response Element (TRE). When the Tetracycline-controlled trans activator (tTA) complex binds to TRE, this results in activation of gene expression. When Dox is added, the tTA cannot bind to TRE and thus this system allows for reduction of the gene expression based on the concentration of provided tetracycline family chemicals. B) The TetO7-RAP1 stain was grown to saturation in liquid YPD media. The next day the samples were diluted in fresh YPD and were allowed to reach mid-exponential growth. At this stage, the cells were again diluted in fresh YPD mixed with Dox (0 μg/mL (control), 0.01 μg/mL, 0.1 μg/mL or 0.5 μg/mL). When the cells reached OD 0.6–0.8, they were centrifuged, and the yeast pellet was snapped frozen in liquid N2 and stored at −80C. RNA from these pellets was used for qRT-PCR and RNA sequencing. C) To confirm RAP1 titration with differing Dox concentrations, we quantified RAP1 expression level with qRT-PCR at Dox concentrations from 0 to 5.0 μg/mL and a correlation was obtained between the level of RAP1 expression (Y-axis) and the media’s concentration of Dox (X-axis). D) The bioinformatics pipeline used for this analysis is shown. E) Correlation between RAP1 expression level obtained through qRT-PCR (Y-axis) vs RNAseq (X-axis) is shown.
Fig. 2.
Fig. 2.
Differential gene expression analysis and distribution of genes. Scatterplots of genome-wide gene expression (in Fragments Per Kilobase per Million reads, FPKM) in control on the X axis compared with A) 0.01 μg/mL Dox, D) 0.1 μg/mL, and G) 0.5 μg/mL Dox. Significantly differentially expressed genes are shown in cyan while non-significant genes are shown in red. The Y = X line is depicted in blue. The line of best fit (shown in black) was generated using the stat_corr() and stat_regline_equation() functions in R. The equation of the best fit line is shown in the upper left corner of each graph. The number of significant DEGs is shown in the bottom left of each graph. Volcano plots showing the log2 fold change at Dox concentration of B) 0.01 μg/mL, E) 0.1 μg/mL, and H) 0.5 μg/mL on X-axis vs the -log10(qvalue) on Y-axis. Significant DEGs are shown in blue while non-significant genes are shown in red. FPKM density distribution of significant DEGs at Dox concentration of C) 0.01 μg/mL, F) 0.1 μg/mL, and I) 0.5 μg/mL are shown. J) Venn diagram along with ridge plot showing the overlap of significant DEGs at different Dox (0.01 μg/mL, 0.1 μg/mL and 0.5 μg/mL) concentrations. K) Heatmap depicting the FPKM gene expression values in control, Dox 0.01 μg/mL, Dox 0.1 μg/mL, and Dox 0.5 μg/mL of all (5088) genes used in this study.
Fig. 3.
Fig. 3.
Studying the role of Rap1 reduction on different groups of genes. A) The dataset was divided into the direct Rap1 targets vs the rest of the genome. For both of these subgroups the log2 fold change values at Dox concentration, 0.01 μg/mL were subjected to 50,000 bootstraps with replacements. The median of each bootstrap run was computed and saved in a different vector. The same steps were repeated for Dox concentrations 0.1 and 0.5 μg/mL. This entire procedure was done for ribosomal protein genes, glycolytic genes, and telomeric proximal genes. Confidence interval distributions of the median values of log2 fold change obtained after 50,000 bootstrap iterations for B) Rap1 targets (green), D) Ribosomal protein genes (green), F) Glycolytic genes (green), and H) Telomeric genes (green) vs rest of the genome (magenta) at different Dox concentrations (0.01 μg/mL, 0.1 μg/mL and 0.5 μg/mL). Violin plot depicting the log2 fold change of C) direct Rap1 targets, E) Ribosomal protein genes, G) Glycolytic genes and I) Telomeric genes under different Dox concentrations (0.01 μg/mL, 0.1 μg/mL, and 0.5 μg/mL). The violin plots indicates the difference in medians of the log2 fold change of a specific condition vs the log2 fold change of the rest of the genome for 50,000 bootstrap iterations. The red dashed line demarcates the up and down regulation of genes J) Bar graph depicting the log2 fold change values for four HM loci genes (HMLALPHA1, HMLALPHA2, HMRA1, and HMRA2) under different Dox concentrations (0.01 μg/mL (black), 0.1 μg/mL (gray) and 0.5 μg/mL (white)). The significance of qvalues is represented as *. K) Bar graph depicting the log2 fold change values for five DNA repair genes (HUG1, RNR1, RNR2, RNR3, and RNR4) under different Dox concentrations (0.01 μg/mL (black), 0.1 μg/mL (gray) and 0.5 μg/mL (white)). The significance of qvalues is represented as *. L) (Upper) Venn diagram showing the overlap among Rap1 direct targets, RPGs, glycolytic and telomere genes. (Lower) Venn diagram showing the overlap among the Rap1 direct targets, HM loci and DNA repair genes.

Similar articles

Cited by

References

    1. Nikolov DB, Burley SK, RNA polymerase II transcription initiation: a structuralview, Proc. Natl. Acad. Sci. U. S. A 94 (1) (Jan. 1997) 15–22. - PMC - PubMed
    1. Martinez E, Multi-protein complexes in eukaryotic gene transcription, Plant Mol. Biol 50 (6) (Dec. 2002) 925–947, 10.1023/a:1021258713850. - DOI - PubMed
    1. Hobert O, Gene regulation by transcription factors and MicroRNAs, Science 319 (5871) (Mar. 2008) 1785–1786, 10.1126/science.1151651. - DOI - PubMed
    1. Kornberg RD, Mediator and the mechanism of transcriptional activation, Trends Biochem. Sci 30 (5) (May 2005) 235–239, 10.1016/j.tibs.2005.03.011. - DOI - PubMed
    1. Wan P, Hu Y, He L, Regulation of melanocyte pivotal transcription factor MITF by some other transcription factors, Mol. Cell. Biochem 354 (1) (Aug. 2011) 241–246, 10.1007/s11010-011-0823-4. - DOI - PubMed

Publication types

MeSH terms