. 2023 Aug 1;146(8):3331-3346.
doi: 10.1093/brain/awad057.

Promyelinating drugs promote functional recovery in an autism spectrum disorder mouse model of Pitt-Hopkins syndrome

Affiliations

Promyelinating drugs promote functional recovery in an autism spectrum disorder mouse model of Pitt-Hopkins syndrome

Joseph F Bohlen et al. Brain. .

Abstract

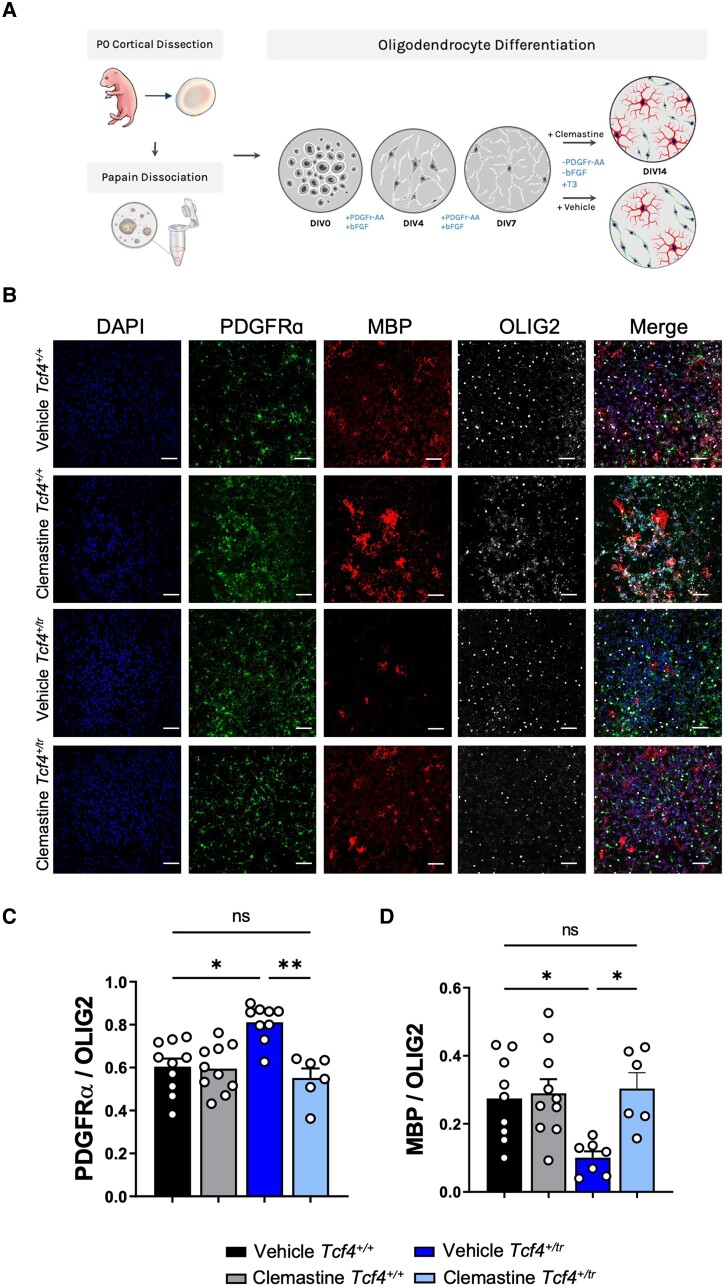
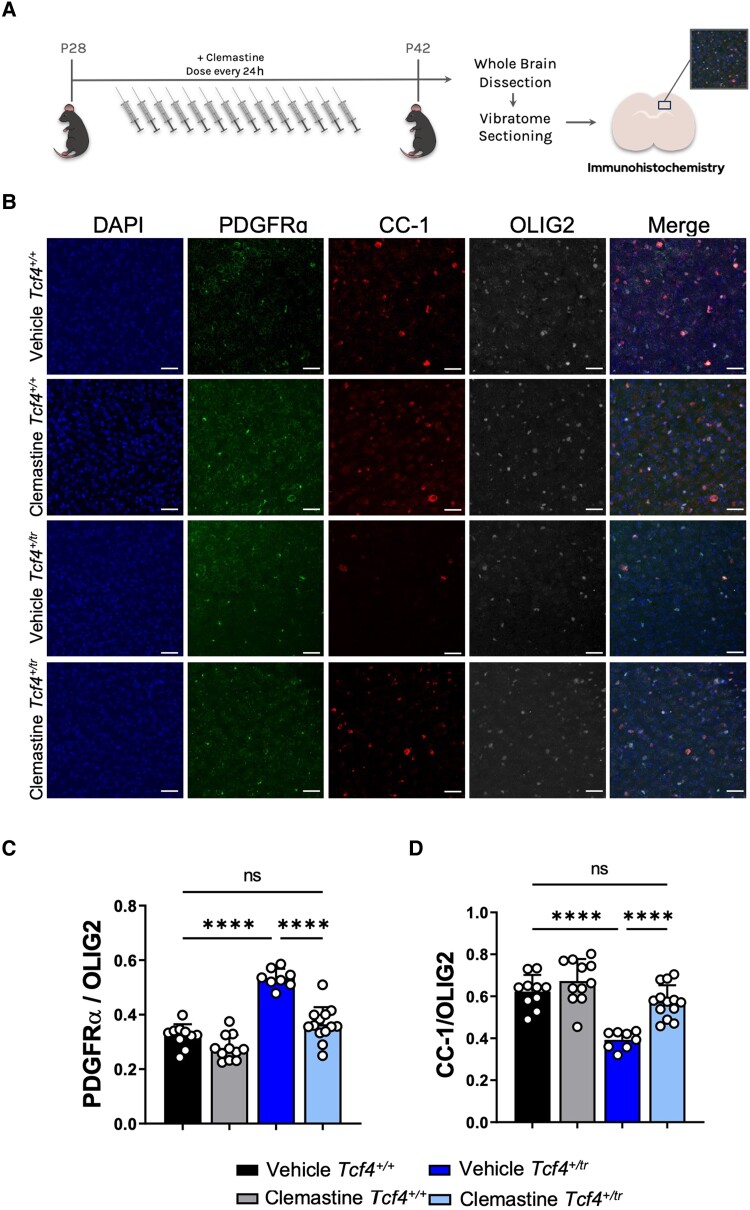
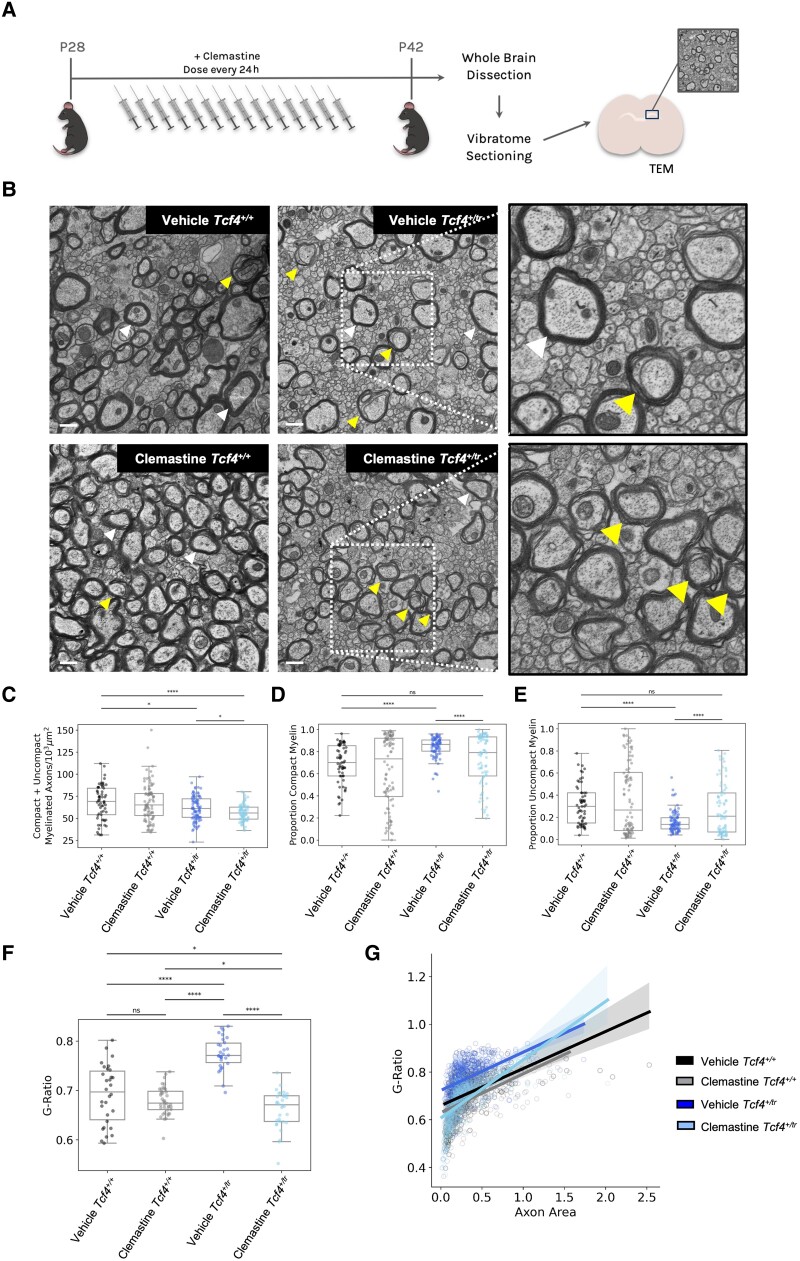
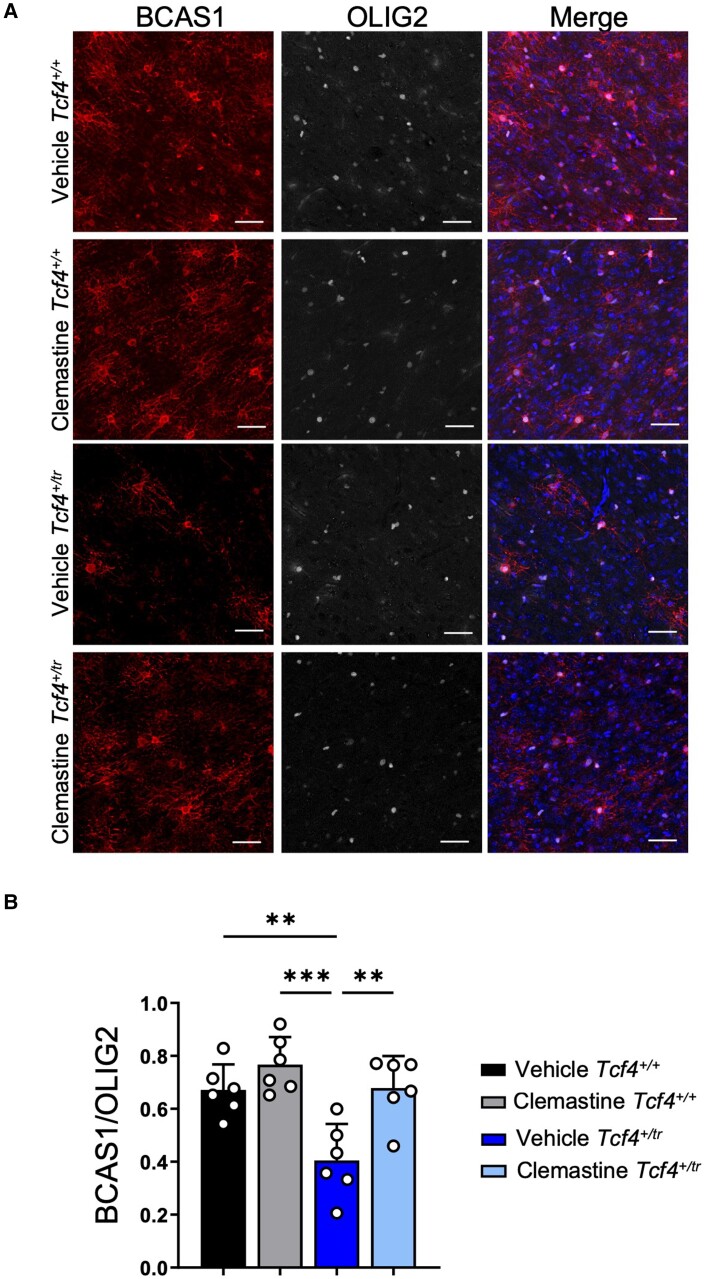
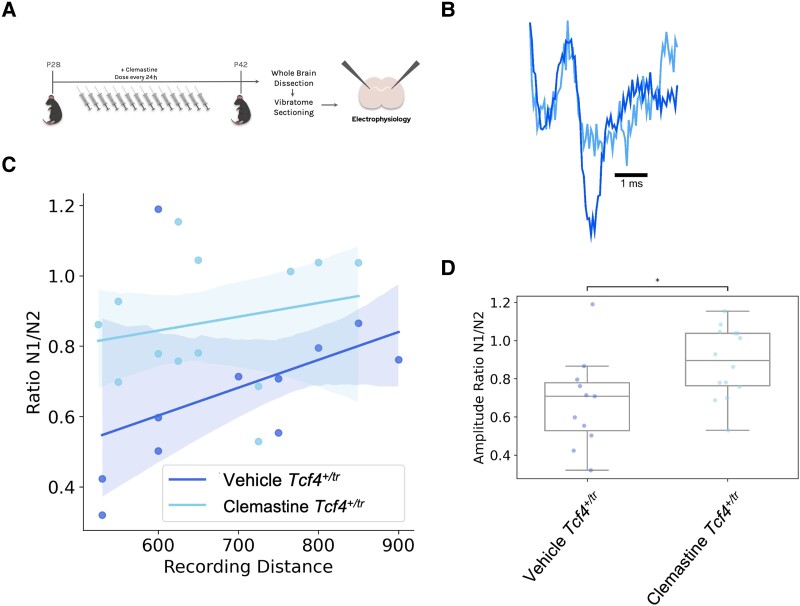
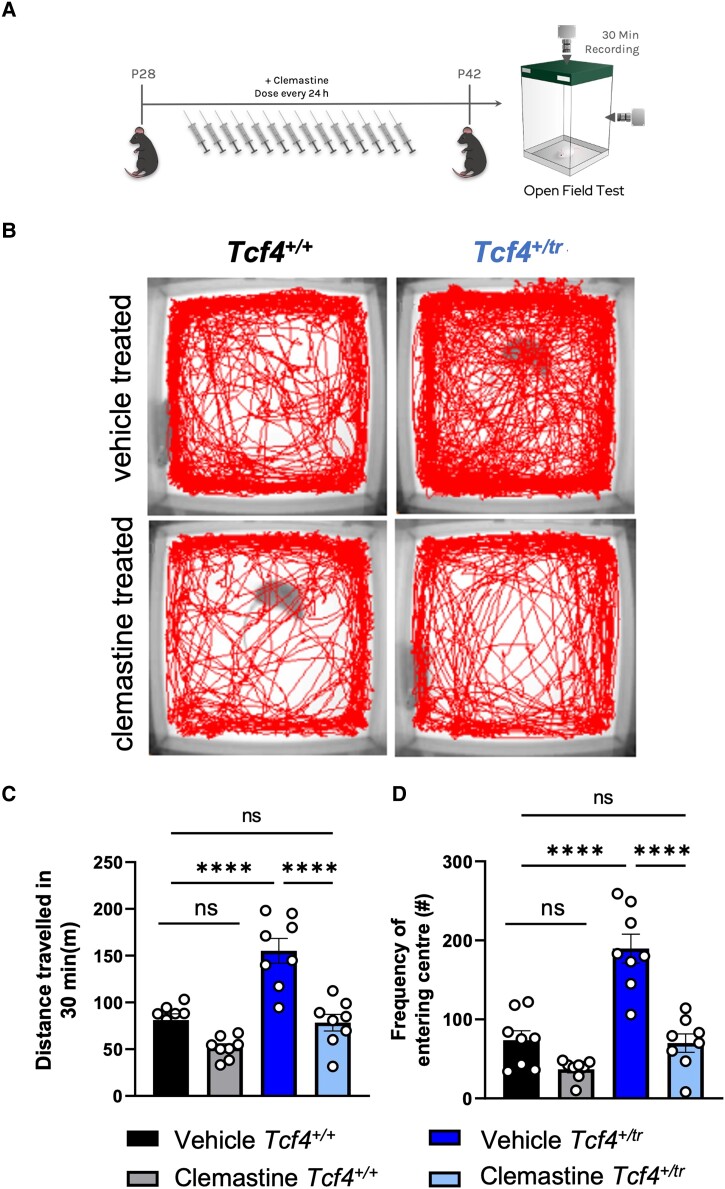
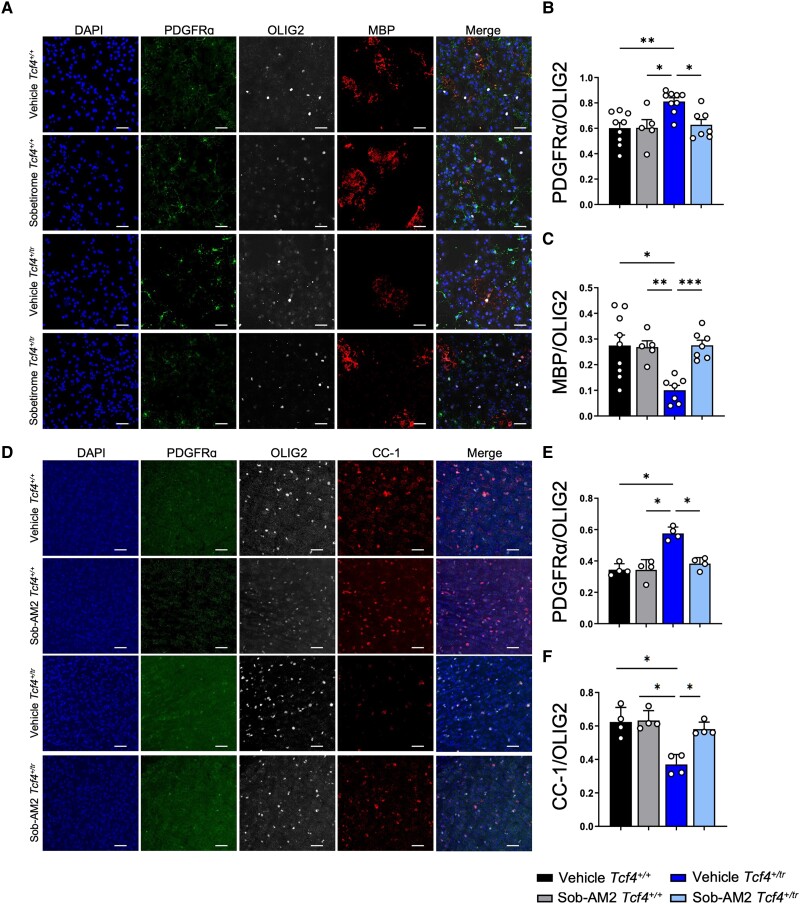
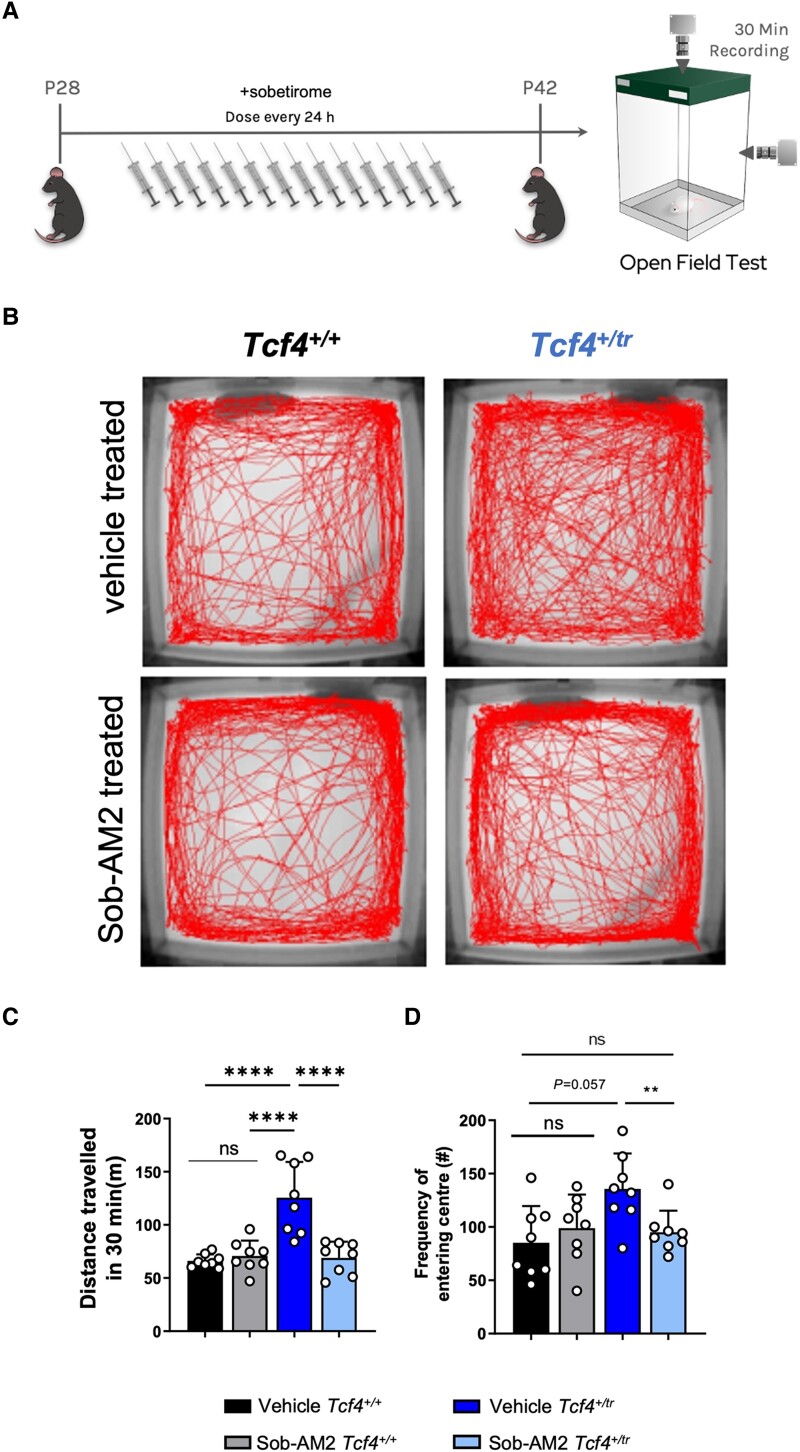
Pitt-Hopkins syndrome is an autism spectrum disorder caused by autosomal dominant mutations in the human transcription factor 4 gene (TCF4). One pathobiological process caused by murine Tcf4 mutation is a cell autonomous reduction in oligodendrocytes and myelination. In this study, we show that the promyelinating compounds, clemastine, sobetirome and Sob-AM2 are effective at restoring myelination defects in a Pitt-Hopkins syndrome mouse model. In vitro, clemastine treatment reduced excess oligodendrocyte precursor cells and normalized oligodendrocyte density. In vivo, 2-week intraperitoneal administration of clemastine also normalized oligodendrocyte precursor cell and oligodendrocyte density in the cortex of Tcf4 mutant mice and appeared to increase the number of axons undergoing myelination, as EM imaging of the corpus callosum showed a significant increase in the proportion of uncompacted myelin and an overall reduction in the g-ratio. Importantly, this treatment paradigm resulted in functional rescue by improving electrophysiology and behaviour. To confirm behavioural rescue was achieved via enhancing myelination, we show that treatment with the thyroid hormone receptor agonist sobetirome or its brain penetrating prodrug Sob-AM2, was also effective at normalizing oligodendrocyte precursor cell and oligodendrocyte densities and behaviour in the Pitt-Hopkins syndrome mouse model. Together, these results provide preclinical evidence that promyelinating therapies may be beneficial in Pitt-Hopkins syndrome and potentially other neurodevelopmental disorders characterized by dysmyelination.

Keywords: ASD; Pitt–Hopkins syndrome; clemastine; myelination; sobetirome.


Conflict of interest statement

T.S.S. is a founder and adviser to Autobahn Therapeutics. T.S.S. and T.B. are inventors of licensed patent applications claiming CNS-penetrating thyromimetics. All other authors declare no competing interests.

Figures

Figure 1
Figure 1
Clemastine increases the proportion of OLs in Tcf4+/tr cultures. (A) Graphical representation of the plating and dosing regimen. (B) Immunocytochemistry of DIV14 OPC/OL cultures following 7-day treatment with either vehicle (DMSO) or clemastine (1 μM). Cultures stained for DAPI (blue, column 1), PDGFRα (green, column 2), MBP (red, column 3) and OLIG2 (grey, column 4). Scale bars = 50 μm. (C) Summary plot showing the proportion of PDGFRα/OLIG2 cells is increased in vehicle-treated Tcf4+/tr cultures compared to vehicle-treated Tcf4+/+ cultures. The proportion of PDGFRα/OLIG2 cells is reduced in clemastine-treated Tcf4+/tr cultures compared to vehicle-treated Tcf4+/tr cultures [two-way ANOVA, n = 10–13 biologically independent animals/genotype, F(3,22) = 14.39, P < 0.0001, data are presented as mean values ± SEM]. (D) Summary plot showing the proportion of MBP/OLIG2 cells is decreased in vehicle-treated Tcf4+/tr cultures compared to vehicle-treated Tcf4+/+ cultures. The proportion of MBP/OLIG2 cells is increased in clemastine-treated Tcf4+/tr cultures compared to vehicle-treated Tcf4+/tr cultures [two-way ANOVA, n = 11–13 biologically independent animals/genotype, F(3,19) = 5.966, P = 0.0048 data are presented as mean values ± SEM]. *P < 0.05, **P < 0.01.
Figure 2
Figure 2
In vivo clemastine treatment increases the proportion of OLs in Tcf4+/tr mice. (A) Graphical representation of the dosing regime in vivo. (B) Immunohistochemistry of OPC/OL in 55 μm-thick tissue sections following 14-day treatment of either vehicle (DMSO) or clemastine. Tissue stained for DAPI (blue, column 1), PDGFRα (green, column 2), MBP (red, column 3) and OLIG2 (grey, column 4). Scale bars = 50 μm. (C) Summary plot showing the proportion of PDGFRα/OLIG2 cells is increased in vehicle-treated Tcf4+/tr mice compared to vehicle-treated Tcf4+/+ mice. The proportion of PDGFRα/OLIG2 cells is reduced in clemastine-treated Tcf4+/tr mice compared to vehicle-treated Tcf4+/tr mice [two-way ANOVA, n = 10–13 biologically independent animals/genotype, F(3,23) = 58.28, P < 0.0001, data are presented as mean values ± SEM]. (D) Summary plot showing the proportion of MBP/OLIG2 cells is decreased in vehicle-treated Tcf4+/tr mice compared to vehicle-treated Tcf4+/+ mice. The proportion of MBP/OLIG2 cells is increased in clemastine-treated Tcf4+/tr mice compared to vehicle-treated Tcf4+/tr mice [two-way ANOVA, n = 10–13 biologically independent animals/genotype, F(3,23) = 26.20, P < 0.0001, data are presented as mean values ± SEM]. ****P < 0.0001.
Figure 3
Figure 3
Clemastine increases the proportion of uncompacted myelinated axons and reduces the g-ratio in the CC of the Tcf4+/tr mice. (A) Graphical representation of the dosing regime and subsequent TEM. (B) Representative electron micrographs of the CC from vehicle and clemastine-treated Tcf4+/+ and Tcf4+/tr mice. Arrowheads indicate compacted (white) and uncompacted (yellow) myelin designations. Scale bars = 500 nm. (C) Summary plot showing the density of compacted + uncompacted myelinated axons across all images for all conditions showing Tcf4+/tr mice show a reduction in total myelin compared to Tcf4+/+ littermates. The density of myelinated axons was reduced in vehicle-treated Tcf4+/tr mice compared to vehicle-treated Tcf4+/+ littermates (two-way ANOVA biologically independent animals/genotype F = 1.54, P = 0.22). (D) Proportion of compacted myelin per image showing a smaller proportion of compacted myelin in vehicle-treated Tcf4+/tr mice compared to vehicle-treated Tcf4+/+ mice. The proportion of compact myelin was reduced in clemastine-treated Tcf4+/tr mice compared to vehicle-treated Tcf4+/tr mice (two-way ANOVA biologically independent animals/genotype F = 1.24, P = 0.26). (E) Proportion of uncompacted myelin per image showing a smaller proportion of compacted myelin in vehicle-treated Tcf4+/tr mice compared to vehicle-treated Tcf4+/+ mice. The proportion of compacted myelin was increased in clemastine Tcf4+/tr mice compared to vehicle-treated Tcf4+/tr mice (two-way ANOVA biologically independent animals/genotype F = 1.24 P = 0.26). (F) Summary plot showing the g-ratios across all conditions, analysis of three to four animals per condition (100–200 myelinated axons per animal collected). The g-ratio was elevated in vehicle-treated Tcf4+/tr mice compared to vehicle-treated Tcf4+/+ mice. The g-ratio was reduced in clemastine-treated Tcf4+/tr mice compared to vehicle-treated Tcf4+/tr mice (two-way ANOVA biologically independent animals/genotype F = 49.16, P < 0.0001). (G) Distribution of g-ratios for all conditions (ANCOVA F = 244.5, P-value < 0.0001). Centre values represent the mean and error bars are SEM, *P < 0.05, ****P < 0.0001.
Figure 4
Figure 4
Clemastine increases the number of pre-myelinating OLs in Tcf4+/tr mice. (A) Immunohistochemistry of OPC/OL in 55 μM tissue slices following 14 days of either vehicle (DMSO) or clemastine administration. Tissue stained for DAPI (blue), BCAS1 (red, column 1) and OLIG2 (grey, column 2). Scale bars = 50 μm. (B) Summary plot showing a reduction in proportion of BCAS1/OLIG2 positive cells in vehicle-treated Tcf4+/tr mice compared to vehicle-treated Tcf4+/+ mice. The proportion of BCAS1/OLIG2 positive cells was increased in clemastine-treated Tcf4+/tr mice compared to vehicle-treated Tcf4+/tr mice [two-way ANOVA, n = 6 biologically independent animals/genotype F(1,5) = 18.73, P < 0.0001, data are presented as mean values ± SEM]. **P < 0.01, ***P < 0.001.
Figure 5
Figure 5
Clemastine rescues electrophysiological deficits in the Tcf4+/tr mice. (A) Graphical representation of the dosing regime and subsequent electrophysiology. (B) Representative electrophysiology traces of evoked CAPs recorded in the CC from vehicle Tcf4+/tr and clemastine-treated Tcf4+/tr mice. N1 represents action potentials travelling down myelinated axons and N2 represents action potentials travelling down unmyelinated axons. Example traces are normalized by the N1 peak. (C) Linear regression fit of the N1/N2 ratio at its respective recording distance (ANCOVA F = 6.43, P = 0.019). (D) The proportion of action potentials travelling down myelinated axons was consistently reduced in vehicle-treated Tcf4+/tr mice compared to clemastine-treated Tcf4+/tr mice (P = 0.034).
Figure 6
Figure 6
Clemastine rescues behavioural deficits in Tcf4+/tr mice. (A) Graphical representation of the dosing regime and subsequent behavioural analysis. (B) Locomotor activity maps from Tcf4+/+ and Tcf4+/tr mice treated with vehicle or clemastine for 14 days. Movement was recorded for 30 min following placement in a 37.5 × 37.5 cm novel open field arena. (C) Summary plot showing vehicle-treated Tcf4+/tr mice have hyperlocomotion compared to vehicle-treated Tcf4+/+ mice. Hyperlocomotion is reduced in clemastine-treated Tcf4+/tr mice compared to vehicle-treated Tcf4+/+ mice [two-way ANOVA, n = 8 biologically independent animals/genotype, F(1,7) = 20.41, P = 0.0027, data are presented as mean values ± SEM]. (D) Summary plot showing the frequency of entering the centre (middle 15.25 × 15.25 cm) is increased in vehicle-treated Tcf4+/tr mice compared to vehicle-treated Tcf4+/+ mice. The frequency of entering the centre is reduced in clemastine-treated Tcf4+/tr mice compared to vehicle-treated Tcf4+/+ mice [two-way ANOVA, n = 8 biologically independent animals/genotype, F(1,7) = 10.36, P = 0.0147]. Centre values represent the mean and error bars are SEM, ****P < 0.0001.
Figure 7
Figure 7
Sobetirome and Sob-AM2 increase the proportion of OLs both in vitro and in vivo in Tcf4+/tr mice. (A) Immunocytochemistry of DIV14 OPC/OL cultures following 7-day treatment of either vehicle (DMSO) or sobetirome (1 μM). Cultures stained for DAPI (blue, column 1), PDGFRα (green, column 2), MBP (red, column 4) and OLIG2 (grey, column 3). Scale bars = 50 μm. (B) Summary plot showing increased proportion of PDGFRα/OLIG2 cells in vehicle-treated Tcf4+/tr cultures compared to vehicle-treated Tcf4+/+ cultures. The proportion of PDGFRα/OLIG2 cells in clemastine-treated Tcf4+/tr cultures is reduced compared to vehicle-treated Tcf4+/tr cultures [two-way ANOVA, n = 8 biologically independent animals/genotype, F(1,7) = 14.36, P = 0.0068, data are presented as mean values ± SEM]. (C) Summary plot showing decreased proportion of MBP/OLIG2 cells in vehicle-treated Tcf4+/tr cultures compared to vehicle-treated Tcf4+/+ cultures. The proportion of MBP/OLIG2 cells is increased in clemastine-treated Tcf4+/tr cultures compared to vehicle-treated Tcf4+/tr cultures [two-way ANOVA, n = 8 biologically independent animals/genotype, F(1,6) = 18.65, P = 0.005, data are presented as mean values ± SEM]. (D) Immunohistochemistry of OPC/OL in 55 μm-thick tissue sections following 14-day treatment of either vehicle (DMSO) or Sob-AM2. Tissue stained for DAPI (blue, column 1), PDGFRα (green, column 2), CC-1 (red, column 4) and OLIG2 (grey, column 3). (E) Summary plot showing increased proportion of PDGFRα/OLIG2 cells in vehicle-treated Tcf4+/tr mice compared to vehicle-treated Tcf4+/+ mice. The proportion of PDGFRα/OLIG2 cells in clemastine-treated Tcf4+/tr mice is reduced compared to vehicle-treated Tcf4+/tr mice [two-way ANOVA, n = 4 biologically independent animals/genotype, F(1,3) = 16.78, P = 0.0263, data are presented as mean values ± SEM]. (F) Summary plot showing decreased proportion of CC-1/OLIG2 cells in vehicle-treated Tcf4+/tr mice compared to vehicle-treated Tcf4+/+ mice. The proportion of CC-1/OLIG2 cells is increased in clemastine-treated Tcf4+/tr cultures compared to vehicle-treated Tcf4+/tr cultures [two-way ANOVA, n = 4 biologically independent animals/genotype, F(1,3) = 15.57, P = 0.029, data are presented as mean values ± SEM].
Figure 8
Figure 8
Sob-AM2 rescues behavioural deficits in Tcf4+/tr mice. (A) Graphical representation of the dosing regime and subsequent behavioural analysis. (B) Locomotor activity maps from Tcf4+/+ and Tcf4+/tr mice treated with vehicle or Sob-AM2 for 14 days. Movement was recorded for 30 min following placement in a 37.5 × 37.5 cm novel open field arena. (C) Summary plot showing vehicle-treated Tcf4+/tr mice have hyperlocomotion compared to vehicle-treated Tcf4+/+ mice. Hyperlocomotion is reduced in Sob-AM2 treated Tcf4+/tr mice compared to vehicle-treated Tcf4+/+ mice [n = 8 biologically independent animals/genotype, F(1,7) = 7.44, P = 0.029, data are presented as mean values ± SEM]. (D) Summary plot showing the frequency of entering the centre (middle 15.25 × 15.25 cm) is increased in vehicle-treated Tcf4+/tr mice compared to vehicle-treated Tcf4+/+ mice. The frequency of entering the centre is reduced in clemastine-treated Tcf4+/tr mice compared to vehicle-treated Tcf4+/+ mice [n = 8 biologically independent animals/genotype, F(1,7) = 1.22, P = 0.305, data are presented as mean values ± SEM]. **P < 0.01, ****P < 0.0001.

Similar articles

Cited by

References

    1. Chen H-Y, Bohlen JF, Maher BJ. Molecular and cellular function of transcription factor 4 in Pitt-Hopkins syndrome. Dev Neurosci. 2021;43:159–167. - PMC - PubMed
    1. Thaxton C, Kloth AD, Clark EP, Moy SS, Chitwood RA, Philpot BD. Common pathophysiology in multiple mouse models of Pitt-Hopkins syndrome. J Neurosci. 2018;38:918–936. - PMC - PubMed
    1. Cleary CM, James S, Maher BJ, Mulkey DK. Disordered breathing in a Pitt-Hopkins syndrome model involves Phox2b-expressing parafacial neurons and aberrant Nav1.8 expression. Nat Commun. 2021;12:5962. - PMC - PubMed
    1. Grubišić V, Kennedy AJ, Sweatt JD, Parpura V. Pitt-Hopkins mouse model has altered particular gastrointestinal transits in vivo. Autism Res. 2015;8:629–633. - PMC - PubMed
    1. Kennedy AJ, Rahn EJ, Paulukaitis BS, et al. . Tcf4 regulates synaptic plasticity, DNA methylation, and memory function. Cell Rep. 2016;16:2666–2685. - PMC - PubMed

Publication types

Supplementary concepts