. 2023 Apr 17;14(1):2111.
doi: 10.1038/s41467-023-37735-y.

ARRDC5 expression is conserved in mammalian testes and required for normal sperm morphogenesis

Affiliations

ARRDC5 expression is conserved in mammalian testes and required for normal sperm morphogenesis

Mariana I Giassetti et al. Nat Commun. .

Abstract

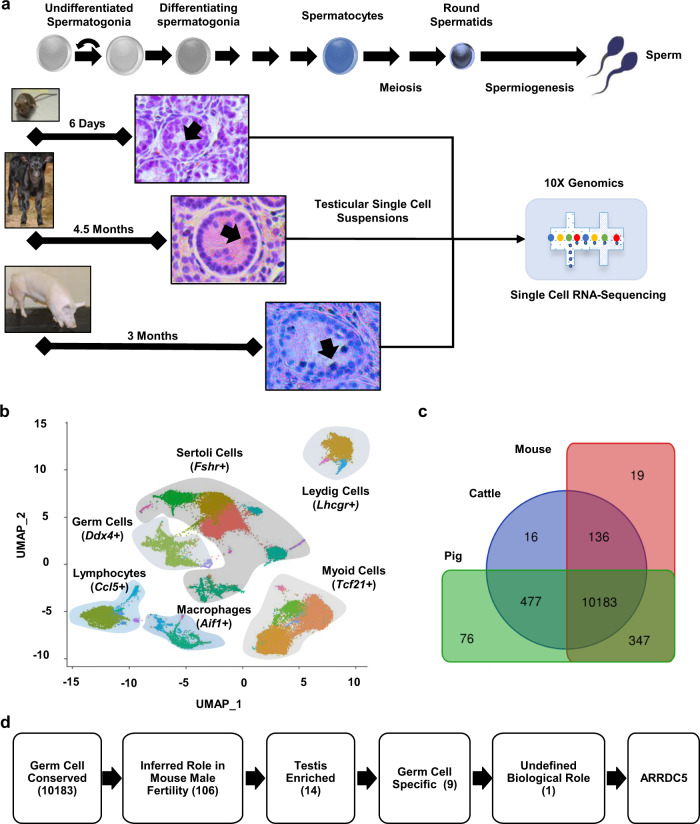
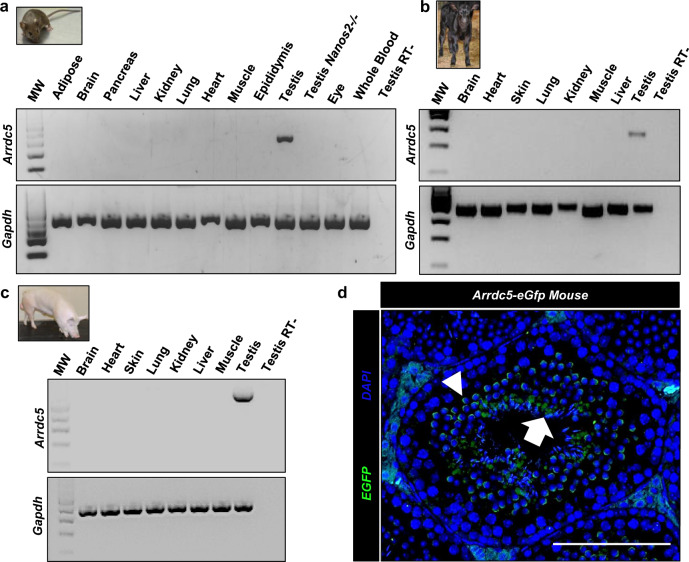
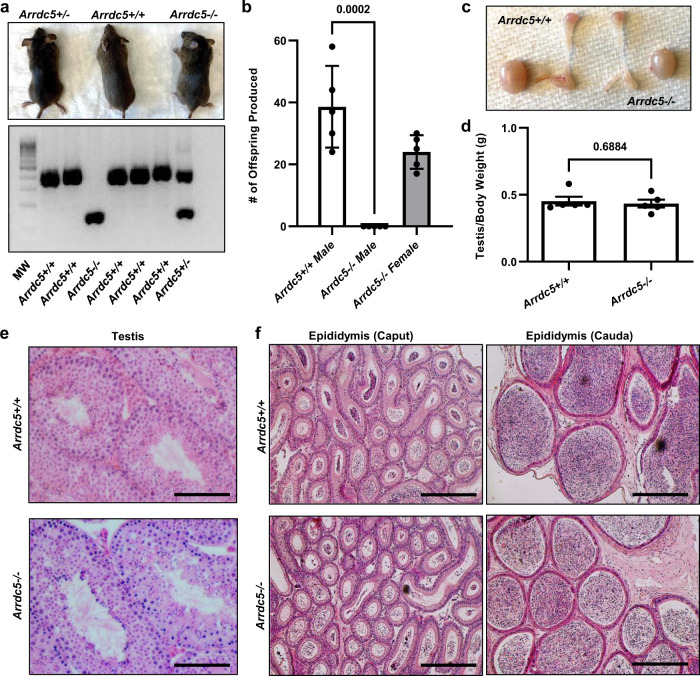
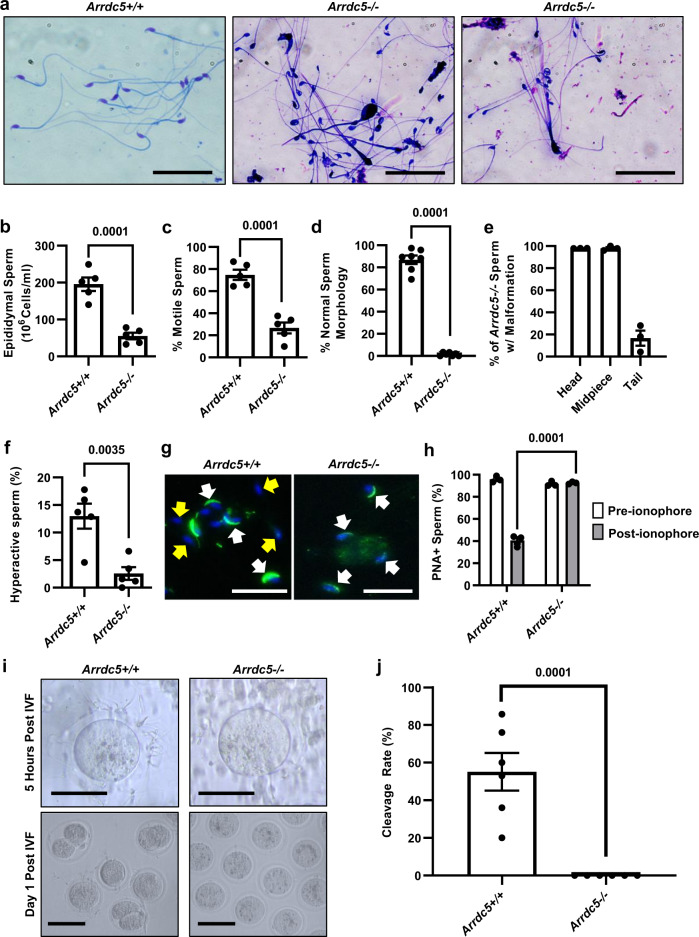
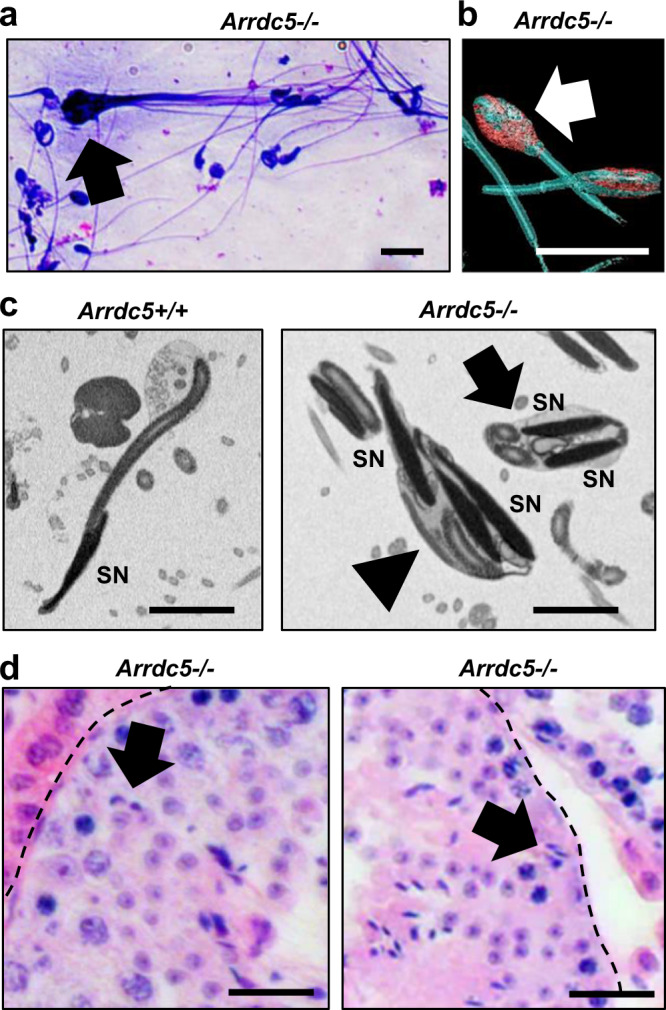
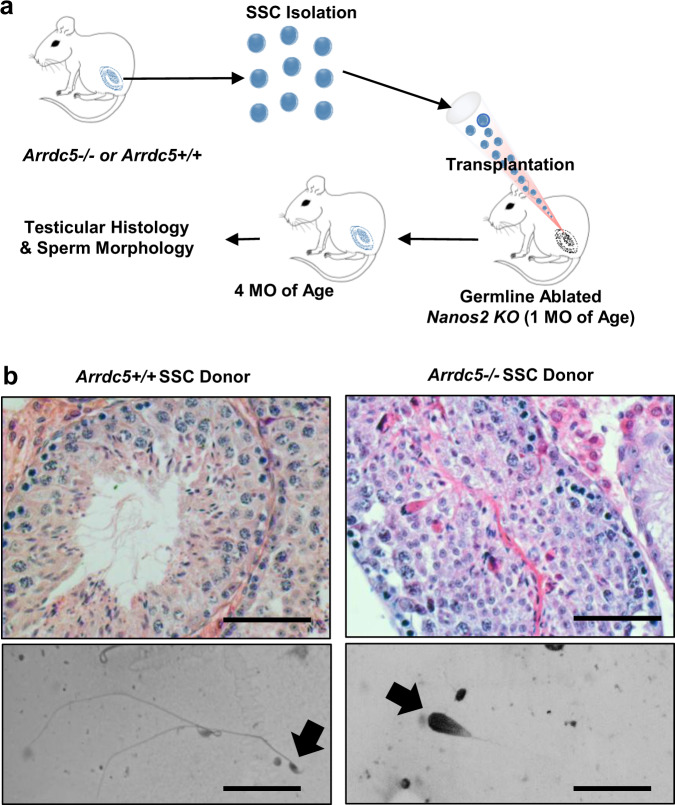
In sexual reproduction, sperm contribute half the genomic material required for creation of offspring yet core molecular mechanisms essential for their formation are undefined. Here, the α-arrestin molecule arrestin-domain containing 5 (ARRDC5) is identified as an essential regulator of mammalian spermatogenesis. Multispecies testicular tissue transcriptome profiling indicates that expression of Arrdc5 is testis enriched, if not specific, in mice, pigs, cattle, and humans. Knockout of Arrdc5 in mice leads to male specific sterility due to production of low numbers of sperm that are immotile and malformed. Spermiogenesis, the final phase of spermatogenesis when round spermatids transform to spermatozoa, is defective in testes of Arrdc5 deficient mice. Also, epididymal sperm in Arrdc5 knockouts are unable to capacitate and fertilize oocytes. These findings establish ARRDC5 as an essential regulator of mammalian spermatogenesis. Considering the role of arrestin molecules as modulators of cellular signaling and ubiquitination, ARRDC5 is a potential male contraceptive target.


Conflict of interest statement

The authors declare no competing interests.

Figures

Fig. 1
Fig. 1. Generation of a multispecies integrated testicular single-cell transcriptome database.
a Schematic of the experimental strategy that analyzed testicular tissue from prepubertal mice, cattle, and pigs by single-cell RNA-sequencing. Representative images of hematoxylin and eosin-stained testicular cross-sections are shown, arrows denote germ cells within seminiferous tubules. b Integrated uniform manifold approximation and projection (UMAP) plot for ~48,000 testicular cells from three species. Distinct clusters of testicular cell types were defined based on the expression of canonical biomarker genes. c Venn diagram analysis of gene expression in the germ cell cluster based on species identity, which yielded 10,183 genes as having conserved expression across mouse, cattle, and pig. d Bioinformatic filtering pipeline to identify novel evolutionarily conserved candidate molecules that could be essential regulators of spermatogenesis. The number of genes selected at each step are in parentheses.
Fig. 2
Fig. 2. Arrdc5 expression profile in mammalian species.
a RT-PCR analysis of Arrdc5 mRNA in mouse tissues. MW is 100 bp DNA ladder and Gapdh was used as a loading control. Nanos2−/− testes are ablated of germ cells. b RT-PCR analysis of Arrdc5 mRNA in cattle tissues. MW is a 100 bp DNA ladder and Gapdh was used as a loading control. c RT-PCR analysis of Arrdc5 mRNA in pig tissues. MW is a 100 bp DNA ladder and Gapdh was used as a loading control. d Seminiferous tubule cross-sections from testes of adult Arrdc5-eGfp mice that were immunostained for EGFP (green color) to assess cell type expression of Arrdc5 protein. DAPI (blue color) was used to stain DNA. Arrow indicates elongated spermatids and the arrowhead indicates stained round spermatids. Bar is 50 μm. All images are representative of three independently repeated experiments.
Fig. 3
Fig. 3. Impact of Arrdc5 genetic inactivation in mice.
a Male mice heterozygous (+/−), homozygous (−/−), or non-possessing (+/+) of an inactivating 308 bp deletion allele for the Arrdc5 coding sequence, and an agarose gel for visualization of genomic DNA genotyping analysis. MW is a 100 bp DNA ladder. b Quantitation of fecundity for adult Arrdc5−/− male and female mice as well as control Arrdc5+/+ male littermates over a 4-month period of pairing with wild-type female or male mice. Data bars are mean ± SEM of the total numbers of pups born and dots represent values for individual animals (n = 5 for each genotype). c Testes and epididymis from adult Arrdc5−/− and Arrdc5+/+ littermates. d Quantitation of the testis/body weight ratio for adult Arrdc5−/− and Arrdc5+/+ littermates. Data bars are mean ± SEM and dots represent values for individual animals (n = 5 for each genotype). e Hematoxylin and eosin-stained cross-sections from testes of adult Arrdc5−/− and Arrdc5+/+ littermates. Bars are 100 μm. f Hematoxylin and eosin-stained cross-sections from the head (caput) and tail (cauda) of epididymis from adult Arrdc5−/− and Arrdc5+/+ littermates. Bars are 100 μm. Images are representative of >10 (a) and 5 (c, e, f) independently repeated experiments. For quantitative comparisons, differences between genotypes were analyzed statistically using unpaired two-tailed t-tests. Source data are provided as a Source Data file.
Fig. 4
Fig. 4. Sperm parameter assessment of Arrdc5−/− mice.
a Dip Quick stained epididymal sperm from adult Arrdc5+/+ and Arrdc5−/− littermates. Bars are 50 μm. bd Quantitative comparison of epididymal sperm concentration b, motility c, normal morphology d between adult Arrdc5+/+ and Arrdc5−/− littermates. Data bars are mean ± SEM and dots represent values for individual animals (b, c: n = 5 for each genotype; d: n = 7 for each genotype). e Categorization of morphological abnormalities for epididymal sperm from adult Arrdc5−/− mice. Data bars are mean ± SEM and dots represent values for individual animals (n = 3). f Quantitative comparison of epididymal sperm hyperactivation between adult Arrdc5+/+ and Arrdc5−/− littermates following in vitro capacitation induction. Data bars are mean ± SEM and dots represent values for individual animals (n = 5 for each genotype). g Epididymal sperm heads from adult Arrdc5+/+ and Arrdc5−/− littermates fluorescently stained for peanut agglutinin (PNA) to assess acrosome intactness. Yellow arrows indicate acrosome-reacted sperm heads without PNA staining following in vitro capacitation induction. White arrows indicate acrosome intact sperm heads with PNA staining. Bars are 20 μm. h Quantitative comparison of epididymal sperm from adult Arrdc5+/+ and Arrdc5−/− littermates with detectable PNA binding before and after Ca2+ ionophore treatment to induce the acrosome reaction. Data bars are mean ± SEM and dots represent values for individual animals (n = 3 for each genotype). i Oocytes after 5 h or 1 day of in vitro fertilization (IVF) with epididymal sperm from adult Arrdc5+/+ or Arrdc5−/− littermates. Bars are 100 μm. j Quantitative comparison of embryo cleavage rate following in vitro fertilization of wild-type zona-pellucida intact oocytes with epididymal sperm from adult Arrdc5+/+ or Arrdc5−/− littermates. Data bars are mean ± SEM and dots represent values for individual animals (n = 6 for each genotype). Images are representative of 5 (a), 3 (g), and 6 (i) independently repeated experiments. For quantitative comparisons, differences between genotypes were analyzed statistically using unpaired two-tailed t-tests (bd, f, j) or two-way ANOVA with multiple comparisons (h). Source data are provided as a Source Data file.
Fig. 5
Fig. 5. Assessment of spermatocytogenesis in Arrdc5−/− mice.
a Seminiferous tubule cross-sections from testes of adult Arrdc5+/+ and Arrdc5−/− littermates. Tubules at different groupings for the stage of the seminiferous cycle are indicated. Bars are 50 μm. b Seminiferous tubule cross-sections from testes of adult Arrdc5−/− mice for which a stage of the seminiferous cycle was not definable (indicated at undefined or UD). Bars are 50 μm. c Quantitative comparison of distribution for the 12 stages of the seminiferous cycle in cross-sections of testes from adult Arrdc5+/+ and Arrdc5−/− littermates, grouped as I–IV, V–VIII, and IX–XII. Data bars are mean for at least 50 cross-sections from n = 3 different animals of each genotype. Cross-sections for which a clearly definable stage could not be assigned (undefined or UD) were observed from testes of Arrdc5−/− mice only. df Quantitative comparison of undifferentiated spermatogonia d, pachytene spermatocytes e, and round spermatids f in cross-sections of testes from adult Arrdc5+/+ and Arrdc5−/− littermates. Data bars are mean ± SEM and dots represent values for individual animals (n = 3 for each genotype and 150 cross-sections). Images in a and b are representative of three independently repeated experiments. For quantitative comparisons, differences between genotypes were analyzed statistically using unpaired two-tailed t-tests. Source data are provided as a Source Data file.
Fig. 6
Fig. 6. Assessment of spermiogenesis in Arrdc5−/− mice.
a Schematic depicting the major steps in spermiogenesis that occur in the seminiferous epithelium of mouse testes. b Three-dimensional scanning electron microscopy for epididymal sperm of adult Arrdc5+/+ and Arrdc5−/− littermates. A variety of sperm head, neck, midpiece, and tail defects were observed for sperm of Arrdc5−/− mice, including retained cytoplasm as indicated by red coloring. Bars are 5 μm. c Transmission electron microscopy for epididymal sperm of adult Arrdc5+/+ and Arrdc5−/− littermates. Defects in the sperm nucleus (SN), post acrosomal segment (PS, arrows), and mitochondrial sheath (MS, arrowheads) of the midpiece (MP, brackets) were observed for sperm of Arrdc5−/− mice compared to sperm from Arrdc5+/+ littermates. Bars are 5 μm. d Comet assay analysis for DNA fragmentation of epididymal sperm from adult Arrdc5+/+ and Arrdc5−/− littermates. Bars are 1 μm. e Quantitative comparison of DNA fragmentation levels (defined by the Comet tail moment) for epididymal sperm from adult Arrdc5+/+ and Arrdc5−/− littermates. Data bars are mean ± SEM and dots represent values for individual animals (n = 3 different animals of each genotype and ten images of 600–700 sperm). Images in bd are representative of three independently repeated experiments. Differences between genotypes were analyzed statistically using unpaired two-tailed t-tests. Source data are provided as a Source Data file.
Fig. 7
Fig. 7. Assessment of spermiation defects in Arrdc5−/− mice.
a Dip Quick stained epididymal sperm from adult Arrdc5−/− mice. Arrow indicates a conglomerate of sperm that have been prematurely released from the seminiferous epithelium. Bar is 10 μm. b Three-dimenional scanning electron microscopy for epididymal sperm from adult Arrdc5−/− mice with an enlarged head wrapped in residual cytoplasm (arrow). Bar is 10 μm. c Transmission electron microscopy for epididymal sperm from adult Arrdc5+/+ and Arrdc5−/− littermates. Sperm heads with multiple nuclei (SN) that are interconnected (arrow) or enfolded by cytoplasm (arrowhead) were observed for Arrdc5−/− mice, an oddity that is not observed with sperm from Arrdc5+/+ mice. Bars are 5 μm. d Seminiferous tubule cross-sections from testes of adult Arrdc5−/− mice in which elongated spermatids (indicated by arrows) are embedded deep in the seminiferous epithelium. Bars are 25 μm and dashed lines indicate seminiferous tubule basement membrane. All images are representative of three independently repeated experiments.
Fig. 8
Fig. 8. Assessment of germ cell-intrinsic defects of Arrdc5−/− mice.
a Schematic of experimental strategy to assess whether defects in spermiogenesis are intrinsic to germ cells of Arrdc5−/− mice. b Seminiferous tubule cross-sections from testes (upper panel) and epididymal flushing (lower panel) of recipient mice 3 months after transplantation with spermatogonial stem cells from adult Arrdc5+/+ or Arrdc5−/− littermates. Normal spermatogenesis was observed for recipient males transplanted with spermatogonial stem cells from Arrdc5+/+ donor males, whereas abnormal spermatogenesis was observed for recipients transplanted with spermatogonial stem cells from Arrdc5−/− donor males. Bars are 25 μm (upper panel of cross-sections) and 50 μm (lower panel of flushing). Images are representative of two independently repeated experiments.

References

    1. Russell, L. D., Ettlin, R. A., Hikim, A. P. S & Cless, E. D. Histological and Histopathological Evaluation of the Testis 1st edn (Cache River Press, 1990).
    1. Eddy EM. The germ line and development. Dev. Genet. 1996;19:287–289. doi: 10.1002/(SICI)1520-6408(1996)19:4<287::AID-DVG1>3.0.CO;2-5. - DOI - PubMed
    1. Roosen-Runge EC. Kinetics of spermatogenesis in mammals. Ann. N. Y Acad. Sci. 1952;55:574–584. doi: 10.1111/j.1749-6632.1952.tb26577.x. - DOI - PubMed
    1. Pastuszak AW, Lamb DJ. The genetics of male fertility-from basic science to clinical evaluation. J. Androl. 2012;33:1075–1084. doi: 10.2164/jandrol.112.017103. - DOI - PubMed
    1. Matzuk MM, Lamb DJ. The biology of infertility: research advances and clinical challenges. Nat. Med. 2008;14:1197–1213. doi: 10.1038/nm.f.1895. - DOI - PMC - PubMed

Publication types