. 2023 Apr 17;14(1):2184.
doi: 10.1038/s41467-023-37167-8.

DRAG in situ barcoding reveals an increased number of HSPCs contributing to myelopoiesis with age

Affiliations

DRAG in situ barcoding reveals an increased number of HSPCs contributing to myelopoiesis with age

Jos Urbanus et al. Nat Commun. .

Abstract

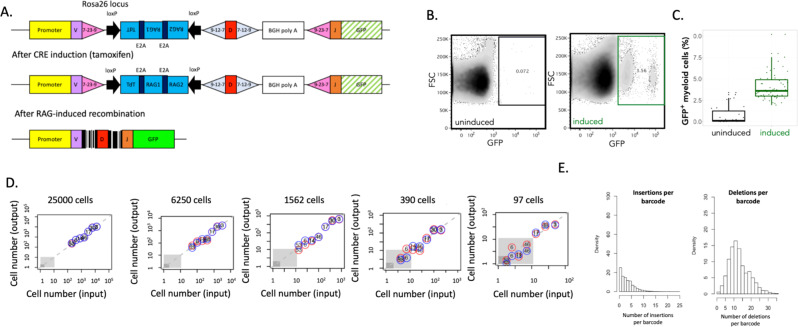
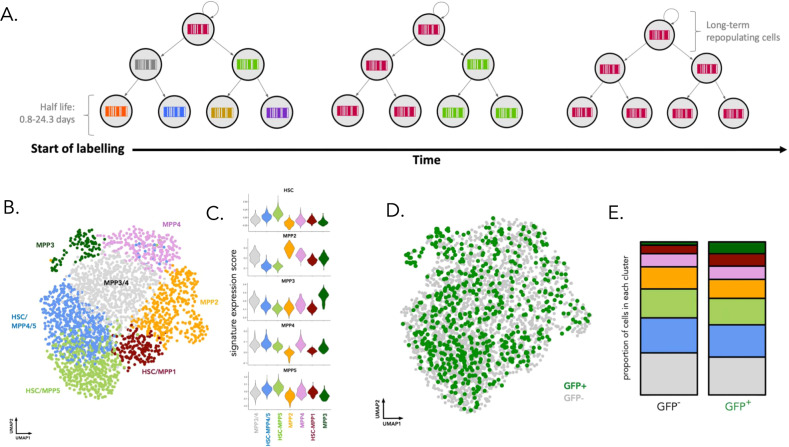
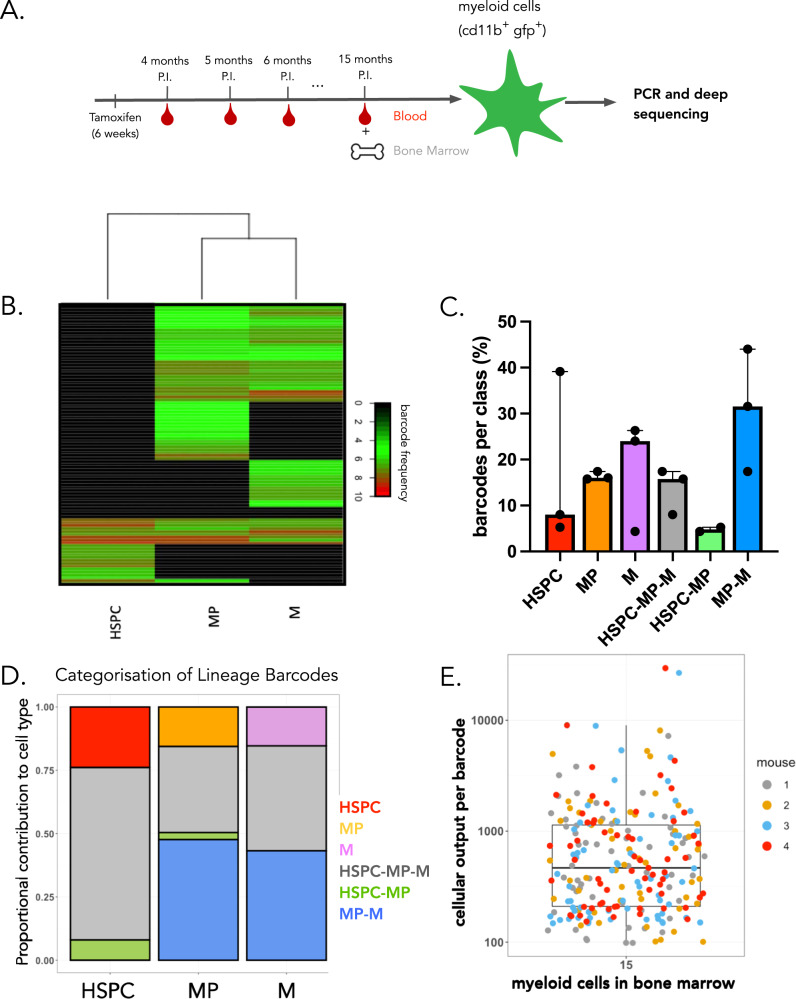
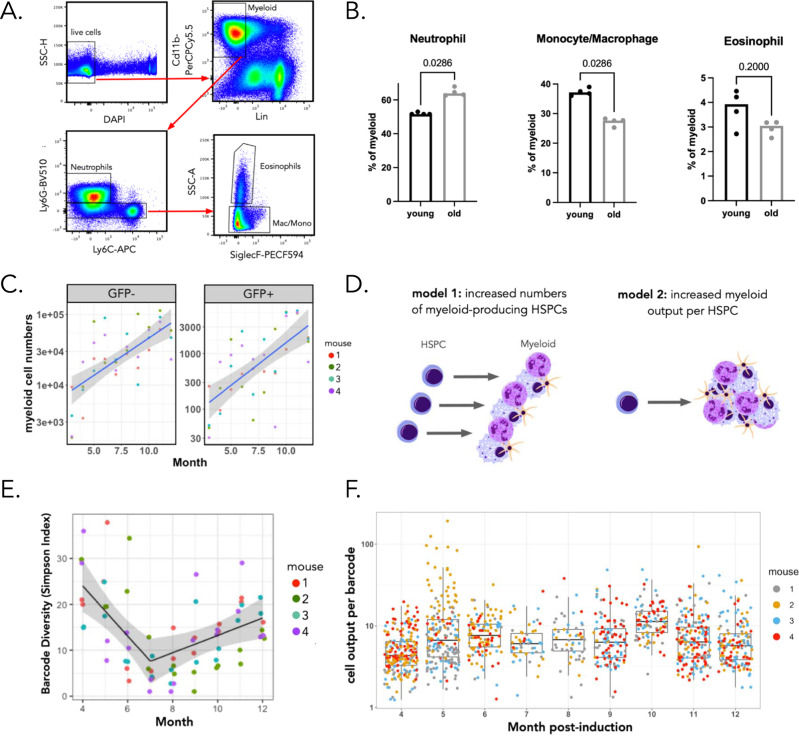
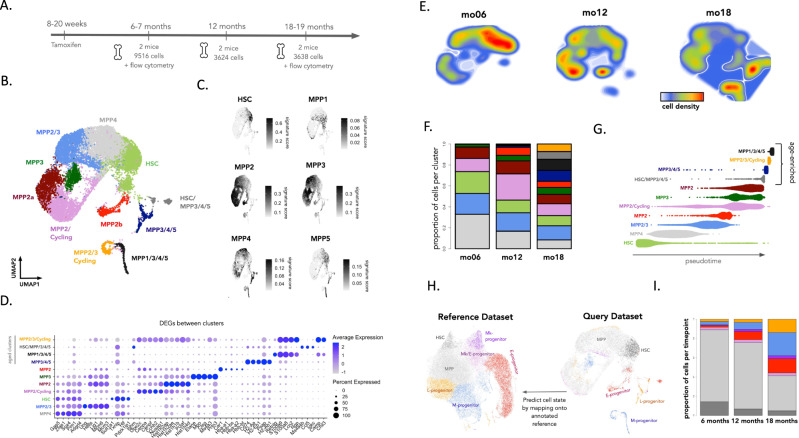
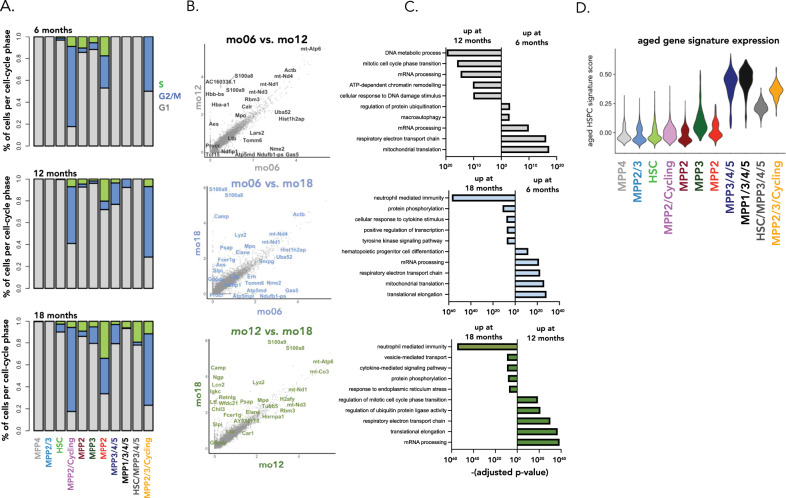
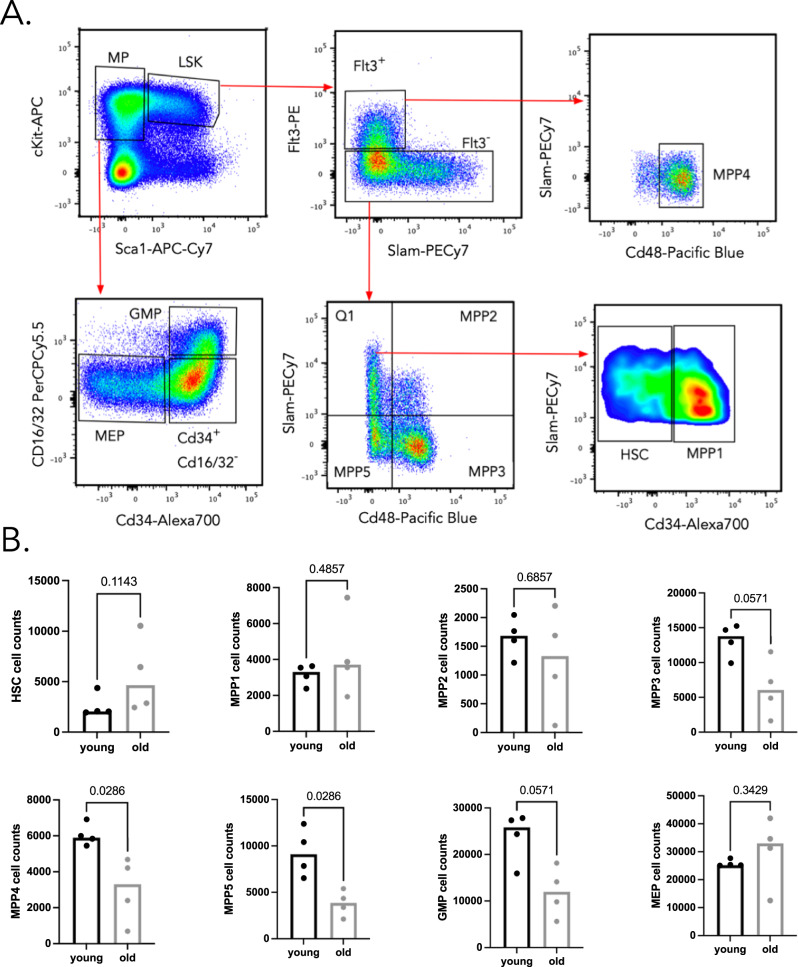
Ageing is associated with changes in the cellular composition of the immune system. During ageing, hematopoietic stem and progenitor cells (HSPCs) that produce immune cells are thought to decline in their regenerative capacity. However, HSPC function has been mostly assessed using transplantation assays, and it remains unclear how HSPCs age in the native bone marrow niche. To address this issue, we present an in situ single cell lineage tracing technology to quantify the clonal composition and cell production of single cells in their native niche. Our results demonstrate that a pool of HSPCs with unequal output maintains myelopoiesis through overlapping waves of cell production throughout adult life. During ageing, the increased frequency of myeloid cells is explained by greater numbers of HSPCs contributing to myelopoiesis rather than the increased myeloid output of individual HSPCs. Strikingly, the myeloid output of HSPCs remains constant over time despite accumulating significant transcriptomic changes throughout adulthood. Together, these results show that, unlike emergency myelopoiesis post-transplantation, aged HSPCs in their native microenvironment do not functionally decline in their regenerative capacity.


Conflict of interest statement

The authors declare no competing interests.

Figures

Fig. 1
Fig. 1. A quantitative DRAG in situ barcoding system.
A Description of the DRAG cassette, as inserted into the Rosa 26 locus before and after induction. DRAG recombination is induced by Cre activity, and resulting barcode sequences are used for lineage tracing. B Example of GFP expression in myeloid cells (CD11b+ CD19 CD3 CD11c) in blood 6.5 months after tamoxifen (induced) or vehicle (control) administration. Within the GFP positive gate, a GFPmid and GFPhigh population is observed in myeloid cells. Both populations contain successfully recombined barcodes, and heterogeneity in GFP marker expression is likely due to the labeling of heterogeneous cell types with the pan myeloid marker cd11b (Supplementary Fig. 5A, B). In line with this, such heterogeneous GFP expression was not observed in non-myeloid cells. C Percentage of GFP+ myeloid cells of total myeloid cells in tamoxifen-induced (green) and control (black) (n = 5 and n = 3 male DRAG mice, respectively, all sampled over 13 months). Median and interquartile range with whiskers extending to the minimum and maximum values. D False positive rate and sensitivity of barcode detection. Seven MEF clones with known DRAG barcodes were mixed in different numbers, and the input cell numbers of all MEF clones were compared to experimentally determined numbers upon PCR, sequencing, and analysis. The number in circles corresponds to MEF clone numbers; red and blue circles indicate technical replicates. The gray area indicates lower thresholds for barcode detection as used during data processing. E Bar graphs depicting the number of nucleotides inserted and deleted between the V, D, and J segments. All summary statistics in this graph are derived from an experiment using four adult male DRAG mice. Source data are provided as a Source Data file, while larger datasets and associated source code are available at: https://github.com/TeamPerie/UrbanusCosgrove-et-al-DRAG-mouse.
Fig. 2
Fig. 2. Identity of DRAG barcode-labeled HSPC cells.
A At the start of DRAG labeling, tamoxifen-induced Cre-ERTM activity will yield DRAG barcodes in stem cells, progenitor cells, and downstream differentiated cells. At later time points (month) after induction, turnover of short-lived committed progenitors and differentiated cells and replacement by the progeny of long-lived cells has occurred, and DRAG barcodes observed in short-lived differentiated cell pools are derived from long-term repopulating cells. B Six months post tamoxifen induction, HSPC cells (LSK: sca1+ckit+ cells) GFP+ and GFP were scRNA sequenced using the 10 × 3′ end protocol (data from two male DRAG mice induced at 20 weeks). UMAP representation of the data, with key subpopulations obtained by Louvain clustering highlighted. C Published gene expression signatures were used to annotate and quantify the clusters in (B). D Distribution of GFP+ cells throughout the UMAP embedding of the data. E The proportion of cells in each cluster from (B) within either GFP+ or GFP cells. The raw data showing the proportions of cells in each cluster are given in Supplementary Data 6. Source data are provided as a Source Data file, while larger datasets and associated source code are available at: https://github.com/TeamPerie/UrbanusCosgrove-et-al-DRAG-mouse.
Fig. 3
Fig. 3. Barcode analysis reveals nonoverlapping waves of myelopoiesis.
A Recombination of the DRAG locus was induced in 8–14 week old male mice. At sacrifice, 15 months post-induction, myeloid cells (M: CD11b+ CD19 CD3CD11c) were sorted from bone marrow, HSPC (LSK: sca1+ckit+) and myeloid progenitors (MP: myeloid progenitors, sca1ckit+) were sorted from the bone marrow (gating strategy in Supplementary Fig. 4A, B). All samples were processed for barcode detection. B Heatmap representation of the barcode output in bone marrow HPSC, MP, and myeloid cells, at month 15 post-induction. Ninety-seven barcodes with barcode generation probability Pgen <10−4 were observed (pooled data of three mice). Normalized and hyperbolic arcsine transformed data were clustered by complete linkage using Euclidean distance. C Barcodes with barcode generation probability Pgen <10−4 were classified based on their presence or absence in HSPC, MP, or myeloid cells (M). The percentage of barcodes in each of the six possible classes is depicted. The barplot represents the median value, while error bars show the standard deviation representing the interquartile range between mice (n = 3). Each point represents a different mouse. D Same as (C) but depicting the total contribution of all barcodes in a given class to the production of either HSPC, MP, or M. The raw data showing the proportions of cells in each cluster are given in Supplementary Data 6. E Number of myeloid cells produced per barcode for n = 4 male DRAG mice (251 barcodes), 15 months post-induction. Colors represent individual mice. The boxplot represents the median and interquartile range. The whiskers extend to 1.5 times the interquartile range values. Source data are provided as a Source Data file, while larger datasets and associated source code are available at: https://github.com/TeamPerie/UrbanusCosgrove-et-al-DRAG-mouse.
Fig. 4
Fig. 4. Increased numbers of long-term repopulating cells contribute to myelopoiesis with age.
A Gating strategy to quantify bone marrow myeloid populations. B Quantification of neutrophil, macrophage/monocyte, and eosinophil cell frequencies within the CD11b+bone marrow myeloid compartment of adult male DRAG mice. Each point represents one mouse, and statistical comparisons were made using a Mann–Whitney test. C Absolute number of GFP+ and GFP myeloid cells (CD11b+) in blood between month 4 and 12. n = 4 mice, the black line depicts the mean; the ribbon depicts the 95% confidence intervals for the true mean. D Models for age-related increased myeloid cell production. An increase in myeloid production may happen through two non-mutually exclusive mechanisms: an increase in the number of myeloid-biased HSPCs (model 1) or an increase in the number of myeloid cells that are produced per individual HSPC (model 2). E Diversity of barcodes in blood between months 4 and 12 using the Simpson index. Each sample was analyzed in duplicate. The black line represents the mean Simpson’s index estimate, obtained from the fitted gamma generalized linear mixed model with a breakpoint; the gray ribbon represents the 95% CI for the true mean. n = 4 adult male DRAG mice. F Number of myeloid cells produced per barcode (i.e., clone size) over time post-induction. Pooled data of four mice, with each color representing a different mouse, are depicted. The boxplot represents the median and interquartile range. The whiskers extend to 1.5 times the interquartile range values. Source data are provided as a Source Data file, while larger datasets and associated source code are available at: https://github.com/TeamPerie/UrbanusCosgrove-et-al-DRAG-mouse.
Fig. 5
Fig. 5. Age-related changes in cellular composition of the HSPC compartment.
A Experimental timeline for profiling HSPCs across adulthood. Male DRAG mice were given tamoxifen at 8–20 weeks of age to induce barcode recombination. At subsequent time points, HSPCs were purified from the bone marrow of induced mice and processed for scRNAseq or flow cytometry analysis. For each time point, we give the number of mice processed as well as the number of cells recovered for scRNAseq profiling. B UMAP embedding of the scRNAseq data. Unsupervised clustering was used to discretize the data into colored subgroups, and cluster annotation was performed by overlaying published gene signatures and markers,,. C Overlaying published gene signatures, onto the UMAP embedding of the data. For each cell, the gene signature score was calculated as the mean expression across all genes in the signature (after background correction). D Top five differentially expressed genes for each cluster. Differential gene expression analysis was performed using a logistic regression test as implemented in the Seurat R package, and Bonferroni correction was applied to account for multiple testing. E Density plot showing the proportional abundance of cells within the UMAP embedding as a function of age. F The proportional abundance of cells among clusters at 6–7 months, 12 months, and 18–19 months old. The raw data showing the proportions of cells in each cluster are given in Supplementary Data 6. G Pseudotime projection of the data with cells organized into clusters as in (C). Pseudotime inference was performed using a diffusion map-based approach as implemented in the R package destiny. H Label transfer for supervised annotation of cell state. scRNAseq atlas of hematopoiesis (left–reference dataset) comprises 44,802 c-Kit+ and c-Kit+ Sca1+ hematopoietic progenitors. Cell clustering and supervised assignment of cluster identity on this reference atlas were taken from ref. . scRNAseq data from our study (query dataset) was then mapped onto this dataset using Seurat’s FindTransferAnchors and TransferData methods. I Barplot showing the relative proportion of cell-state definitions obtained by label transfer mapping. The raw data showing the proportions of cells in each cluster are given in Supplementary Data 6. Source data are provided as a Source Data file, while larger datasets and associated source code are available at: https://github.com/TeamPerie/UrbanusCosgrove-et-al-DRAG-mouse.
Fig. 6
Fig. 6. Transcriptomic differences between young and aged HSPCs.
A Proportion of cells per cell cycle phase, per cluster, and age. Cells were classified into G1/G2 + M/S phases of the cell cycle using a classifier approach. B Differentially expressed genes between HSPCs from male DRAG mice aged 6.5, 12, and 19 months. Differential expression analysis was performed using a logistic regression test as implemented in the Seurat R package. Bonferroni correction was applied to correct for multiple testing C Pathways enriched in HSPCs at different ages. Pathway analysis was performed using the enrichR R package using a variation of Fisher’s exact test (two-sided), which also considers the size of each gene set when assessing the statistical significance of a gene set. D Expression of the aged HSPC gene signature across all cell clusters. The gene signature was obtained by differential expression analysis for all HSPCs between young (6.5 months) and aged (19 months) mice. Genes that are upregulated in aged HSPCs are aggregated into the aged HSPC signature. For each cell, the gene signature score was calculated as the background corrected mean expression across all genes in the signature using the AddModuleScore method in Seurat. Source data are provided as a Source Data file, while larger datasets and associated source code are available at: https://github.com/TeamPerie/UrbanusCosgrove-et-al-DRAG-mouse.
Fig. 7
Fig. 7. Flow cytometry profiling of hematopoietic progenitors and mature myeloid subsets in young and old mice.
A Gating strategy to identify the different HSPC and MP subsets. B Quantification of HSPCs, MP, and M subset counts between young (6.5 months) and old (19 months) male DRAG mice. Each point represents one mouse and n = 4 mice. The Y-axis represents the number of cells of each cell type. Statistical comparisons were made using a two-sided Mann–Whitney test. Source data are provided as a Source Data file, while larger datasets and associated source code are available at: https://github.com/TeamPerie/UrbanusCosgrove-et-al-DRAG-mouse.

Similar articles

Cited by

References

    1. Morrison SJ, Wandycz AM, Akashi K, Globerson A, Weissman IL. The aging of hematopoietic stem cells. Nat. Med. 1996;2:1011–1016. doi: 10.1038/nm0996-1011. - DOI - PubMed
    1. De Haan G, Van Zant G. Dynamic changes in mouse hematopoietic stem cell numbers during aging. Blood. 1999;93:3294–3301. doi: 10.1182/blood.V93.10.3294.410k07_3294_3301. - DOI - PubMed
    1. Sudo K, Ema H, Morita Y, Nakauchi H. Age-associated characteristics of murine hematopoietic stem cells. J. Exp. Med. 2000;192:1273–1280. doi: 10.1084/jem.192.9.1273. - DOI - PMC - PubMed
    1. Rossi DJ, et al. Cell intrinsic alterations underlie hematopoietic stem cell aging. Proc. Natl Acad. Sci. USA. 2005;102:9194–9199. doi: 10.1073/pnas.0503280102. - DOI - PMC - PubMed
    1. Chambers SM, et al. Aging hematopoietic stem cells decline in function and exhibit epigenetic dysregulation. PLoS Biol. 2007;5:e201. doi: 10.1371/journal.pbio.0050201. - DOI - PMC - PubMed

Publication types