. 2023 Apr 17;14(1):2198.
doi: 10.1038/s41467-023-37878-y.

The basolateral amygdala-anterior cingulate pathway contributes to depression-like behaviors and comorbidity with chronic pain behaviors in male mice

Affiliations

The basolateral amygdala-anterior cingulate pathway contributes to depression-like behaviors and comorbidity with chronic pain behaviors in male mice

Léa J Becker et al. Nat Commun. .

Abstract

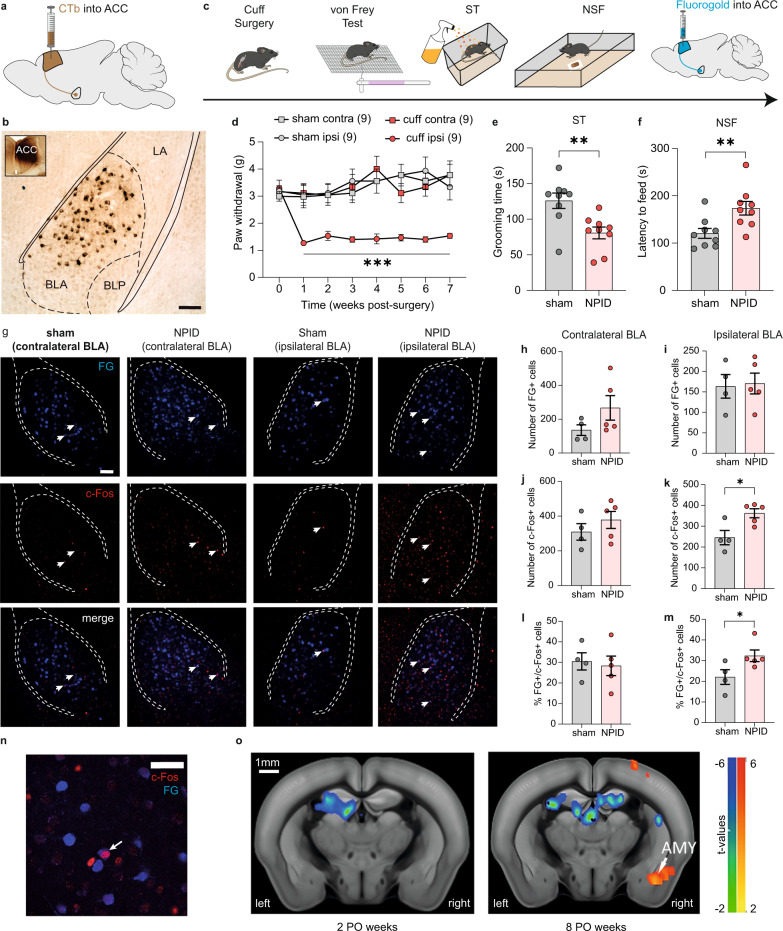
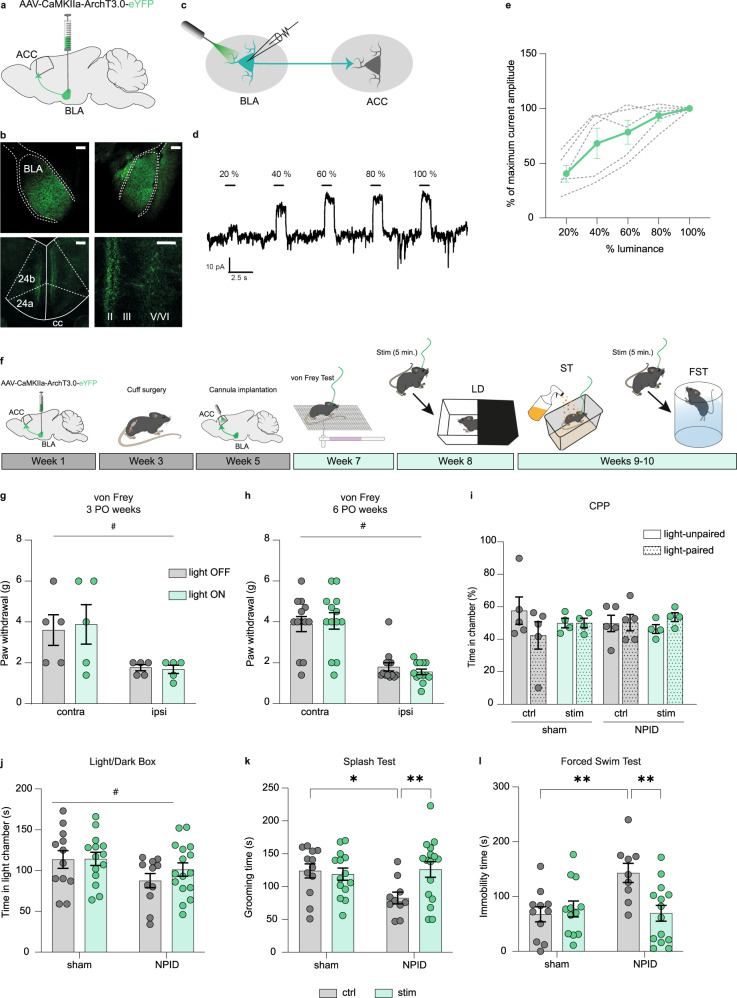
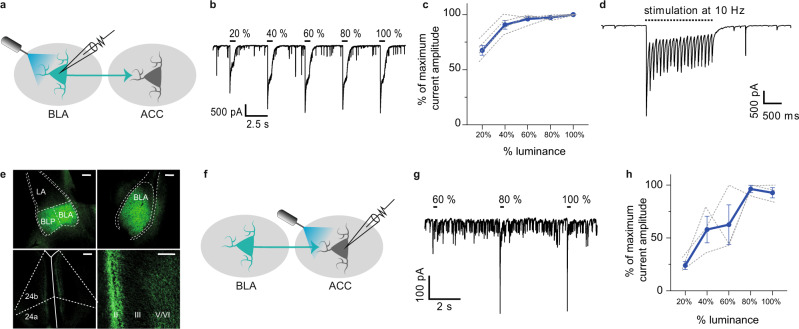
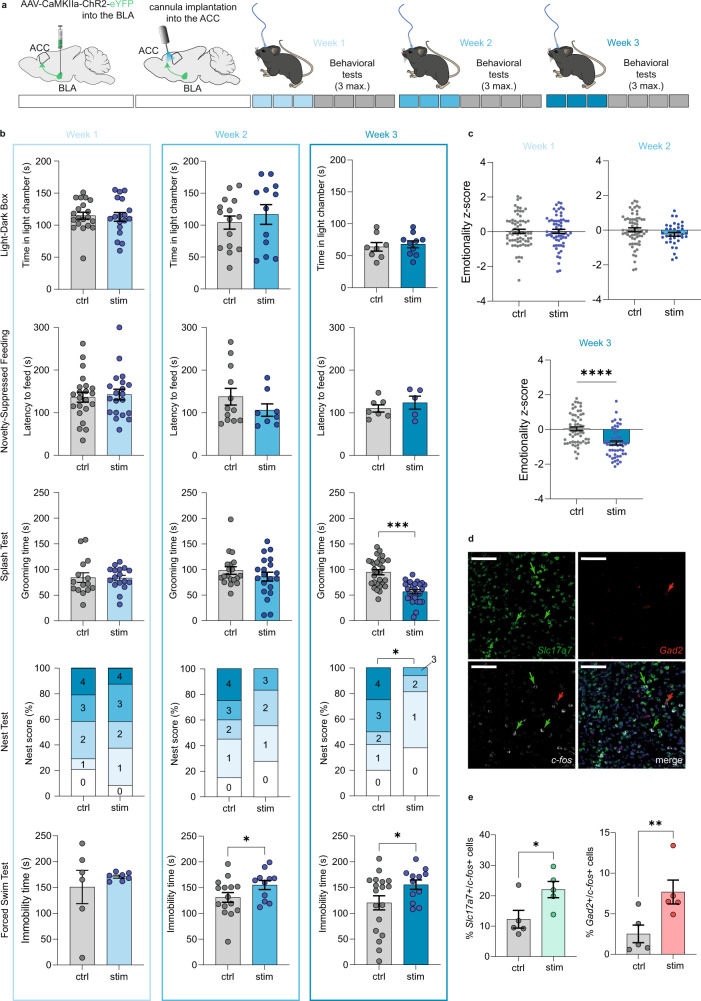
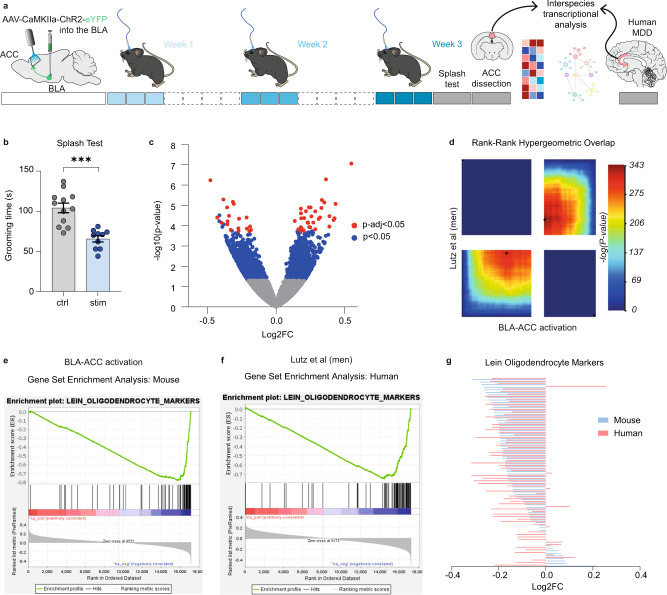
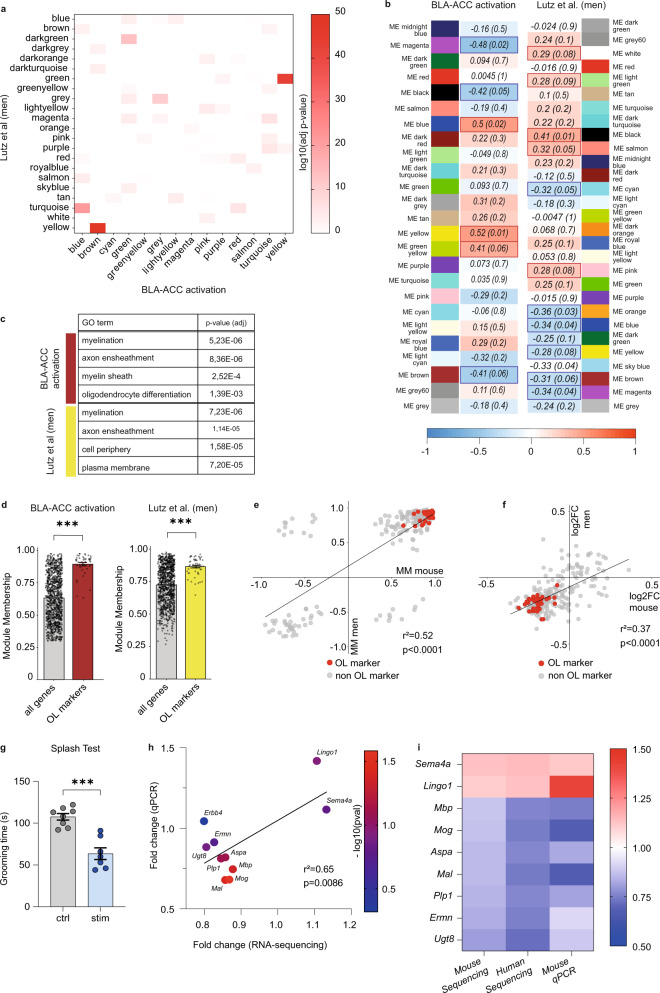
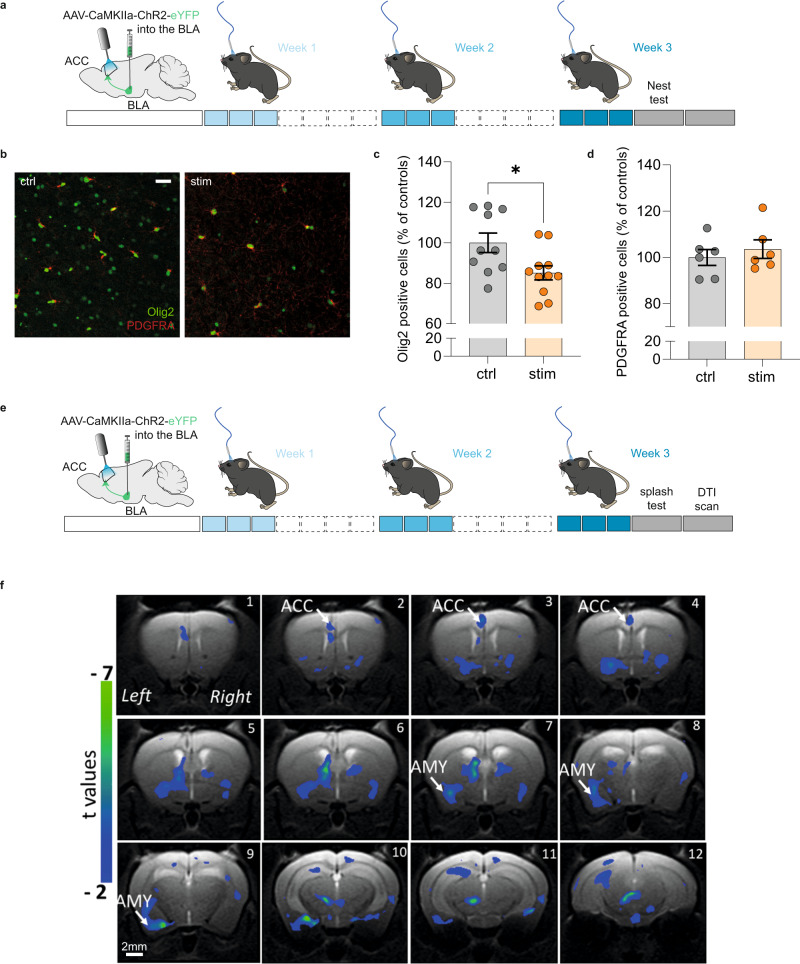
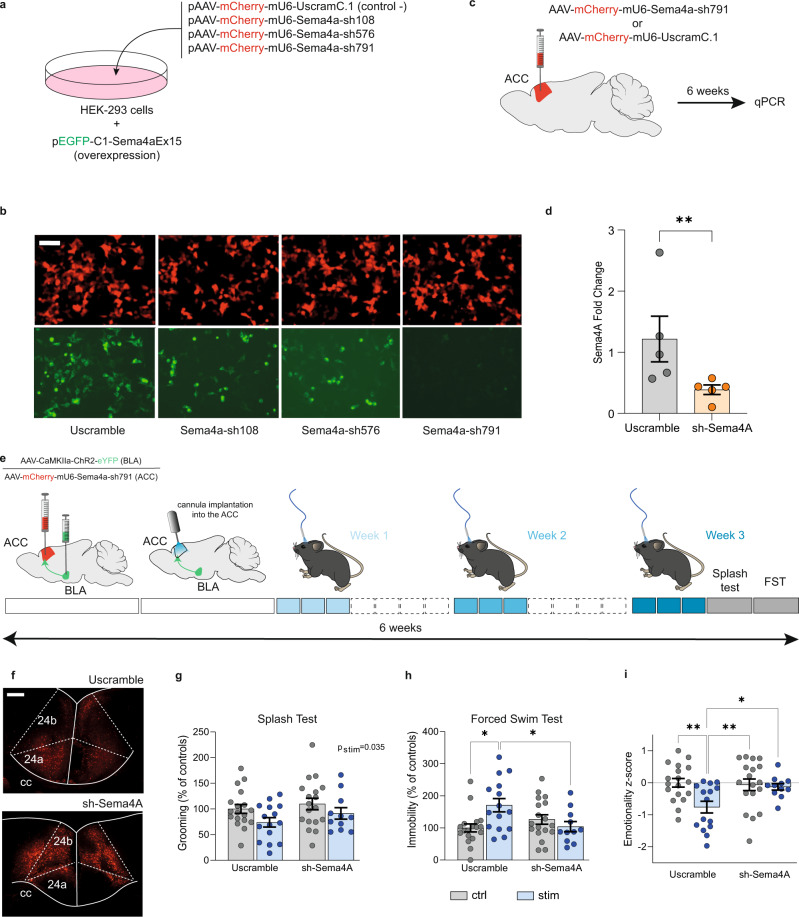
While depression and chronic pain are frequently comorbid, underlying neuronal circuits and their psychopathological relevance remain poorly defined. Here we show in mice that hyperactivity of the neuronal pathway linking the basolateral amygdala to the anterior cingulate cortex is essential for chronic pain-induced depression. Moreover, activation of this pathway in naive male mice, in the absence of on-going pain, is sufficient to trigger depressive-like behaviors, as well as transcriptomic alterations that recapitulate core molecular features of depression in the human brain. These alterations notably impact gene modules related to myelination and the oligodendrocyte lineage. Among these, we show that Sema4a, which was significantly upregulated in both male mice and humans in the context of altered mood, is necessary for the emergence of emotional dysfunction. Overall, these results place the amygdalo-cingulate pathway at the core of pain and depression comorbidity, and unravel the role of Sema4a and impaired myelination in mood control.


Conflict of interest statement

The authors declare no competing interests.

Figures

Fig. 1
Fig. 1. Neuropathic pain-induced depression (NPID) triggers hyperactivity in BLA neurons projecting to the ACC and increases functional connectivity between the ACC and BLA.
a Retrograde tracing strategy, with the injection of the cholera toxin B subunit (CTB) into the anterior cingulate cortex (ACC). b Representative image of retrogradely labeled cell bodies in the anterior part of the basolateral nucleus of the amygdala (BLA). Scale bar = 100 µm. c Experimental design for quantifying the activity of BLA neurons projecting to the ACC, during NPID. df Peripheral nerve injury induced an ipsilateral mechanical hypersensitivity (d; F(21,224) = 2.710; P < 0.0001; post hoc 1–7 weeks P < 0.05), decreased grooming in the splash test (ST) (e; sham: 125.90 ± 10.80; NPID: 80.67 ± 8.22; P = 0.0042) and increased latency to feed in novelty-suppressed feeding (NSF) (f; sham: 120.7 ± 10.49; NPID: 173.7 ± 14.38; P = 0.0089) (n = 9 mice/group). g Representative images showing positive cells for fluorogold (FG + , upper panel), c-Fos (c-Fos + , middle), or co-labeled (bottom), in the contralateral (sham: right column; NPID: middle right) or ipsilateral BLA (sham: middle left; NPID: left). Scale bar = 100 µm. hm Quantification of FG + , c-Fos+ cells and their co-localization revealed that, at 8 weeks postoperative (PO), the number of FG + cells was not altered (h; contralateral BLA: sham: 135.8 ± 31.52; NPID: 267.2 ± 72.58; P = 0.21; i; ipsilateral BLA: sham: 163.5 ± 28.85; NPID: 170.6 ± 25.43; P = 0.3651), as well as c-Fos + (j; sham: 309.3 ± 47.60; NPID: 378.2 ± 49.10; P = 0.14) and % of FG + /c-Fos + (l; sham 30.50 ± 4.20; NPID: 28.33 ± 4.72; P = 0.45) cells in the contralateral BLA. In contrast, the number of c-Fos + (k; sham: 245.5 ± 34.37; NPID: 362.4 ± 21.62; P = 0.0238) and % of FG + /c-Fos+ cells (m sham 22.06%±3.55; NPID: 32.32%±2.81; P = 0.0159) were increased in the ipsilateral BLA (sham: n = 4 mice; NPID: n = 5 mice). n Close-up image showing the co-localization of c-Fos+ and FG + cells. Scale bar = 20 µm. o Inter-group statistical comparisons showed increased functional connectivity between ACC and amygdala (AMY) at 8 (right image) but not 2 (left) PO weeks. FWER corrected at cluster level for P < 0.05. Data are mean ± SEM. *P < 0.05; **P < 0.01, ***P < 0.001. Two-way ANOVA repeated measures (Time × Surgery; VF); two-sided unpaired t test (ST and NSF); one-sided Mann–Whitney test (FG, c-Fos quantification). Contra contralateral, ipsi ipsilateral, BLP posterior part of the BLA, LA lateral amygdala. Sagittal mouse brain cartoons (a, c) were created with Biorender.com. Source data are provided as a Source Data file.
Fig. 2
Fig. 2. Optogenetic inhibition of the BLA–ACC pathway blocks NPID.
a Graphical representation of virus delivery to the mouse BLA for voltage-clamp recordings. b Representative images of eYFP+ cell bodies in the BLA (upper panels) and eYFP+ axon terminals in the ACC (lower panels). Scale bars = 100 µm. c Graphical representation of patch-clamp recording in the BLA. d Representative trace of outward currents. e Amplitude of currents induced by optogenetic stimulations of BLA neurons (n = 5 cells/2 mice, green trace = mean; gray traces = individual responses). f Graphical representation of the experimental design for in vivo optogenetic inhibition of the BLA–ACC pathway. g, h At 3 or 6 weeks PO, mechanical hypersensitivity was not affected by the inhibition of BLA–ACC pathway (ipsi vs contra; 3 PO weeks, cuff: n = 5 mice, F(1,4)=7.752; P = 0.0496; 6 PO weeks, cuff: n = 13 mice F(1,12)=55.80; P < 0.0001; light-off vs light-on; 3 PO weeks F(1,4)=0.669; P = 0.4592; 6 PO weeks F(1,12)=2.971; P = 0.1104). i Optogenetic inhibition of the BLA–ACC pathway did not induce a place preference at 6 weeks PO (sham-ctrl: n = 5 mice; sham-stim: n = 4 mice; NPID-ctrl: n = 5; NPID-stim: n = 4 mice; F(3,13)=0.153; P = 0.9998). j At 7 weeks PO, BLA–ACC inhibition had no effect on the decrease in time spent in the lit chamber observed in nerve-injured animals (sham-ctrl: n = 12 mice; sham-stim: n = 14 mice; NPID-ctrl: n = 11; NPID-stim: n = 16 mice; sham vs NPID: F(1,49) = 4.703; P = 0.035; ctrl vs stim: F(1,49)=0.634; P = 0.43). k At 8 weeks PO, BLA–ACC pathway inhibition reversed the decreased grooming observed in nerve-injured non-stimulated animals (F(1,48)=4.991; P = 0.03; post hoc: sham-ctrl (n = 12 mice) >NPID-ctrl (n = 10 mice); P < 0.05; NPID-ctrl (n = 10 mice) <NPID-stim (n = 16 mice); P < 0.05 sham-ctrl (n = 12 mice) = sham-stim (n = 14 mice)). l At 8 weeks PO, BLA–ACC inhibition blocked the increased immobility observed in nerve-injured non-stimulated animals (F(1,42) = 7.539; P = 0.008, post hoc: sham-ctrl (n = 11 mice) > NPID-ctrl (n = 9 mice), P < 0.05; NPID-ctrl (n = 9 mice) > NPID-stim (n = 14 mice), P < 0.01; sham-ctrl (n = 11 mice) = sham-stim (n = 12 mice)). Data are mean ± SEM. #, main effect; *P < 0.05; **P < 0.01. Two-way ANOVA repeated measures (von Frey); two-way ANOVA (Surgery × Stimulation; LD, ST and FST). ACC anterior cingulate cortex, PO postoperative, 24a/24b areas 24a/b of the ACC, II, III, V/VI ACC layers, cc corpus callosum. Sagittal mouse brain cartoons (a, f) were created with Biorender.com. Source data are provided as a Source Data file.
Fig. 3
Fig. 3. ChR2 expression in BLA neurons drives robust light-induced activation of BLA and ACC neurons.
a Graphical representation of ex vivo voltage-clamp recordings in the BLA. b Representative trace of the outward currents induced by optogenetic stimulation with increased luminance in a BLA neuron. c Amplitude of currents evoked by optogenetic stimulation of BLA neurons as a function of light stimulation intensity (n = 4 cells/3 mice, blue trace = mean; gray traces = individual responses). d Representative trace of response of BLA neurons to 10 Hz optogenetic activation showing that after an initial decrease in the amplitude of light-induced currents, a plateau is reached. e Representative images of eYFP+ cell bodies in the BLA (upper panels) and eYFP+ axon terminals in the ACC (lower panels). Scale bars = 100 µm. f Graphical representation of the configuration for ex vivo voltage-clamp recordings in the ACC. g Representative trace of the inward currents induced by optogenetic activation of BLA terminals within the ACC with increased luminance. h Amplitude of currents evoked by optogenetic stimulations of BLA terminals recorded in ACC pyramidal neurons as a function of light stimulation intensities (n = 3 cells/3 mice, blue trace = mean; gray traces = individual responses). Data are represented as mean ± SEM. 24a, 24b: areas 24a and 24b of the ACC, II, III, V/VI cortical layers of the ACC, BLA anterior part of the basolateral nucleus of the amygdala, BLP posterior part of the basolateral nucleus of the amygdala, cc corpus callosum, LA lateral amygdala. Source data are provided as a Source Data file.
Fig. 4
Fig. 4. Repeated activation of the BLA–ACC pathway triggers depressive-like behaviors in naive mice.
a, b Repeated optogenetic activation of the BLA–ACC pathway did not induce anxiety-like behaviors in the LD (3 stim: ctrl: n = 20 mice; 114.8 ± 5.34; stim: n = 18 mice; 112.9 ± 6.75; P = 082.; 6 stim: ctrl: n = 15 mice; 104.0 ± 10.31; stim: n = 12 mice; 116.7 ± 15.37; P = 0.49; 9 stim: ctrl: n = 8 mice; 64.0 ± 6.73; stim: n = 10 mice; 68.0 ± 5.34; P = 0.64) nor NSF (3 stim: ctrl: n = 22 mice; 136.5 ± 11.65; stim: n = 20 mice; 142.6 ± 12.44; P = 0.72; 6 stim: ctrl: n = 12 mice; 137.8 ± 19.52; stim: n = 8 mice; 106.4 ± 14.51; P = 0.26; 9 stim: ctrl: n = 7 mice; 110.3 ± 8.36; stim: n = 5 mice; 123.8 ± 15.24; P= 0.42) tests. Three stimulations did not change grooming in the splash test (ST, ctrl: n = 15 mice; 84.20 ± 9.37; stim: n = 17 mice; 83.41 ± 5.33; P = 0.94), nest building (ctrl: n = 24 mice; stim: n = 24 mice; Chi-square=0.012; P = 0.91) nor immobility in the FST (ctrl: n = 6 mice; 150.8 ± 32.29; stim: n = 7 mice; 171.0 ± 2.89; P = 0.26). Six stimulations did not alter grooming (ctrl: n = 19 mice; 98.16 ± 7.37; stim: n = 20 mice; 86.10 ± 8.7; P = 0.51) nor nesting (ctrl: n = 20 mice; stim: n = 18 mice; Chi-square=2.81; P = 0.094), but increased immobility in the FST (ctrl: n = 15 mice; 131.1 ± 9.47; stim: n = 11 mice; 155.1 ± 8.71; P = 0.042). The latter increase was still present after 9 stimulations (ctrl: n = 18 mice; 120.3 ± 13.69; stim: n = 12 mice; 155.5 ± 9.15; P = 0.033), along with decreased grooming (ctrl: n = 29 mice; 94.79 ± 5.02; stim: n = 26 mice; 56.81 ± 3.96; P < 0.0001) and nest quality (ctrl: n = 20 mice; stim: n = 16 mice; Chi-square=7.35; P = 0.0067). c Emotionality z-scores across tests and timepoints: three stimulations had no effect (ctrl: n = 67 mice; 0.033 ± 0.11; stim: n = 64 mice; 0.023 ± 0.11; P = 0.97), while a tendency for a decrease emerged after 6 stimulations (ctrl: n = 40 mice; −0.004 ± 0.082; stim: n = 35 mice; −0.232 ± 0.109; P = 0.095) and became significant after 9 (ctrl: n = 59 mice; 0.042 ± 0.11; stim: n = 52 mice; −0.78 ± 0.12; P < 0.0001). d Representative RNAscope images of Slc17a7 (upper-left panel), Gad2 (upper-right), c-fos (lower-left) mRNAs and their co-localization (lower-right) in the ACC. Scales = 100 µm. e Proportions of Slc17a7 + /c-fos + (green) and Gad2 + /c-fos + (red) cells increased in stimulated animals (ctrl: n = 5 mice; stimulated: n = 5 mice; Gad2 + /c-fos + : ctrl: 2.52 ± 1.09; stim: 7.68 ± 1.48, P = 0.008; Slc17a7 + /c-fos + : ctrl: 12.28 ± 2.89; stim: 22.04 ± 2.64, P = 0.028). Data are mean ± SEM. *P < 0.05; **P < 0.01; ***P < 0.001; ****P < 0.0001. Two-sided unpaired t test (LD, NSF, ST, z-score); chi-square test for trend (Nest); one-sided Mann–Whitney test (mRNA quantification). 24a/b: areas 24a/b of the ACC, II, III, V/VI ACC layers. Sagittal mouse brain cartoons (a) were created with Biorender.com. Source data are provided as a Source Data file.
Fig. 5
Fig. 5. Repeated activation of the BLA–ACC pathway induces transcriptional alterations similar to those observed in human-depressed patients.
a Graphical representation of experimental design, including virus delivery into the BLA, cannula implantation into the ACC, 9 sessions of optogenetic activation, ACC extraction in mice, and transcriptomic analysis in mice and humans. b Nine sessions of optogenetic activation of the BLA–ACC pathway decreased grooming behaviors in stimulated animals used for RNA Sequencing (ctrl: n = 12 mice; 104.2 ± 6.0; stim: n = 10 mice; 65.60 ± 3.80; P < 0.0001). c Volcano plot showing the 2611 (blue dot, 6.9% of all genes) genes differentially expressed (nominal P values<0.05; Wald test) between stimulated (n = 10) and control animals (n = 12). Red circles depict the 54 genes that showed a significant dysregulation after multiple testing correction (Padj<0.05, Benjamini and Hochberg correction). d Rank-Rank Hypergeometric Overlap (RRHO2) identified shared transcriptomic changes in the ACC across mice and men as a function of optogenetic stimulation (mouse) or a diagnosis of major depressive disorder (MDD). Levels of significance for the rank overlap between men and mice are color-coded, with a maximal one-sided Fisher’s Exact Test (FET) P < 1.0E-343 for upregulated genes (lower-left panel), and a maximal FET P < 1.0E-315 for downregulated genes (upper-right panel). eg Gene set enrichment analysis (GSEA) revealed an enrichment for genes specifically expressed by oligodendrocytes and showing evidence of downregulation as a function of optogenetic stimulation (e) or MDD diagnosis (f). The direction of the changes correlated across mice and humans (g; r² = 0.15, P = 0.0005). Behavioral data are mean ± SEM, ***P < 0.001, two-sided unpaired t test. Brain cartoons (a) were created with Biorender.com. Source data are provided as a Source Data file.
Fig. 6
Fig. 6. Gene-network analysis points toward alterations of myelination and oligodendrocyte in mice and men.
a Heatmap representing the level of significance of overlaps between mice and men gene modules (two-sided Fisher Exact Test). The highest overlap (P = 8.36E-49) was obtained for the man/yellow and mouse/brown modules. b WGCNA gene modules in the mouse and men ACC. The tables depict associations between each module’s eigengene and optogenetic stimulation in mice (left panel), or MDD diagnosis in men (right), and show both r correlation coefficients and P values (in brackets). c Gene Ontology analysis for man/yellow and mouse/brown modules, with most significant findings for myelin-related terms in both species (two-sided Fisher Exact Test). d The absolute value of the module membership (MM) of oligodendrocytes (OL) markers (OL genes) was significantly higher than the MM of all genes in each module, for both mouse/brown (n = 1088 genes total, n = 43 OL genes; left panel; P value < 2.2E-16) or man/yellow (n = 1049 genes total, n = 52 OL genes, right panel; P value < 2.2E-16) modules (two-sided paired t test). e Significant Pearson correlation between mouse/brown and man/yellow MM rankings (r² = 0.52, P = 0.0001). Red dots indicate myelin- and oligodendrocyte-related genes/genes also present in the Lein-Oligodendrocytes-Markers database. f Pearson linear regression of fold changes measured by RNA sequencing for men and mouse, showing a significant positive correlation in the direction of the change in expression of the genes in mouse/brown and man/yellow modules (r² = 0.37, P < 0.0001). Red dots indicate myelin and oligodendrocyte-related genes. g Repeated activation of the BLA–ACC decreased grooming time in stimulated animals in the splash test (ctrl n = 8 mice; 107.6 ± 3.65; stim n = 7 mice; 63.57 ± 6.96; P < 0.0001). h Linear regression of fold changes measured by RNA sequencing and qPCR, showing a significant positive correlation between the two methods (r² = 0.42, P = 0.0025). i Downregulation of the myelin-related genes (Mbp, P = 0.044; Mog, P = 0.026; Aspa, P = 0.078; Mal, P = 0.038; Plp1, P = 0.080; Ermn, P = 0.180; Ugt8, P = 0.133) and upregulation of inhibitors of the myelination process (Lingo1, P = 0.114; Sema4a, P = 0.154) were consistent across mice and men in RNA-Sequencing data, and validated in mice by qPCR, after nine stimulations. Data are mean ± SEM, ***P < 0.0001, two-tailed (Splash Test) and one-tailed (qPCR) unpaired t test. Source data are provided as a Source Data file.
Fig. 7
Fig. 7. Repeated activation of the BLA–ACC pathway impairs myelination.
a Graphical representation of the experimental design, including virus delivery into the BLA, cannula implantation into the ACC and the nine sessions of optogenetic activation. b Representative fluorescence images showing cells that are Olig2 + (green) or PDGFRA + (red) in non-stimulated (left panel) and stimulated mice (right panel). Scale bar = 50 µm. c, d Quantification of Olig2 and PDGFRA-positive cells showed that nine optogenetic stimulations of the BLA–ACC pathway decreased the number of Olig2+ cells without affecting the number of PDGFRA + cells (e: ctrl: n = 6 mice; 99.97 ± 3.45; stim: n = 6 mice; 103.6 ± 4.00; P = 0.41) in the ACC (d: ctrl: n = 10 mice; 100.00 ± 4.83; stim: n = 11 mice; 85.11 ± 3.48; P = 0.01). e Graphical representation of the experimental design for the DTI experiment, including virus delivery into the BLA, cannula implantation into the ACC and the nine sessions of optogenetic activation. f Representative coronal MRI images showing in blue the areas with a significant decrease of FA along the left BLA–ACC pathway in stimulated animals compared to the control group (ctrl: n = 7; stim: n = 6; GLM P < 0.001 uncorrected). Data are mean ± SEM. *P < 0.05; **P < 0.01. one-sided Mann–Whitney test (Olig2 and PDGFRA quantification). Sagittal mouse brain cartoons (a, e) were created with Biorender.com. Source data are provided as a Source Data file.
Fig. 8
Fig. 8. Semaphorin-4A is essential for the depressive-like behaviors induced by the activation of the BLA–ACC pathway.
a Graphical representation of the experimental design for shRNA validation in vitro. HEK-293 cells were transfected with plasmids expressing the mouse Sema4a exon 15 (green), and 1 out of 3 shRNAs tested for knockdown efficiency (red; with 1 scrambled shRNA as control). b Representative fluorescence images showing that the pAAV-mCherry-mU6-Sema4A-sh791 plasmid was the most efficient. Scale bar =50 µm. c Graphical representation of the bilateral virus injection in the ACC for in vivo validation of the selected sh791, inserted into an AAV vector. d qPCR analysis showing a downregulation of Sema4a expression level in the ACC of mice injected with Sema4A-sh791 (Uscramble: n = 5 mice; 1.22 ± 0.37; sh-Sema4A: n = 5 mice; 0.39 ± 0.07; P = 0.0079). e Graphical representation of the experimental design, including bilateral virus delivery in the BLA (AAV5-CaMKIIa-ChR2(H134R)-EYFP) and the ACC (rAAV-mCherry-scrambleUsh or rAAV-mCherry-Sema4A-sh791), cannula implantation, optogenetic stimulation and behavioral testing. f Representative images of mCherry+ cells in the ACC after the injection of UScramble (upper panel) or sh-Sema4A (lower panel). Scale bars =100 µm. gi Effect of Sema4a knockdown on optogenetically induced emotional deficits (UScramble-Ctrl: n = 18 mice; UScramble-Stim: n = 15 mice; sh-Sema4A-Ctrl: n = 18 mice; sh-Sema4A-Stim: n = 11 mice). Grooming time in the ST was decreased by repeated activation of the BLA–ACC pathway (g: F(1,58) = 4.623; P = 0.036) but was not affected by knocking down Sema4a in the ACC (g: F(1,58)=1.694; P = 0.20). Knocking down Sema4a in the ACC counteracted the increased immobility time observed in stimulated animals in the FST (h: F(1,58)=8.032; P = 0.006; post hoc: Uscramble-Ctrl<Uscramble-Stim; P < 0.05; sh-Sema4A-Stim<Uscramble-Stim; P = 0.05). Knocking down Sema4a in the ACC normalized the emotionality z-score (i: F(1,58)=4.39; P = 0.041; post hoc: Uscramble-Ctrl>Uscramble-Stim; p < 0.01; UScramble-Stim<sh-Sema4A-Ctrl; P < 0.01 UScramble-Stim<sh-Sema4A-Stim; P < 0.05; sh-Sema4A-Ctrl=sh-Sema4A-Stim; p > 0.05). Data are mean ± SEM. *P < 0.05; **P < 0.01; one-tailed Mann–Whitney test (Sema4A quantification), two-way ANOVA (Stimulation ×  KnockDown; ST, FST and z-score). Sagittal mouse brain cartoons (c, e) were created with Biorender.com. Source data are provided as a Source Data file.

Similar articles

Cited by

References

    1. Bair MJ, Robinson RL, Katon W, Kroenke K. Depression and pain comorbidity: a literature review. Arch. Intern. Med. 2003;163:2433–2445. doi: 10.1001/archinte.163.20.2433. - DOI - PubMed
    1. Rayner L, et al. Depression in patients with chronic pain attending a specialised pain treatment centre: prevalence and impact on health care costs. Pain. 2016;157:1472–1479. doi: 10.1097/j.pain.0000000000000542. - DOI - PMC - PubMed
    1. Arnow BA, et al. Comorbid depression, chronic pain, and disability in primary care. Psychosom. Med. 2006;68:262–268. doi: 10.1097/01.psy.0000204851.15499.fc. - DOI - PubMed
    1. Gallagher RM, Verma S. Managing pain and comorbid depression: a public health challenge. Semin. Clin. Neuropsychiatry. 1999;4:203–220. - PubMed
    1. Thompson JM, Neugebauer V. Cortico-limbic pain mechanisms. Neurosci. Lett. 2019;702:15–23. doi: 10.1016/j.neulet.2018.11.037. - DOI - PMC - PubMed

Publication types