. 2023 Apr 17;14(1):2194.
doi: 10.1038/s41467-023-37924-9.

Ether phospholipids are required for mitochondrial reactive oxygen species homeostasis

Affiliations

Ether phospholipids are required for mitochondrial reactive oxygen species homeostasis

Ziheng Chen et al. Nat Commun. .

Abstract

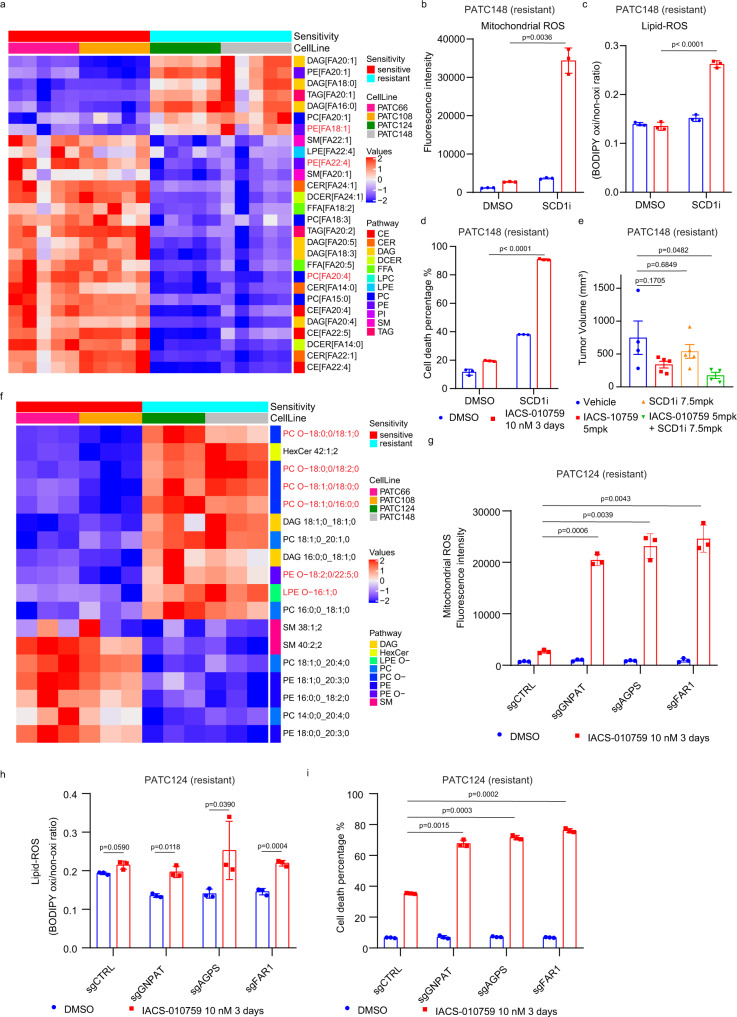
Mitochondria are hubs where bioenergetics, redox homeostasis, and anabolic metabolism pathways integrate through a tightly coordinated flux of metabolites. The contributions of mitochondrial metabolism to tumor growth and therapy resistance are evident, but drugs targeting mitochondrial metabolism have repeatedly failed in the clinic. Our study in pancreatic ductal adenocarcinoma (PDAC) finds that cellular and mitochondrial lipid composition influence cancer cell sensitivity to pharmacological inhibition of electron transport chain complex I. Profiling of patient-derived PDAC models revealed that monounsaturated fatty acids (MUFAs) and MUFA-linked ether phospholipids play a critical role in maintaining ROS homeostasis. We show that ether phospholipids support mitochondrial supercomplex assembly and ROS production; accordingly, blocking de novo ether phospholipid biosynthesis sensitized PDAC cells to complex I inhibition by inducing mitochondrial ROS and lipid peroxidation. These data identify ether phospholipids as a regulator of mitochondrial redox control that contributes to the sensitivity of PDAC cells to complex I inhibition.


Conflict of interest statement

C.A.L. has received consulting fees from Astellas Pharmaceuticals and Odyssey Therapeutics, and is an inventor on patents pertaining to Kras regulated metabolic pathways, redox control pathways in cancer, and targeting the GOT1-pathway as a therapeutic approach. The remaining authors declare no competing interests.

Figures

Fig. 1
Fig. 1. Identification of latent vulnerability to complex I inhibition in a subset of pancreatic ductal adenocarcinoma patient-derived xenografts.
ac Cell viability assay separates sensitive (PATC53/66/108) and resistant groups (PATC118/124/148) upon 3 days of treatment with 10 nM IACS-010759 (a), 5 mM metformin (b), and 25 μM phenformin (c), respectively. Three biologically independent replicates per cell line. Three cell lines are classified into sensitive group and other 3 lines as resistant group. Data represent mean ± S.D between groups. dg Oxygen consumption ratio (OCR) in PATC66 (d), PATC108 (e) and in PATC124 (f), PATC148 (g) lines, upon 24 h of treatment with IACS-010759 at the indicated concentrations. N = 3 biologically replicates per measuement point. Data represent mean ± S.D. hk Xenograft tumor growth of PDX PATC66 (h), PATC108 (i), PATC124 (j), and PATC148 (k) with vehicle or 5 mg/kg IACS-010759. Mice were treated with a fasting/feeding cycle protocol as described in materials and methods. Tumor volume was measured every 4 days for a period of indicated days. N = 5–9 mice per group. l Representative IHC for cleaved caspase 3 activity in PATC subcutaneous tumors treated with vehicle or 5 mg/kg IACS-010759 on the 23rd (PATC66) and 26th (PATC148) days. The experiment had been repeated individually 3 times with similar results. Scale bar, 50 μm. Statistical analysis by two-tailed Students’ unpaired t test with significance indicated (ac, hk). Source data are provided as a Source Data file.
Fig. 2
Fig. 2. Induction of mitochondrial oxidative stress enhances sensitivity to complex I inhibition.
a Mitochondrial ROS were measured by MitoSOX staining and flow cytometry in the indicated cells grown for 60 hr in DMSO or 10 nM IACS-010759. The experiment was repeated independently three times and representative results were shown. b Quantification of mitochondrial ROS (MFI comparison) in sensitive (PATC66/108) and resistant (PATC124/148) groups after 60 hr treatment with 10 nM IACS-010759. Three biologically independent replicates per cell line. Data represent mean ± S.D between the sensitive group (2 cell lines) and resistant group (2 cell lines). cf Cells were transfected with the hydrogen peroxide indicator pCS2+MLS-Hyper7 (mitochondrial matrix-targeted) (c) and pCS2 + HyPer7-NES (cytoplasm-targeted) (e), and treated with 10 nM IACS-010759 at the indicated times. Mitochondria were defined by staining with an antibody against the mitochondrial outer membrane protein TOMM20. Nuclei were stained with Hoechst 33578. Scale bar, 10μm. d Quantification of fluorescence intensity in (c). f Quantification of fluorescence intensity in (e). For (d) and (f), at least 50 cells with positive green fluorescence from three biologically independent replicates were calculated for each group. g Cell death was detected by propidium iodide staining and flow cytometry in PATC124 cells treated with DMSO or 10 nM IACS-010759 for 2 days, in the presence or absence of the mitochondrial-ROS inducer MitoPQ (10 μM). Data represent mean ± S.D of three biologically independent replicates. h Cell death in PATC66 cells treated with DMSO or 10 nM IACS-010759 for 3 days, in the presence or absence of the 1 μM mitochondrial ROS scavenger, MitoQ. Data represent mean ± S.D of three biologically independent replicates. i, j Mitochondrial ROS (i) and cell viability (j) were detected by flow cytometry in PATC124 cells infected with control sgRNA (sgCTRL) or sgRNA targeting SOD2 (sgSOD2) following treatment with10 nM IACS-010759 for 3 days. Data represent mean ± S.D of three biologically independent replicates. Statistical analysis by two-tailed Students’ unpaired t test with significance indicated (b, d, f, gj). Source data are provided as a Source Data file.
Fig. 3
Fig. 3. MUFAs-linked ether phospholipids modulate sensitivity to complex I inhibition.
a Heatmap of the lipid metabolites detected at significantly different levels in the treatment-sensitive cells (PATC66/108) compared to resistant ones (PATC124/148). Metabolites with P < 0.05 between the two groups were listed. N = 5 for each cell line. bd Mitochondrial-ROS (b), lipid-ROS (c) and cell death (d) as measured with MitoSOX, BODIPY 581/591 C11, and propidium iodide, respectively in PATC148 cells upon 3 days of treatment with DMSO or 10 nM IACS-010759, in the presence or absence of the SCD1 inhibitor A939572 (10 μM). Data represent mean ± S.D of three biologically independent replicates. e PATC148 xenograft tumor growth in mice treated with vehicle or 5 mg/kg IACS-010759, once every other day, alone or in combination with the SCD1 inhibitor A939572 (7.8 mg/kg, once every other day). Mice were treated with fasting/feeding cycle protocol. Tumor measurements were made on the 33rd day of experiment, 9 hr after the last treatment. N = 4 for vehicle and combination groups; N = 5 for IACS-010759 and A939572 groups. Data represent mean ± SEM. Statistical analysis by ordinary one-way ANOVA followed by Tukey’s multiple comparisons test. f Heatmap of lipid species detected in purified mitochondria from sensitive group (PATC66/108) and resistant group (PATC124/148). Metabolites with P < 0.05 (by two-tailed Students’ unpaired t test) between the two groups were listed. N = 3 for each cell line. gi Mitochondrial-ROS (g), lipid-ROS (h), and cell death (i) as measured with MitoSOX, BODIPY 581/591 C11, and propidium iodide, respectively in PATC124 cells infected with control sgRNA (sgCTRL) or sgRNA targeting GNPAT, AGPS, and FAR1, and treated for 3 days with DMSO or 10 nM IACS-010759. Data represent mean ± S.D of three biologically independent replicates. Statistical analysis by two-tailed Students’ unpaired t test with significance indicated (bd, gi). Source data are provided as a Source Data file.
Fig. 4
Fig. 4. Exogenous MUFA-linked ether phospholipids promote resistance to mitochondrial complex I inhibition.
ac Mitochondrial ROS (a), lipid peroxidation (b), and cell death (c) as measured with MitoSOX, BODIPY 581/591 C11, and propidium iodide, respectively in PATC124 cells infected with control sgRNA (sgCTRL) or sgRNA targeting GNPAT (sgGNPAT) in the presence or absence of 100 μM O-C16-18:1 PC. Data represent mean ± S.D of 3 biologically independent replicates. de Mitochondrial ROS level (d) and cell death (e) in sgCTRL- and sgGNPAT-PATC124 cells, in the presence of 100 μM oleic acid or 100 μM O-C16-18:1 PC. Data represent mean ± S.D of three biologically independent replicates. f, g Growth curves of sub-cutaneous xenograft tumors derived from PATC148 cells infected with control sgRNA (sgCTRL) or sgRNA targeting GNPAT (sgGNPAT) and treated with vehicle or 5 mg/kg IACS-010759. Tumor volume was measured every 3–5 days for 24 days. N = 5–8 per group. h, i Mitochondrial ROS were detected with MitoSOX upon treatment with DMSO or 10 nM IACS-010759 in PATC 53 (h) and PATC108 (i) cells grown in the presence or absence of 100 μM ether-MUFA (O-C16-18:1 PC). Data represent mean ± S.D of three biologically independent replicates. j, k Cell viability was detected by propidium iodide staining after treatment with DMSO or 10 nM IACS-010759 in PATC53 (j) and PATC108 (k) cells grown in the presence or absence of 100 μM O-C16-18:1 PC. Data represent mean ± S.D of 3 biologically independent replicates. Statistical analysis by two-tailed Students’ unpaired t test with significance indicated (bd, gi). Source data are provided as a Source Data file.
Fig. 5
Fig. 5. MUFA-linked ether phospholipids promote the assembly of mitochondrial super-complexes.
a, b BN-PAGE showed mitochondrial supercomplexes (SC) in sensitive (PATC66/108) and resistant (PATC124/148) cells (a). Quantifications of the high molecular weight supercomplex (hwmSC) are shown in (b). Data represent mean ± S.D of three biologically independent replicates. c, d Mitochondrial supercomplexes as shown with BN-PAGE (c) and quantifications of hwmSCs (d) in sensitive (PATC66/108) cells grown in the presence or absence of 100 μM ether-MUFA (O-C16-18:1 phosphatidylcholine (PC)) for 24 hr. Data represent mean ± S.D of 4 biologically independent replicates. e, f Mitochondrial supercomplexes as shown with BN-PAGE (e) and quantifications of hwmSCs (f) in sensitive (PATC66/108) cells grown in the presence or absence of 100 μM ether-PUFA (O-C16-20:3 PC) for 24 hr. Data represent mean ± S.D of three biologically independent replicates. g, h Mitochondrial supercomplexes as shown with BN-PAGE (g) and quantifications of hwmSCs (h) in PATC124 cells infected with control sgRNA (sgCTRL) or sgRNA targeting GNPAT(sgGNPAT) in the presence or absence of 100 μM O-C16-18:1 PC or 100 μM ether-PUFA (O-C16-20:3 PC) for 24 hr. Complex V subunit protein APT5A was detected by SDS-PAGE western blotting as control protein. Data represent mean ± S.D of 5 biologically independent replicates. i Schematic representation of the major conclusions. Peroxisome-derived ether phospholipids, especially those linked with MUFAs, enhance mitochondrial ETC supercomplexes assembly to maintain redox balance and promote resistance to mitochondrial complex I inhibition. Impairment of MUFAs-linked ether phospholipids synthesis by targeting SCD1, GNPAT, or APGS synergizes with mitochondrial complex I inhibition to induce mitochondrial ROS and cell death. Statistical analysis by two-tailed Students’ unpaired t test with significance indicated (b, d, f, h). Source data are provided as a Source Data file.

References

    1. Pavlova NN, Thompson CB. The emerging hallmarks of cancer metabolism. Cell Metab. 2016;23:27–47. doi: 10.1016/j.cmet.2015.12.006. - DOI - PMC - PubMed
    1. Hanahan D, Weinberg RA. Hallmarks of cancer: the next generation. Cell. 2011;144:646–674. doi: 10.1016/j.cell.2011.02.013. - DOI - PubMed
    1. Guerra F, Arbini AA, Moro L. Mitochondria and cancer chemoresistance. Biochim Biophys. Acta Bioenerg. 2017;1858:686–699. doi: 10.1016/j.bbabio.2017.01.012. - DOI - PubMed
    1. Ashton TM, McKenna WG, Kunz-Schughart LA, Higgins GS. Oxidative phosphorylation as an emerging target in cancer therapy. Clin. Cancer Res. 2018;24:2482–2490. doi: 10.1158/1078-0432.CCR-17-3070. - DOI - PubMed
    1. Viale A, et al. Oncogene ablation-resistant pancreatic cancer cells depend on mitochondrial function. Nature. 2014;514:628–632. doi: 10.1038/nature13611. - DOI - PMC - PubMed

Publication types

MeSH terms