. 2023 Apr 17;14(1):2200.
doi: 10.1038/s41467-023-37912-z.

The melanocortin action is biased toward protection from weight loss in mice

Affiliations

The melanocortin action is biased toward protection from weight loss in mice

Hongli Li et al. Nat Commun. .

Abstract

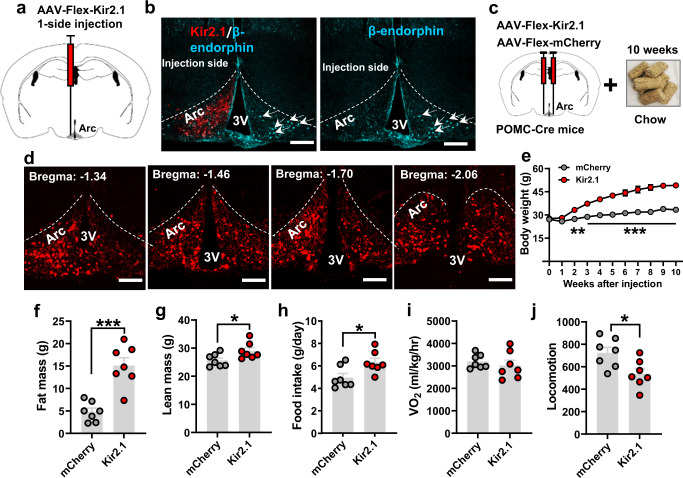
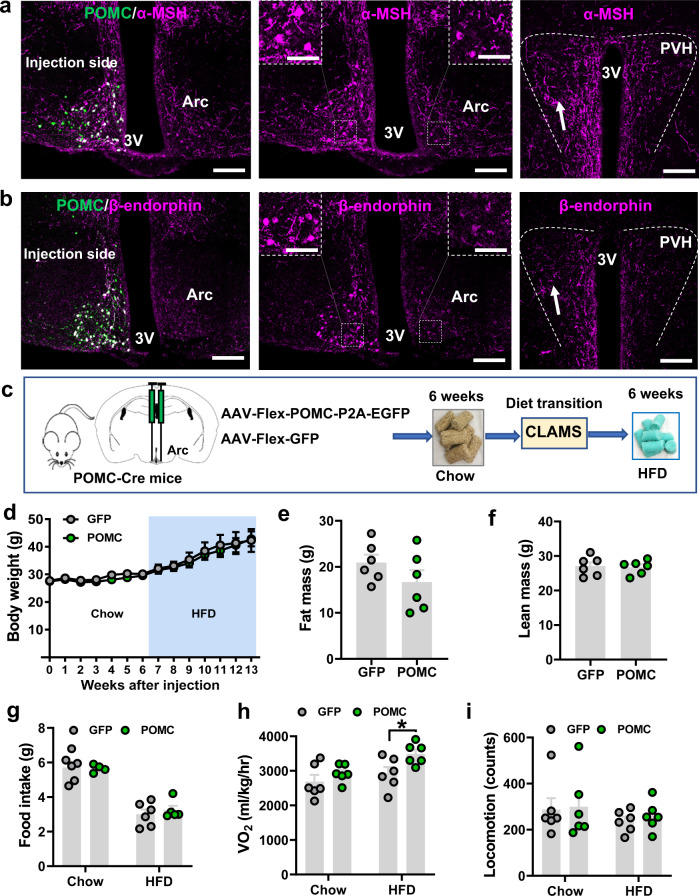
The melanocortin action is well perceived for its ability to regulate body weight bidirectionally with its gain of function reducing body weight and loss of function promoting obesity. However, this notion cannot explain the difficulty in identifying effective therapeutics toward treating general obesity via activation of the melanocortin action. Here, we provide evidence that altered melanocortin action is only able to cause one-directional obesity development. We demonstrate that chronic inhibition of arcuate neurons expressing proopiomelanocortin (POMC) or paraventricular hypothalamic neurons expressing melanocortin receptor 4 (MC4R) causes massive obesity. However, chronic activation of these neuronal populations failed to reduce body weight. Furthermore, gain of function of the melanocortin action through overexpression of MC4R, POMC or its derived peptides had little effect on obesity prevention or reversal. These results reveal a bias of the melanocortin action towards protection of weight loss and provide a neural basis behind the well-known, but mechanistically ill-defined, predisposition to obesity development.


Conflict of interest statement

The authors declare no competing interests.

Figures

Fig. 1
Fig. 1. Chronic inhibition of Arc POMC neurons caused obesity.
a Diagram depicting one side injection of AAV-Felx-Kir2.1-mCherry virus to Arc POMC neurons. b Expression pattern of viral vector expression (mCherry) and β-endorphin (cyan) or β-endorphin alone to demonstrate a higher level of β-endorphin at the non-injected side (arrows). c Diagram depicting bilateral injection of AAV-Flex-Kir2.1-mCheery virus to the Arc of POMC-Cre mice feeding on a chow diet for 10 weeks after viral delivery. d Representative expression patterns of the injected virus in the Arc in a rostral to caudal dimension. 3 V: third ventricle, Arc: arcuate nucleus. Scale bars: 50 µm. e Weekly body weight of male POMC-Cre mice with bilateral delivery of Kir2.1 or control virus to the Arc (n = 8 mice/each, two-way ANOVA, Control vs. Kir2.1, **p = 0.009 at 2 weeks post viral injection, ***p < 0.001 at 3–10 weeks post viral injection). fh Comparison in fat mass (f, n = 7 mice/each, two-tailed unpaired t-tests, ***p = 0.0002), lean mass (g, n = 7 mice/each, two-tailed unpaired t-tests, *p = 0.0334) and feeding (h, n = 7 mice/each, two-tailed unpaired t-tests, *p = 0.0218) in the mice shown in e at 10 weeks after viral delivery. i, j Comparison between the groups of mice in O2 consumption (i, n = 7 mice/each, two-tailed unpaired t-tests, p = 0.5062) and locomotion (j, n = 7 mice/each, two-tailed unpaired t-tests, *p = 0.0179) measured between 2–3 weeks after viral injection when the body weight difference between the groups was minimal. All data were presented as mean ± SEM. Source data are provided in the Source Data file.
Fig. 2
Fig. 2. Chronic activation of Arc POMC neurons failed to reduce body weight or obesity reversal.
a Diagram depicting one side injection of AAV-Flex-NachBac-GFP virus to Arc POMC neurons. b Expression pattern of viral vector (GFP) and c-Fos (left panel) or c-Fos alone (right panel) showing c-Fos induction by NachBac expression. c Statistical comparison of c-Fos induction between the NachBac-injected side and the non-injection side of POMC-Cre male mice (n = 5/each, two-tailed paired t-tests, ***p = 0.0003). d, e Expression patterns showing that levels of both β-endorphin (d) and α-MSH (e) were increased in the NachBac-injected Arc side of POMC-Cre male mice (arrows). Arc: arcuate nucleus, 3 V: third ventricle. Scale bar: 50 µm. f, g Statistical comparisons for β-endorphin (f, n = 5/each, two-tailed paired t-tests, **p = 0.0011) and α-MSH (g, n = 5/each, two-tailed paired t-tests, ***p = 0.0001) expressions. h, i. Diagram depicting bilateral injection of NachBac or control GFP virus to the Arc of male POMC-Cre mice (h) and weekly body weight of these mice on chow feeding for 8 weeks (i). j Diagram depicting POMC-Cre mice were firstly fed HFD to induce obesity and then received NachBac injection to the bilateral Arc for body weight measurements. k Weekly body weight after viral delivery. l, m Comparison in fat mass (l, n = 8/each, two-tailed unpaired t-tests, p = 0.0807) and lean mass (m, n = 8/each, two-tailed unpaired t-tests, *p = 0.0312) between the two groups. n, o Comparisons between the two groups in feeding (n, n = 7/GFP and n = 8/NachBac, two-tailed unpaired t-tests, p = 0.2791) and locomotion (o, n = 8/each, two-tailed unpaired t-tests, p = 0.0856) measured between 2–3 weeks after viral injection when the body weight difference between the groups was minimal. All data were presented as mean ± SEM. Source data are provided in the Source Data file.
Fig. 3
Fig. 3. Overexpression of α-MSH in Arc POMC neurons failed to reduce body weight or obesity reversal.
ad Expression and quantitative comparisons of α-MSH (b, **p = 0.001) and β-endorphin (c, d, p = 0.9092) between injection and non-injection sides (n = 3 mice/each), the boxed area showing the magnified expression pattern. 3 V: third ventricle, Arc arcuate nucleus. Scale bars: 50 µm for b and c, and 20 µm for boxed areas. e Food intake of POMC-Cre mice with either α-MSH overexpression or control viral injection after overnight fasting (n = 4/each, *p = 0.0382 for 2 h, p > 0.05 for other times). f Diagram depicting the experimental procedures and timelines. gl Weekly body weight (g, p > 0.05 for all time points) and comparisons of fat mass (h, p = 0.1867), lean mass (i, p = 0.1541), food intake (j, p = 0.7172, 0.3596, respectively), O2 consumption (k, p = 0.6669, 0.1859, respectively) and locomotion (l, p = 0.736, 0.8697, respectively) between the two groups (n = 6/each). m Diagram depicting the experimental procedure for examining the obesity reversal with α-MSH overexpression in POMC neurons. ns Weekly body weight (n, p > 0.05 for all time points) and comparisons of fat mass (o, p = 0.4855), lean mass (p, p = 0.3275), food intake (q, p = 0.7409), O2 consumption (r, p = 0.6872), and locomotion (s, p = 0.8297) between the two groups (n = 4/GFP and n = 6/α-MSH). t Diagram depicting the experimental procedures to examine obesity reversal in ob/ob mice by overexpressing α-MSH in POMC neurons. uw Weekly body weight (u, p > 0.05 for all time points) and comparisons of fat (v, p = 0.8006) and lean mass (w, p = 0.3839) between the two groups (n = 4/each). All data were presented as mean ± SEM. Two-tailed paired t-tests for b and d; two-way ANOVA for e, g, k, l, n, u; two-tailed unpaired t-tests for h, i, p, q, r, s, v, w. Source data are provided in the Source Data file.
Fig. 4
Fig. 4. Overexpression of β-endorphin in Arc POMC neurons failed to reduce body weight or obesity reversal.
a Diagram depicting one side injection of β-endorphin viral vectors to Arc POMC neurons. b, c Expression patterns of β-endorphin (b, n = 3/each, two-tailed paired t-tests, *p = 0.0055) and α-MSH (c) in the Arc of virus-injected POMC-Cre mice. Note that the β-endorphin expression level was showed much higher on the injected side compared to the non-injection side (b), but no difference in α-MSH expression was observed between the two sides (c). 3 V: third ventricle, Arc arcuate nucleus. Scale bars: 50 µm for b and c and 20 µm for boxed areas. d β-endorphin mice exhibited significantly less sensitivity to pain induced in hot plate assay (n = 8/each, two-tailed unpaired t-tests, *p = 0. 0113). e Diagram showing experimental scheme on POMC-Cre mice with bilateral delivery of the indicated viral vectors to the Arc followed by a 6-week chow diet and then another 6-week HFD feeding with the CLAMS measurement during the diet transition. f Weekly body weight between the injected mouse groups after viral delivery (n = 5/each, two-way ANOVA, p > 0.9 for all time points). g, h Comparison in fat mass (g, n = 5/each, two-tailed unpaired t-tests, p = 0.3712) and lean mass (h, n = 5/each, two-tailed unpaired t-tests, p = 0.5623) at 13 weeks after viral delivery. ik Comparison between the two groups of mice on both chow and HFD in feeding (i, n = 5/each, two-way ANOVA, p = 0.99, 0.07, respectively), O2 consumption (j, n = 5/each, two-way ANOVA, p = 0.6016, 0.6276, respectively), and locomotion (k, n = 5/each, two-way ANOVA, p = 0.1093, 0.0577, respectively) measured during diet transition when there was no significant difference between the two groups. All data were presented as mean ± SEM. Source data are provided in the Source Data file.
Fig. 5
Fig. 5. Specific overexpression of POMC in POMC neurons failed to reduce body weight.
a, b POMC-Cre mice received injections of AAV-Flex-POMC-GFP viral vectors to one side of the Arc and immunostained for α-MSH (a, magenta) or β-endorphin (b, magenta). Brain sections showing colocalization between viral expression (green) and both peptides (magenta, left panels), peptide expression alone in the Arc (middle panels with a magnified view of the indicated boxed area) and the PVH (right panels). Note that the injected side exhibited an increase in both α-MSH and β-endorphin expression compared to the non-injection side. Arrows in the PVH pointing to the area with increased immunostaining structures. 3 V: third ventricle; Arc arcuate nucleus. Scale bars 50 µm for a and b, 20 µm for boxed areas. c Diagram showing experimental procedures and study timelines. d Weekly body weight after viral delivery (n = 6/GFP and n = 5/POMC, two-way ANOVA, p > 0.98 at 1–13 weeks). e, f Comparison in fat mass (e, n = 6/each, two-tailed unpaired t-tests, p = 0.1997) and lean mass (f, n = 6/each, two-tailed unpaired t-tests, p = 0.8205) at 13 weeks after viral delivery. gi Comparison between the two groups of mice on both chow and HFD in feeding (g, two-way ANOVA, n = 6/GFP and n = 4/POMC on chow, n = 6/GFP and n = 5/POMC on HFD, p = 0.9867 or 0.7787, respectively), O2 consumption (h, n = 6/each, two-way ANOVA, p = 0.5017, * p = 0.0396, respectively) and locomotion (i, n = 6/each, two-way ANOVA, p = 0.9749, 0.9168, respectively) that measured during diet transition when there was no significant difference between the two groups. All data were presented as mean ± SEM. Source data are provided in the Source Data file.
Fig. 6
Fig. 6. PVH MC4Rs are required but not sufficient for body weight regulation.
a MC4R-Cre mice receiving control AAV-Flex-GFP (top panels) or AAV-Flex-NachBac-GFP (bottom panels) to the PVH, and expression patterns of GFP (left panels), c-Fos (middle panels) and their merged pictures (right panels) were shown. 3 V: the third ventricle. Scale bars: 50 µm. b Quantification of c-Fos expression in the PVH of MC4R-Cre mice receiving injections of either control or NachBac (n = 5/each; two-tailed unpaired t-test, ***p < 0.001). c Comparison in body weight of MC4R-Cre mice receiving injections of control, AAV-Flex-NachBac-eGFP, or AAV-Flex-Kir2.1-dTomato to bilateral PVH and fed with chow (n = 6/GFP, n = 5/NachBac, and n = 10/Kir2.1, two-way ANOVA, #p = 0.0292, PVHKir2.1 group vs. PVHGFP group at 1 week; **p < 0.01, ***p < 0.001, PVHKir2.1 group vs. PVHGFP and PVHNachBac groups at 2–8 weeks). d Body weight curve of MC4R-Cre mice receiving injections of control, AAV-Flex-NachBac-eGFP to bilateral PVH and fed with HFD (n = 6/GFP, n = 5/NachBac, two-way ANOVA, p > 0.05 for all time points). ej MC4R-Cre male mice receiving injections of AAV-Flex-NachBac-GFP or control vectors to bilateral PVH were subject to CLAMS measurements 3–4 days after viral delivery when there was no difference in body weight, and shown were food intake patterns (e), comparisons in food intake during the day and night periods (f, n = 6/each, two-way ANOVA, p = 0.4156, 0.4462, respectively), O2 consumption patterns (g) and comparisons in O2 consumption during the day and night periods (h, n = 6/each, two-way ANOVA, p = 0.9489, 0.8559, respectively), locomotion patterns (i) and comparisons in bean breaks during day and night periods (j, n = 6/each, two-way ANOVA, p = 0.5644, 0.3941, respectively). All data were presented as mean ± SEM. Source data are provided in the Source Data file.
Fig. 7
Fig. 7. MC4R overexpression in PVHMC4R neurons failed to reduce body weight.
MC4R- a Representative images showing AAV viral injections and associated c-Fos expression in the PVH: control vector (left panels, green), MC4R vector (right panels, green), c-Fos by i.c.v. saline (top panels, red), and α-MSH (bottom panels, red) treatments. 3 V: the third ventricle. Scale bars: 50 µm. b Comparison of action potential frequency changes by the MC4R agonist MTII (n = 6 cells/GFP from 2 mice and n = 7cells/MC4R from 2 mice, two-tailed unpaired t-test, *p = 0.0455). c Comparison of i.c.v. α-MSH inhibition on fast-refeeding between control and PVH MC4R overexpression mice (n = 5/group, two-way ANOVA, *p = 0.0329, PVHGFP vs. PVHMC4R at 8 h). d Weekly body weight changes of MC4R-Cre mice receiving injections of AAV-Flex-MC4R-p2A-EGFP or control vectors on chow (8 weeks) and followed by 8 weeks on HFD (n = 4/GFP and n = 5/MC4R, two-way ANOVA, p > 0.05 for all time points). eh Comparisons of food intake during the 2-day measurement period (e) and amounts in food intake during the day and night periods (f, n = 6/each, two-way ANOVA, p = 0.9264, 0.9996, respectively), and O2 consumption patterns (g) and the amounts in O2 consumption during the day and night periods (h, n = 6/each, two-way ANOVA, p = 0.9216, 0.9653, respectively). i The diagram showing the proposed revision of the relationship between the strength of the melanocortin action and body weight. The perceived reverse linear relationship (left) between the melanocortin action and body weight is proposed to be replaced by a rectified relationship (right) in which lower than normal action of the melanocortin action is efficient to produce obesity, but higher than normal action is unable to efficiently reduce body weight or prevent obesity development. The red arrows on the X and Y axes indicate the respective melanocortin action and body weight at the normal basal state. All data were presented as mean ± SEM. Source data are provided in the Source Data file.

Similar articles

Cited by

References

    1. Hruby A, Hu FB. The epidemiology of obesity: a big picture. Pharmacoeconomics. 2015;33:673–689. doi: 10.1007/s40273-014-0243-x. - DOI - PMC - PubMed
    1. Liu, T., Xu, Y., Yi, C. X., Tong, Q. & Cai, D. The hypothalamus for whole-body physiology: from metabolism to aging. Protein Cell 13, 394–421 (2021). - PMC - PubMed
    1. Flier JS. Obesity wars: molecular progress confronts an expanding epidemic. Cell. 2004;116:337–350. doi: 10.1016/S0092-8674(03)01081-X. - DOI - PubMed
    1. Pillon NJ, Loos RJF, Marshall SM, Zierath JR. Metabolic consequences of obesity and type 2 diabetes: balancing genes and environment for personalized care. Cell. 2021;184:1530–1544. doi: 10.1016/j.cell.2021.02.012. - DOI - PMC - PubMed
    1. Speakman JR. Obesity: the integrated roles of environment and genetics. J Nutr. 2004;134:2090S–2105S. doi: 10.1093/jn/134.8.2090S. - DOI - PubMed

Publication types

LinkOut - more resources