. 2023 Apr 17;14(1):2182.
doi: 10.1038/s41467-023-37968-x.

Plasticity in ventral pallidal cholinergic neuron-derived circuits contributes to comorbid chronic pain-like and depression-like behaviour in male mice

Affiliations

Plasticity in ventral pallidal cholinergic neuron-derived circuits contributes to comorbid chronic pain-like and depression-like behaviour in male mice

Ya-Wei Ji et al. Nat Commun. .

Abstract

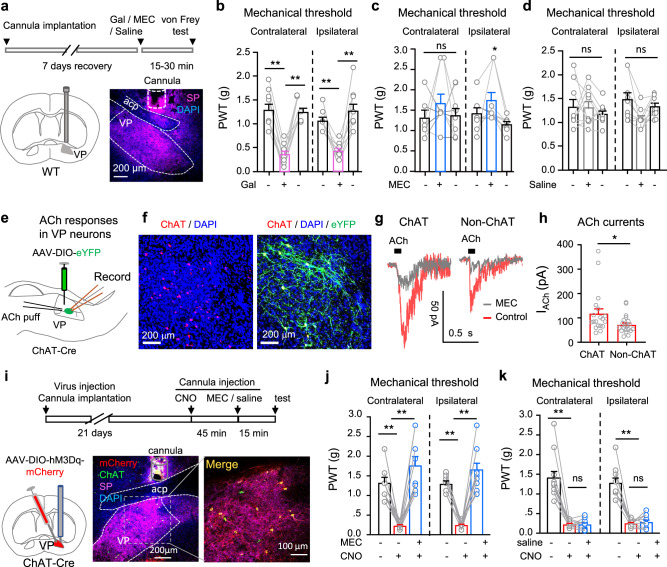
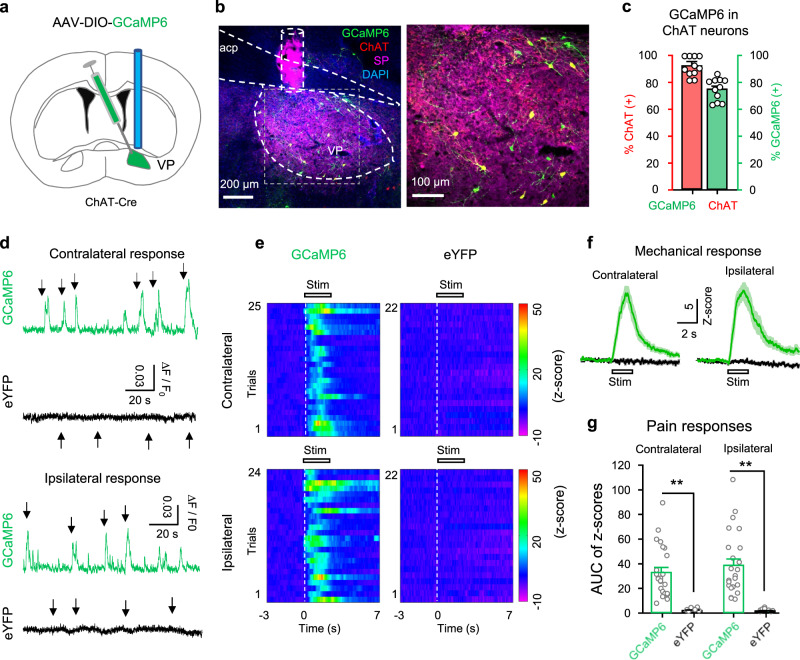
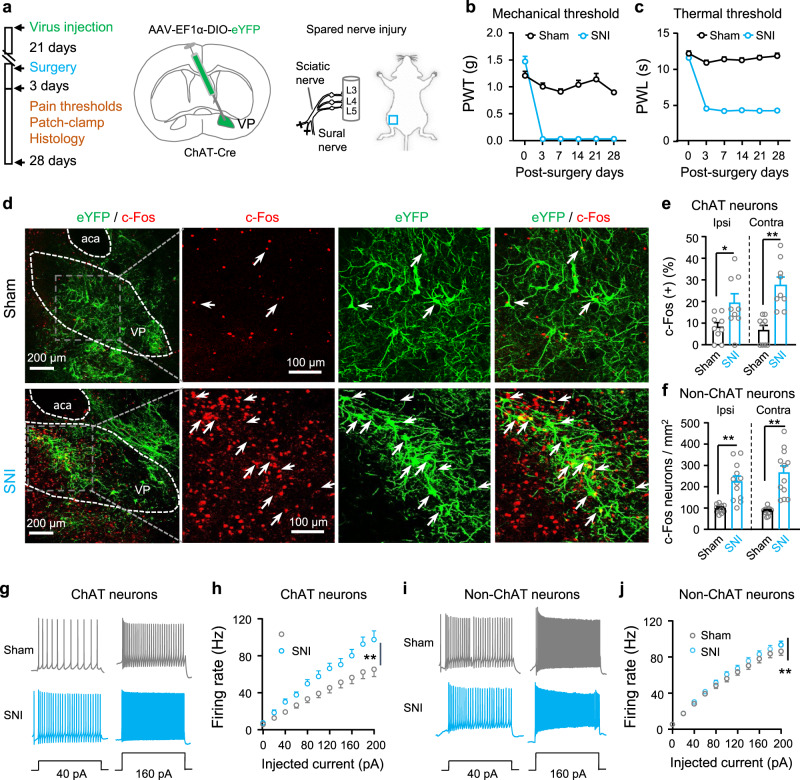
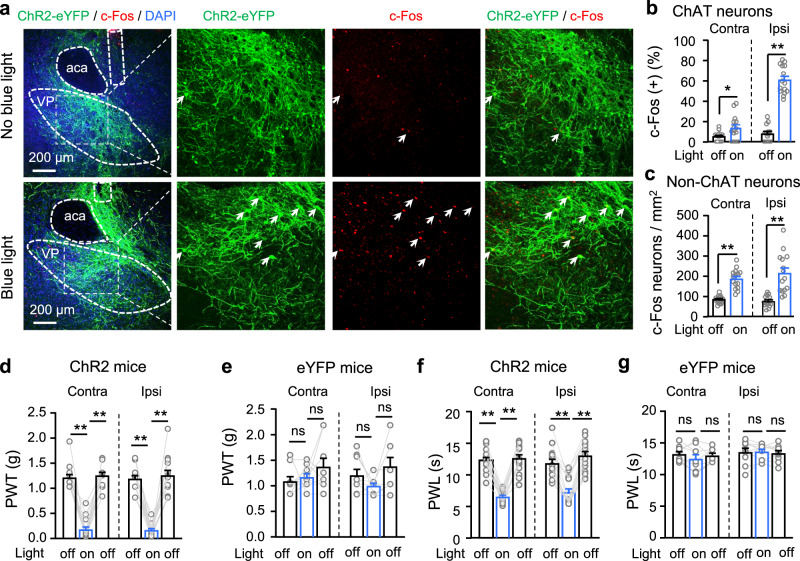
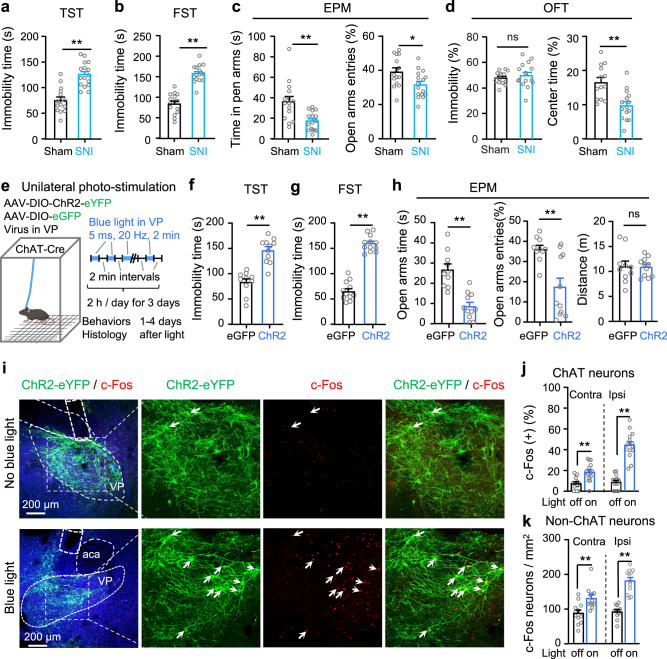
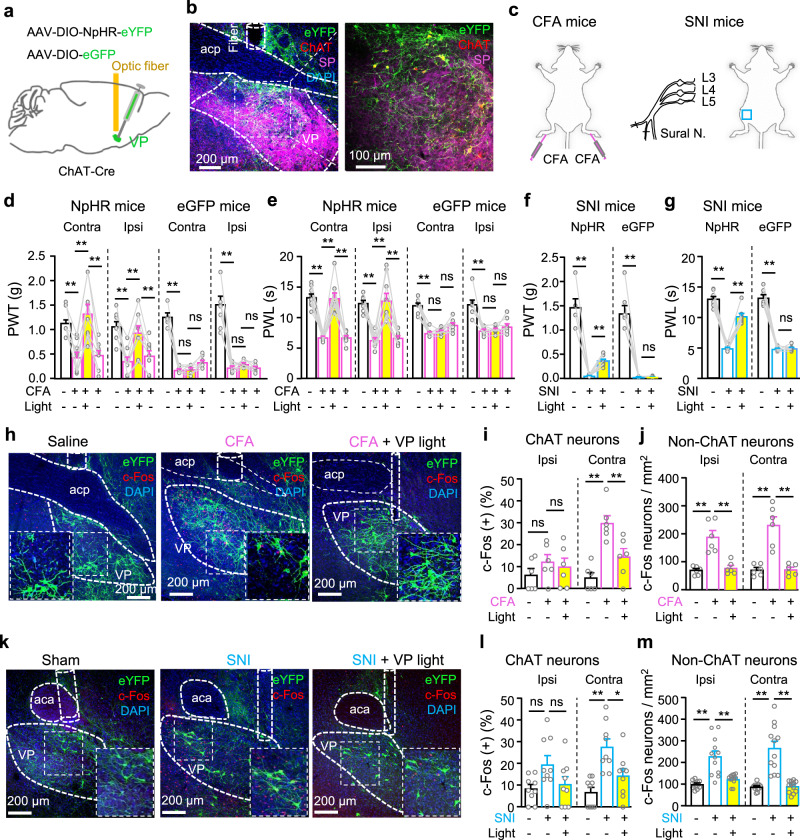
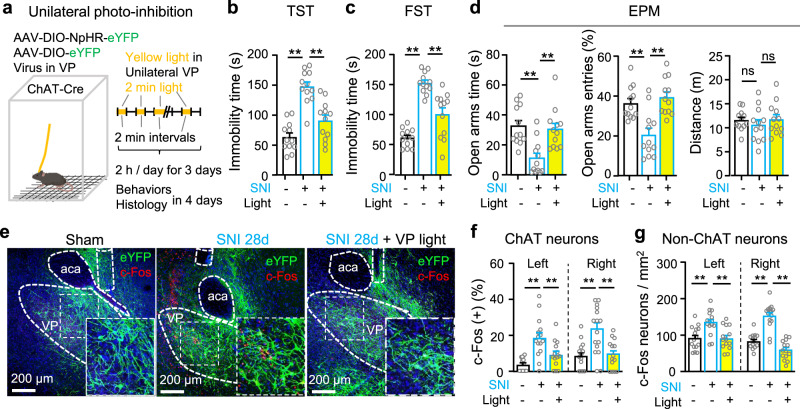
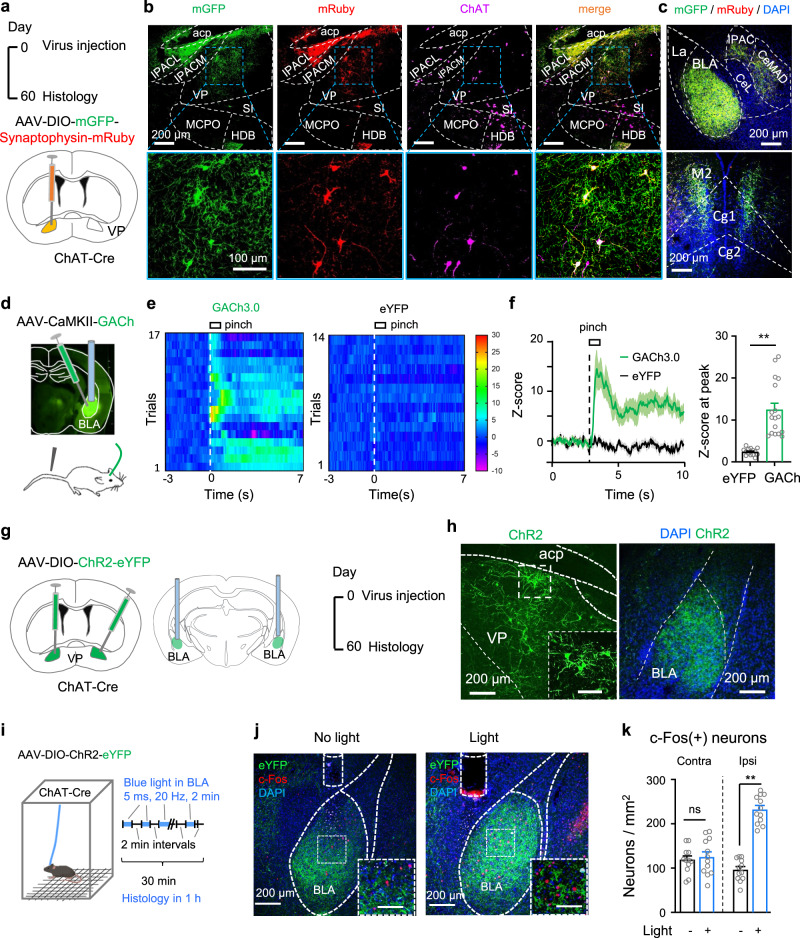
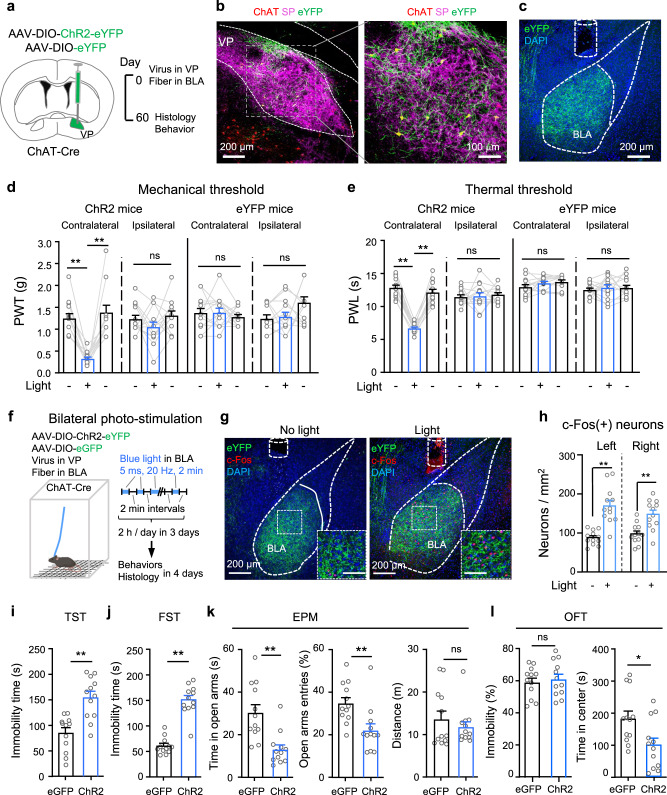
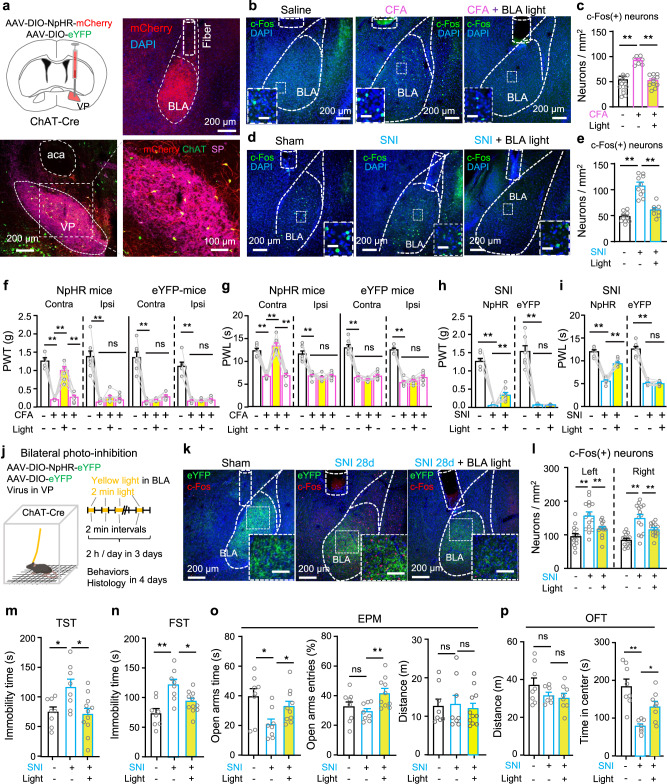
Nucleus- and cell-specific interrogation of individual basal forebrain (BF) cholinergic circuits is crucial for refining targets to treat comorbid chronic pain-like and depression-like behaviour. As the ventral pallidum (VP) in the BF regulates pain perception and emotions, we aim to address the role of VP-derived cholinergic circuits in hyperalgesia and depression-like behaviour in chronic pain mouse model. In male mice, VP cholinergic neurons innervate local non-cholinergic neurons and modulate downstream basolateral amygdala (BLA) neurons through nicotinic acetylcholine receptors. These cholinergic circuits are mobilized by pain-like stimuli and become hyperactive during persistent pain. Acute stimulation of VP cholinergic neurons and the VP-BLA cholinergic projection reduces pain threshold in naïve mice whereas inhibition of the circuits elevated pain threshold in pain-like states. Multi-day repetitive modulation of the VP-BLA cholinergic pathway regulates depression-like behaviour in persistent pain. Therefore, VP-derived cholinergic circuits are implicated in comorbid hyperalgesia and depression-like behaviour in chronic pain mouse model.


Conflict of interest statement

The authors declare no competing interests.

Figures

Fig. 1
Fig. 1. The VP ChAT circuit regulates the mechanical threshold.
a Galantamine (Gal, 10 μM), mecamylamine (MEC, 10 μM), and saline were microinjected into the right VP through a cannula. A representative image of substance P (SP, purple) antibody-stained coronal brain section among nine repeats. bd Mechanical paw withdrawal thresholds (PWT) on both hind paws before (baseline), 15–30 min and 24 h after injection of Gal (b), MEC (c), and saline (d) into the VP (n = 9 mice). b Contralateral: F(1.167, 9.338) = 29.45, P < 0.001; t = 6.83, df = 8, P < 0 001, Gal vs baseline. Ipsilateral: F(1.626, 13.00) = 19.56, P < 0.001; t = 5.99, df = 8, P < 0 001, Ga1 vs baseline. c Contralateral: F(1.895, 15.16) = 0.87, P = 0.44. Ipsilateral: F(1.384, 11.07) = 5.48, P = 0.02; t = 3.31, df = 8, P = 0.01, MEC vs recovery. d Contralateral: F(1.336, 10.69) = 0.80, P = 0.48. Ipsilateral: F(1.620, 12.96) = 0.88. P = 0.45. e Whole-cell patch-clamp recordings were performed from virally labeled VP ChAT neurons to record responses to acetylcholine (ACh). f Representative images among five sets of repeats showing eYFP-labeled VP ChAT (ChAT) neurons. g ACh-evoked MEC-sensitive currents in VP ChAT and non-ChAT neurons. h Amplitude of ACh-evoked inward currents in ChAT (n = 19) and non-ChAT (n = 20) neurons in the VP from five mice. t = 2.12, df = 37, P = 0.04. i Schematic diagram for chemogenetic activation of VP ChAT neurons by delivering clozapine-N-oxide (CNO, 10 μM) into the VP through a cannula. Representative image is from 11 sections (one from each mouse) stained with ChAT (green) and SP (purple) antibodies and DAPI (blue). j Mechanical PWTs were measured before and 45–60 min after CNO or CNO-MEC was injected into the VP. n = 11 mice. k Mechanical PWTs were measured before and 45–60 min after CNO or CNO-saline was injected into the VP. n = 11 mice. One-way repeated-measures ANOVAs with Bonferroni tests and Geisser–Greenhouse correction were used in (bd) and (j, k). Two-tailed t-test was used in (h). *P < 0.05; **P < 0.01; ns not significant.
Fig. 2
Fig. 2. Enhanced activity in VP ChAT neurons upon acute pain-like stimulation.
a AAV-EF1α-DIO-GCaMP6s was injected into the VP of ChAT-Cre mice. b A representative image of a coronal section containing GCaMP6 (green)-labeled neurons and ChAT- and SP-antibody-stained neurons and tissue. c Efficiency (green) (74 ± 3.20%, n = 12 section from six mice) and specificity (red) (93 ± 2.4%, n = 12 sections from six mice) of GCaMP6-labeling of ChAT neurons in the VP (n = 5 mice). d Representative raw traces showing the responses of GCaMP6-labeled (green) and eYFP-labeled (black) ChAT neurons in the VP to pain-like stimulation (pressure) on the contralateral and ipsilateral hind paws. Arrow, pain-like stimulation. e Heat maps showing the relative fluorescent signals from five GCaMP6 mice (n = 22 trials) and five eYFP mice (n = 25 trials) before (3 s), during (2 s), and after (7 s) the application of stimulation to the contralateral and ipsilateral hind paws. Each panel includes data from five mice (4–5 trials from each mouse). f The fluorescence intensities of GCaMP6 (green) and eYFP (black) were transformed into their z-scores (mean ± SEM). Each trace summarizes data from the same trials as this in (e). g The peak amplitudes of GCaMP6 (n = 22 trials from 5 GCaMP6 mice) and eYFP (n = 25 trials from five eYFP mice) responses to pain-like stimulation on hind paws. Contralateral: t = 7.91, df = 45, P < 0.001; ipsilateral: t = 7.38, df = 44, P < 0.001, two-tailed t-test. **P < 0.01.
Fig. 3
Fig. 3. Mice with neuropathic pain exhibit hyperactivity in ChAT and non-ChAT neurons in the VP.
a Schematic diagram for eYFP-labeling of VP ChAT neurons and for spared sciatic nerve injury (SNI) on the left side. b The mechanical threshold on the left hind paw was measured with von Frey filaments after surgery. Sham: n = 15 mice; SNI: n = 16 mice. Group: F(1, 29) = 330.7, P < 0.0001. Time: F(5, 145) = 75.51, P < 0.0001. c The thermal threshold on the left hind paw was measured with a plantar anesthesia tester after surgery. Sham: n = 15 mice; SNI: n = 16 mice. Group, F(1, 29) = 688.2, P < 0.0001. Time, F(5, 145) = 86.09, P < 0.0001. df Representative images (from contralateral VP) and summary showing c-Fos-positive neurons (red) in ChAT neurons (eYFP-labeled, green) and non-ChAT neurons (red only) in the VP on both sides. Sham: n = 9 sections from five mice; SNI: n = 9 sections from five mice. e Ipsilateral: t = 2.44, df = 16, P = 0.026; contralateral: t = 4.90, df = 16, P = 0.0002. f Ipsilateral: t = 4.96, df = 22, P < 0.0001; contralateral: t = 5.65, df = 22, P < 0.0001. g, h Representative traces and summary of firing rates in response to depolarizing current injections in ChAT neurons (n = 22 neurons from five Sham mice and n = 12 neurons from five SNI mice). Current: F(10, 231) = 34.49, P < 0.0001, Group, F(1, 121) = 113.2, P < 0.0001. i, j Representative traces and summary of firing rates in response to depolarizing current injections in non-ChAT neurons (n = 41 neurons from five Sham mice and n = 50 neurons from five SNI mice). Current: F(10, 539) = 150, P < 0.0001; Group, F(1, 440) = 7.75, P = 0.006. Two-way repeated-measures ANOVAs were used in (b, c, h, j). Two-tailed t-test was used in (e, f). **P < 0.01; ns not significant. Ipsi ipsilateral, Contra contralateral.
Fig. 4
Fig. 4. Optogenetic stimulation of VP ChAT neurons reduces mechanical and thermal thresholds and increases depression-like behaviours.
ac Representative images (ipsilateral side) and summary showing that unilateral optogenetic stimulation of VP ChAT (ChAT) neurons increased the number of c-Fos-positive ChAT neurons (red + green) and non-ChAT neurons (red only) in the VP on both sides. b ChAT neurons. Contralateral: t = 2.46, df = 28, P = 0.02. Ipsilateral: t = 12.99, df = 28, P < 0.0001. c non-ChAT neurons. Contralateral: t = 7.61, df = 28, P < 0.0001. Ipsilateral: t = 5.28, df = 28, P < 0.0001). No light: n = 15 sections; light: n = 15 sections. All from five mice in each group. dg Mechanical PWT and thermal paw withdrawal latency (PWL) on hind paws before (off), during (on) (between 1–3 min light on), and after (off) (10 min after light off) illumination of the VP in ChR2 mice (n = 15) and eYFP mice (n = 9). d Contralateral: F(1.817, 25.44) = 92.75, P < 0.001. t = 11.33, df = 14, P < 0.001, off vs on. Ipsilateral: F(1.357, 18.99) = 71.08, P < 0.001. t = 15.92, df = 14, P < 0.001, off vs on. e eYFP mice. Contralateral: F(1.422, 11.37) = 1.43, P = 0.27. Ipsilateral: F(1.893, 15.14) = 3.01, P = 0.08. f Contralateral: F(1.988, 27.83) = 94.43, P < 0.001. t = 12.01, df = 14, P < 0.001, off vs on. Ipsilateral: F(1.723, 24.12) = 88.83, P < 0.001. t = 8.44, df = 14, P < 0.001, off vs on. g Contralateral: F(1.738, 13.90) = 1.60, P = 0.24. Ipsilateral: F(1.325, 10.60) = 0.17, P = 0.84. One-way repeated-measures ANOVAs with Bonferroni tests were used for (dg). Two-tailed t-tests were used for (b, c). **P < 0.01; ns not significant. Contra contralateral, Ipsi ipsilateral.
Fig. 5
Fig. 5. Repetitive optogenetic stimulation of VP ChAT neurons causes depression- and anxiety-like behaviours.
ad Tests for emotion-like behaviours were conducted in Sham mice (n = 13–15) and SNI mice (n = 15–20). a Tail suspension test (TST). t = 8.48, df = 28, P < 0.0001. b Forced swim test (FST). t = 5.79, df = 29, P < 0.0001. c Elevated plus maze (EPM). Time in open arms: t = 3.55, df = 29, P = 0.0013. Open-arm entries: t = 2.57, df = 29, P = 0.016. d Open field arena (OFT). Immobility: t = 0.73, df = 26, P = 0.47. Time in center: t = 3.88, df = 26, P = 0.0006. e Schematic diagram for repetitive (3-day) unilateral photo-stimulation of VP ChAT neurons in ChR2 and eGFP mice. f Immobility time in the TST. t = 6.13, df = 19, P < 0.0001. eGFP: n = 10; ChR2: n = 11. g Immobility time in the FST. t = 12.80, df = 21, P < 0.0001. eGFP: n = 11; ChR2: n = 12. h Time in and entries into the open arms of the EPM. Time in open-arms: t = 5.35, df = 19, P < 0.0001; Open-arm entries: t = 3.65, df = 19, P = 0.002; Distance in EPM: t = 0.13, df = 19, P = 0.90. eGFP: n = 10; ChR2: n = 11. ik Representative images and summary showing c-Fos-positive ChAT and non-ChAT neurons in the VP in ChR2 mice 3–4 days after discontinuation of repetitive photo-stimulation of the VP. j ChAT neurons. Left: t = 4.04, df = 28, P = 0.0004. Right: t = 9.96, df = 28, P < 0.0001. n = 15 sections from five mice in each group. k Non-ChAT neurons. Left: t = 3.4, df = 22, P = 0.0026. Right: t = 7.93, df = 22, P < 0.0001. n = 12 sections from five mice in each group. Two-tailed t-tests were used for (ad, fh, jk). **P < 0.01; ns not significant. Contra contralateral, Ipsi ipsilateral.
Fig. 6
Fig. 6. Optogenetic inhibition of VP ChAT neurons mitigates the reduction in pain thresholds in persistent pain.
a, b Schematic diagram and a representative image out of 9 for optogenetic (NpHR) inhibition of VP ChAT neurons. c Establishment of pain mouse models. d, e PWT and PWL for both hind paws of NpHR (n = 9) and eGFP (n = 8) mice before, during, and after yellow-light illumination of the right VP, corresponding to before and 24, 48, 72 h after CFA injection. f, g PWT and PWL on the left hind paw of NpHR (n = 8) and eYFP (n = 7) mice before and during yellow light in the right VP in SNI mice. f NpHR: F(1.060, 7.420) = 53.90, P = 0.0001; t = 8.24, df = 7, P = 0.0001, baseline vs SNI; t = 8.75, df = 7, P < 0.001, SNI vs SNI-VP-light. eYFP: F(1.002, 6.010) = 67.52, P = 0.0002; t = 8.19, df = 6, P = 0.0004, baseline vs SNI; t = 0.39, df = 6, P = 0.71, SNI vs SNI-VP-light. g NpHR: F(1.321, 9.245) = 104.3, P < 0.0001; t = 14.98, df = 7, P < 0.0001, baseline vs SNI; t = 14.14, df = 7, P < 0.001, SNI vs SNI-VP-light. eYFP: F(1.224, 7.346) = 236.40, P < 0.0001; t = 14.97, df = 6, P < 0.0001, baseline vs SNI; t = 0.45, df = 6, P = 0.67, SNI vs SNI-VP-light. hj Representative images and summary showing NpHR-labeled VP ChAT neurons and c-Fos-positive VP neurons from saline (n = 6), CFA (n = 6), and CFA-VP-light (n = 6) mice. km Representative images and summary showing NpHR-labeled VP ChAT neurons and c-Fos-positive ChAT and non-ChAT neurons in the VP from Sham (n = 9), SNI (n = 9), and SNI-VP-light (n = 9) mice. One-way repeated-measures ANOVAs with Bonferroni tests and Geisser–Greenhouse corrections were used for (dg). One-way ANOVAs with Bonferroni tests were used for (i, j, l, m). *P < 0.05; **P < 0.01; ns not significant. Contra contralateral, Ipsi ipsilateral.
Fig. 7
Fig. 7. Repetitive photoinhibition of VP ChAT neurons mitigates depression- and anxiety-like behaviours in persistent pain.
ad Schematic diagram for repetitive optogenetic inhibition of VP ChAT neurons and behavioural tests in sham (n = 12), SNI (n = 12), SNI-VP-light (n = 12) mice. b TST. F(2, 33) = 27.86, P < 0.0001. t = 7.32, df = 33, P < 0.0001, Sham vs SNI; t = 4.94, df = 33, P < 0.0001, SNI vs SNI-VP-light. c FST. F(2, 33) = 39.43, df = 33, P < 0.0001. t = 8.85, df = 33, P < 0.0001, Sham vs SNI. t = 5.06, df = 33, P < 0.0001, SNI vs SNI-VP-light. d EPM. Time in open-arms: F(2, 33) = 10.31, P = 0.0003. t = 4.12, df = 33, P = 0.0005, Sham vs SNI. t = 3.71, df = 33, P = 0.0008, SNI vs SNI-VP-light; Open-arm entries: F(2, 33) = 12.95, P < 0.0001. t = 3.97, df = 33, P = 0.0004, Sham vs SNI; t = 4.74, df = 33, P < 0.0001, SNI vs SNI-VP-light; Distance: F(2, 33) = 0.47, P = 0.63. eg Representative images and summary of c-Fos(+) ChAT and non-ChAT neurons in sham (n = 15), SNI (n = 14), and SNI-VP-light (n = 14) sections from 5 mice in each group. f ChAT neurons. Left: F(2, 41) = 13.51, P < 0.0001; t = 5.15, df = 41, P < 0.0001, sham vs SNI; t = 3.17, df = 41, P = 0.006, SNI vs SNI-VP-light. Right: F(2, 41) = 12.73, P < 0.0001; t = 4.56, df = 41, P = 0.0001, sham vs SNI; t = 4.12, df = 41, P = 0.0004, SNI vs SNI-VP-light. g Non-ChAT neurons. Left: F(2, 41) = 9.78, P = 0.0003; t = 3.89, df = 41, P = 0.001, sham vs SNI; t = 3.75, df = 41, P = 0.001, SNI vs SNI-VP-light. Right: F(2, 41) = 44.84, P < 0.0001; t = 6.75, df = 41, P < 0.0001, sham vs SNI; t = 9.10, df = 41, P < 0.0001, SNI vs SNI-VP-light. One-way ANOVAs with Bonferroni tests were used for (bd, fg). * P < 0.05; **P < 0.01; ns not significant.
Fig. 8
Fig. 8. VP ChAT neurons innervate BLA neurons via functional connections.
a AAV-EF1α-DIO-mGFP-Synpatophysin-mRuby was injected into the VP of ChAT-Cre mice. The mice were sacrificed 2 months later. b Histological verification of mGFP and mRuby in VP ChAT neurons. c mGFP and mRuby were colocalized in the BLA, the medial central amygdala (CeM), the cingulate cortex (Cg), and the secondary motor cortex (M2). d AAV-CaMKII-GACh, an ACh sensor, and AAV-hSyn-eYFP were transfected into the BLA in mice. Fiber photometry recordings were performed to monitor ACh release in the BLA. e, f GACh and eYFP signals in the BLA were transformed into z-scores. Heat-maps, summarized traces, and summary of the amplitudes of GACh and eYFP signals in response to a 1 s tail pinch are shown. Peak amplitudes: t = 5.683, df = 32, P < 0.0001, n = 17 trials from 6 GACh mice, n = 17 trials from six eYFP mice, two-tailed t-test. g AAV-EF1α-DIO-ChR2-eYFP was transfected in the VP of ChAT-Cre mice. h Representative images showing ChR2-expressing neurons in the VP and dense ChR2-expressing axonal fibers in the BLA. i AAV-EF1α-DIO-ChR2-eYFP was transfected into the right VP of ChAT-Cre mice and an optical fiber was implanted in the right BLA. Two-minute blue light stimulation (5 ms, 20 Hz, 4 mW) episodes with 2 min inter-episode intervals were delivered into the BLA for 30 min. The mice were sacrificed 1 h after stimulation for histological experiments. j Representative images showing that 30 min optogenetic stimulation of the VPChAT-BLA projection increased the number of c-Fos-positive neurons in the BLA. k c-Fos-positive neurons in the BLA in both hemispheres in mice with and without light illumination. Contralteral: t = 0.47, df = 22, P = 0.64. Ipsilateral: t = 11.87, df = 22, P < 0.0001. n = 12 slices from five mice, two-tailed t-test. **P < 0.01; ns not significant. Contra contralateral, Ipsi ipsilateral. Scale bar in (h, j): 100 μm.
Fig. 9
Fig. 9. Optogenetic stimulation of the VPChAT-BLA projection reduces pain thresholds and induces depression- and anxiety-like behaviours.
ac Schematic diagram and representative images for unilateral optogenetic stimulation of the VP-BLA ChAT projection. d, e Mechanical PWT and thermal PWL on hind paws before, during, and after unilateral BLA light in ChR2 (n = 13) and eYFP (n = 13) mice. d PWT. ChR2: contralateral: F(1.555, 18.66) = 24.22, P < 0.001; t = 8.18, df = 12, P < 0.0001, off vs on; ipsilateral: F(1.983, 23.80) = 1.79, P = 0.19. eYFP: contralateral, F(1.993, 23.92) = 0.41, P = 0.67; ipsilateral, F(1.432, 17.18) = 3.19, P = 0.08, off vs on. e PWL. Contralateral: F(1.935, 23.22) = 128.1, P < 0.0001, t = 16.18, df = 12, P < 0.001, off vs on; ipsilateral: F(1.631, 19.57) = 0.17, P = 0.80. eYFP: contralateral, F(1.254, 15.04) = 1.81, P = 0.20; ipsilateral, F(1.831, 21.97) = 0.27, P = 0.27. f Schematic diagram for 3-day repetitive bilateral stimulation of the VPChAT-BLA projection. g, h Representative images (g) and summary (h) showing that repetitive photo-stimulation of the VPChAT-BLA projection increased the number of c-Fos-positive neurons in the BLA, measured 2 days after discontinuation of photo-stimulation. Left: t = 5.58, df = 22, P < 0.0001; Right: t = 3.81, df = 22, P = 0.001. no light: n = 12 sections from seven mice; light: n = 12 sections from six mice. il Behavioural tests in ChR2 (n = 12) and eGFP (n = 12) mice. i TST. T = 4.46, df = 22, P = 0.0002. j FST. t = 9.31, df = 22, P < 0.0001. k EPM. Time in open-arms: t = 3.92, df = 22, P = 0.0007. Open-arms entries: t = 3.05, df = 22, P = 0.006. l OFT. Immobility: F = 0.45, df = 22, P = 0.66. Time in center: t = 2.57, df = 22, P = 0.017. One-way repeated-measures ANOVAs with Bonferroni tests and Geisser–Greenhouse corrections were used for (d, e). Two-tailed t-tests were used for (hl) (left panel). Kurskal Wallis one-way ANOVA on ranks test was used for l (right panel). *P < 0.05; **P < 0.01; ns not significant.
Fig. 10
Fig. 10. Optogenetic inhibition of the VPChAT-BLA projection mitigates hyperalgesia and depression- and anxiety-like behaviours in persistent pain.
a Schematic and representative images for unilateral optogenetic inhibition of the VP-BLA ChAT projection. b, c Representative images and summary of numbers of c-Fos(+) BLA neurons in Saline (n = 11), CFA (n = 8), CFA-BLA-light (n = 11) mice. F(2, 27) = 41.18, P < 0.0001; t = 8.68, df = 27, P < 0.0001, saline vs CFA; t = 7.19, df = 27, P < 0.0001, CFA vs CFA-BLA-light. d, e Representative images and summary of numbers of c-Fos(+) BLA neurons in Sham (n = 10), SNI (n = 10), SNI-BLA-light (n = 8) mice. F(2, 25) = 44.24, P < 0.0001; t = 9.00, df = 25, P < 0.0001, sham vs SNI; t = 6.65, df = 25, P < 0.0001, SNI vs SNI + BLA light. f, g Mechanical and thermal thresholds on both hind paws of NpHR and eYFP mice were measured before, during, and after illumination of the right VPChAT-BLA projection, corresponding to before and 24, 48, and 72 h after CFA injection. eYFP-CFA: n = 7 mice; NpHR-CFA: n = 8 mice. h, i Mechanical and thermal thresholds on the left hind paw of NpHR (n = 8) and eYFP (n = 8) mice were measured before and during yellow light illumination of the right VPChAT-BLA projection, 10 days after SNI surgery on the left side. j Schematic diagram showing 3-day bilateral optogenetic inhibition of the VP-BLA ChAT projection in sham and SNI mice. k, l Representative images and summary showing the numbers of c-Fos(+) BLA neurons in Sham, SNI, and SNI-BLA-light mice. n = 15 sections from five mice in each group. mp Depression-like behaviours in eGFP-Sham (n = 8), SNI (n = 8), and SNI-BLA-light (n = 11) mice. One-way ANOVAs with Bonferroni tests were used in (c, e, lp). Friedman Repeated-Measures ANOVA on Ranks was used in (f). One-way repeated-measures ANOVAs was used in (gi). *P < 0.05; **P < 0.01; ns not significant. Scale bars in insets: 50 μm in (b, d); 100 μm in (k).

References

    1. Hylands-White N, Duarte RV, Raphael JH. An overview of treatment approaches for chronic pain management. Rheumatol. Int. 2017;37:29–42. doi: 10.1007/s00296-016-3481-8. - DOI - PubMed
    1. Fayaz A, Croft P, Langford RM, Donaldson LJ, Jones GT. Prevalence of chronic pain in the UK: a systematic review and meta-analysis of population studies. BMJ Open. 2016;6:e010364. doi: 10.1136/bmjopen-2015-010364. - DOI - PMC - PubMed
    1. Macfarlane GJ. The epidemiology of chronic pain. Pain. 2016;157:2158–2159. doi: 10.1097/j.pain.0000000000000676. - DOI - PubMed
    1. GBD. 2016 disease and injury incidence and prevalence collaborators. Global, regional, and national incidence, prevalence, and years lived with disability for 328 diseases and injuries for 195 countries, 1990-2016: a systematic analysis for the Global Burden of Disease Study 2016. Lancet. 2017;390:1211–1259. doi: 10.1016/S0140-6736(17)32154-2. - DOI - PMC - PubMed
    1. Ji RR, Nackley A, Huh Y, Terrando N, Maixner W. Neuroinflammation and central sensitization in chronic and widespread pain. Anesthesiology. 2018;129:343–366. doi: 10.1097/ALN.0000000000002130. - DOI - PMC - PubMed

Publication types