. 2023 Apr 17;14(1):2186.
doi: 10.1038/s41467-023-37974-z.

Distinct astrocytic modulatory roles in sensory transmission during sleep, wakefulness, and arousal states in freely moving mice

Affiliations

Distinct astrocytic modulatory roles in sensory transmission during sleep, wakefulness, and arousal states in freely moving mice

Fushun Wang et al. Nat Commun. .

Abstract

Despite extensive research on astrocytic Ca2+ in synaptic transmission, its contribution to the modulation of sensory transmission during different brain states remains largely unknown. Here, by using two-photon microscopy and whole-cell recordings, we show two distinct astrocytic Ca2+ signals in the murine barrel cortex: a small, long-lasting Ca2+ increase during sleep and a large, widespread but short-lasting Ca2+ spike when aroused. The large Ca2+ wave in aroused mice was inositol trisphosphate (IP3)-dependent, evoked by the locus coeruleus-norepinephrine system, and enhanced sensory input, contributing to reliable sensory transmission. However, the small Ca2+ transient was IP3-independent and contributed to decreased extracellular K+, hyperpolarization of the neurons, and suppression of sensory transmission. These events respond to different pharmacological inputs and contribute to distinct sleep and arousal functions by modulating the efficacy of sensory transmission. Together, our data demonstrate an important function for astrocytes in sleep and arousal states via astrocytic Ca2+ waves.


Conflict of interest statement

The authors declare no competing interests.

Figures

Fig. 1
Fig. 1. Two distinct Ca2+ waves at astrocytic fine processes are characterized for the sleep and awake states.
A A schematic drawing depicting the experimental setup combining two-photon imaging of astrocytic Ca2+ signaling in the barrel cortex with in vivo whole-cell recordings in single neurons and local field recordings in awake behaving GCaMP6f transgenic mice. B Representative fluorescence photomicrographs of the barrel cortex displaying the expression of GCaMP6f (left panel), SR101-loaded astrocytes (middle panel), and merged images (right panel) illustrating that some of the GCaMP6f-expressing astrocytes were colabeled with SR101-loaded astrocytes. Scale bar = 10 µm. C Representative recordings of EEG and EMG and power spectrum analyses during sleep and in awake mice (blue as sleep; red as arousal). Upper traces are representative ECoG traces from whisker stimulation. Awake states were shown as no apparent evoked ECoG response and strong EMG activity. D Representative fluorescence changes showing that whisker stimulation induced small Ca2+ increases during sleep, scale bar = 10 µm. E The analyses of fluorescence changes corresponding to GCaMP6f F/F0 traces at the fine processes, which are marked as circles in (D), showing the higher amplitude response to the stimulation in awake mice. Note the significant increase in the peak in the awake state. FJ Statistical data show the comparison of whisker stimulation-induced changes in Ca2+ transients by measuring ΔF/F0 (F), latency (G), rise slope (H), decay (I), and duration (J), confirming the differential firing dynamics during sleep and awake states (the data are shown as the mean ± SD, **paired t-test, P < 0.001; n.s not significant, P = 0.161. The dots represent the mean value in each mouse, n = 6 mice in each group).
Fig. 2
Fig. 2. LC stimulation of adrenergic activity switched small Ca2+ signaling to large waves.
A Typical fluorescent images show that LC stimulation can induce large Ca2+ increases after LC stimulation. Scale bar = 20 µm. B A schematic illustrates projections from LC stimulation (red dashed line) and whisker stimulation (green solid line and blue dashed line) to the barrel cortex. LC stimulation was generated using bipolar concentric electrodes, while whisker stimulation was generated through air puffing. C Typical traces show the changes in Ca2+ transients and LFP EPSPs. Upper traces (blue trace is from sleeping state, while the red trace is after LC stimulation) are relative changes of Ca2+ (ΔF/F0) in an astrocytic process located close to the recording electrode. Lower traces are LFPs recorded by the recording electrode. D Analysis shows comparisons of the relative changes in Ca2+ (ΔF/F0) in astrocytic processes upon whisker stimulation (**P < 0.001, paired t-test for the first two pair of groups, n = 42 for before and after LC stimulation; n = 58 for before and after NE application. For other groups, one-way ANOVA was used, F (4,296) = 227.373, P < 0.001, spots show the average in each mouse, n = 5–6 mice, data are shown as the mean ± SD). E Analysis shows comparisons of the relative changes in LFP EPSPs upon whisker stimulation (**P < 0.01, one-way ANOVA, n = 5–6 mice, data are shown as the mean ± SD). The x-axis labels indicate the type of stimulation used. Additional abbreviations used are as follows: TER, α1-antagonist terazosin; MPEP, mGluR5 antagonist. F A cartoon shows the possible mechanism of two different effects of Ca2+ during sleep and waking, and NE is a switch between these two states.
Fig. 3
Fig. 3. Whisker stimulation induces large Ca2+ transients in awake mice that are glutamate-dependent.
A Fluorescent images showing that agonist (ATP 100 µM) induced large Ca2+ increases during waking states. Scale bar = 10 µm. B Comparisons of the relative changes in Ca2+ (ΔF/F0) in astrocytes upon whisker stimulation (**P < 0.01, one-way ANOVA, F(5, 391) = 394.3; data are shown as the mean ± SD; spots show the average in each mouse, n = 5 mice in each group). LY: mGluR2-3 antagonist LY341495. C Typical recordings show whisker stimulation (WS)-induced EPSP increases after agonist-induced astrocytic Ca2+ signaling at the barrel cortex in live mice. D Typical traces (in the inlet) and statistical analyses show the differences in whole-cell recorded EPSPs and LFP EPSPs (**, paired t-test, n = 8 mice; dots show the values in each mouse; data are shown as the mean ± SD in the bar graphs). E, F Statistical analysis of EPSP increases after astrocytic Ca2+ signaling induced by agonists (data are shown as the mean ± SD; **P < 0.01, one-way ANOVA was used, F(4,34) = 126.7. Spots show the averaged value of EPSPs in each mouse, n = 7 mice). Comparisons of the amplitude of EPSPs recorded with both whole-cell recordings (E) and LFP (local field potential) recordings (F) during sleep and waking states. G Analysis of membrane potential (MP) changes from in vivo whole-cell recordings showing membrane potential depolarization. Data are shown as the mean ± SD. *P < 0.05. H Analysis of the reliability of whisker stimulation-induced action potentials before and after Ca2+ signaling. Data are shown as the mean ± SD. **P < 0.01.
Fig. 4
Fig. 4. Small Ca2+ transients blocked sensory transmission.
A Typical recordings showing the differences in membrane potential (MP) during sleep and awake states. B Typical images showing a whole-cell recorded neuron (Alex 488 was dilated in intracellular solution) and images of astrocytes transfected with GCaMPf6. Scale bar = 20 µm. C Typical traces of whisker stimulation-induced EPSPs recorded with whole-cell recordings (Vm EPSPs) and local field recordings (LFP EPSPs) during the sleep state. D, E Comparisons of the amplitude of EPSPs recorded with whole-cell recordings (D) and LFP recordings (E) during sleep (**, one-way ANOVA, F (5, 47) = 27.68. Spots show the EPSP value in each mouse). The amplitude of EPSPs decreased after agonist-induced Ca2+ signaling compared with before (**P < 0.01, n = 8 mice; BF, before; AF, after). Data are shown as the mean ± SD.
Fig. 5
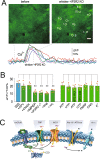
Fig. 5. Small Ca2+ transients during sleep are derived from multiple sources of Ca2+.
A Representative photomicrographs showing that whisker stimulation induced small Ca2+ transients in IP3R2 knockout mice, as illustrated by increased fluorescence intensity. The scale bar is 10 µm. The lower panel shows typical traces of Ca2+ transients. B Statistical data show the comparison of whisker stimulation-induced changes in Ca2+ transients with agonists and in IP3R2 knockout mice with different manipulations of blockers (**P < 0.001, one-way ANOVA, F (6, 232) = 54.57; spots show the averaged value in each mouse, n = 5 mice in each group, the data are shown as the mean ± SD). C A schematic diagram shows the intrinsic ion channels involved in the oscillation. Whisker stimulation-induced glutamate release from neurons affects astrocytes via mGluR (metabotropic glutamate receptor), and mGluR activates PLC (phospholipase C) to release IP3 (inositol trisphosphate) and DAG (diacylglycerol), which in turn activate TRP channels (transient receptor potential ion channels) and NCX (the Na+/Ca2+ exchanger) channels and thus Ca2+ influx. ATP, UTP, and FMRF in Mrg mice can also activate Gq receptors (G protein-coupled receptors) to activate PLC and release IP3 and DAG, thus inducing Ca2+ influx via TRP channels and NCX channels. Note: Kir4.1, an inwardly rectifying potassium (Kir) channel.
Fig. 6
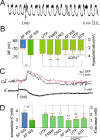
Fig. 6. Astrocytic Ca2+ transients enable glymphatic clearance of K+.
A Typical whole-cell recordings show that membrane potentials hyperpolarize after CNO-induced astrocytic Ca2+ transients. B Statistical analysis of whisker stimulation (WS) and agonist (UTP, FMRF, and CNO)-induced astrocytic Ca2+ transient-induced membrane hyperpolarization (**P < 0.01, the comparison between the left pair was done with paired t-test, n = 5; the comparison was done with one-way ANOVA among the other groups, F(5,29) = 9.407, P < 0.001; the spots show the value in each mouse, n = 5 in each group; the data are shown as the mean ± SD). C Typical traces show astrocytic Ca2+ transients and extracellular K+. D Statistical analysis of extracellular K+ changes due to whisker stimulation (WS) and agonist (UTP, FMRF, and CNO)-induced astrocytic Ca2+ transients (**P < 0.01, the comparison between the left pair was done with paired t-test, n = 5; the comparison was done with one-way ANOVA among the other groups, F(5,29) = 13.87, P < 0.001; the spots show the value in each mouse, n = 5 in each group, the data are shown as the mean ± SD).
Fig. 7
Fig. 7. A model shows the mechanisms of Ca2+ transients affecting EPSPs during sleep and waking states.
Left: During sleep, whisker stimulation induces glutamate release from neurons and activates mGluR (metabotropic glutamate receptor) and phospholipase C to release inositol trisphosphate (IP3) and diacylglycerol (DAG), which possibly open transient receptor potential ion channels (TRP channels) to obtain Ca2+ influx into astrocytes. The Ca2+ increase would in turn increase intracellular Na+, activating the Na+ pump to take up K+ and hyperpolarizing the neuron. Right: During waking states, norepinephrine (NE) activates G protein-coupled receptors (Gq receptors) that prime astrocytes and synergistically works with metabotropic glutamate (mGLu) to activate Gq receptors to release even more IP3, which induces Ca2+ release from the endoplasmic reticulum (ER) and gliotransmitter release (such as ATP, glutamate, or glutamine) and induces emotional arousal states. Note: Glu glutamine; NCX, the Na+/Ca2+ exchanger or the sodium-calcium exchanger.

References

    1. Ma Z, Stork T, Bergles DE, Freeman MR. Neuromodulators signal through astrocytes to alter neural circuit activity and behaviour. Nature. 2016;539:428–432. doi: 10.1038/nature20145. - DOI - PMC - PubMed
    1. Lezmy J, et al. Astrocyte Ca2+-evoked ATP release regulates myelinated axon excitability and conduction speed. Science. 2021;374:eabh2858. doi: 10.1126/science.abh2858. - DOI - PMC - PubMed
    1. Bojarskaite L, et al. Astrocytic Ca2+ signaling is reduced during sleep and is involved in the regulation of slow wave sleep. Nat. Commun. 2020;11:3240. doi: 10.1038/s41467-020-17062-2. - DOI - PMC - PubMed
    1. Tsunematsu T, Sakata S, Sanagi T, Tanaka KF, Matsui K. Region-specific and state-dependent astrocyte Ca2+ dynamics during the sleep-wake cycle in mice. J. Neurosci. 2021;41:5440–5452. doi: 10.1523/JNEUROSCI.2912-20.2021. - DOI - PMC - PubMed
    1. Kim JH, et al. Astrocytes in the ventrolateral preoptic area promote sleep. J. Neurosci. 2020;40:8994–9011. doi: 10.1523/JNEUROSCI.1486-20.2020. - DOI - PMC - PubMed

Publication types