. 2023 Dec;41(12):1734-1745.
doi: 10.1038/s41587-023-01713-y. Epub 2023 Apr 17.

Genetically encoded barcodes for correlative volume electron microscopy

Affiliations

Genetically encoded barcodes for correlative volume electron microscopy

Felix Sigmund et al. Nat Biotechnol. 2023 Dec.

Abstract

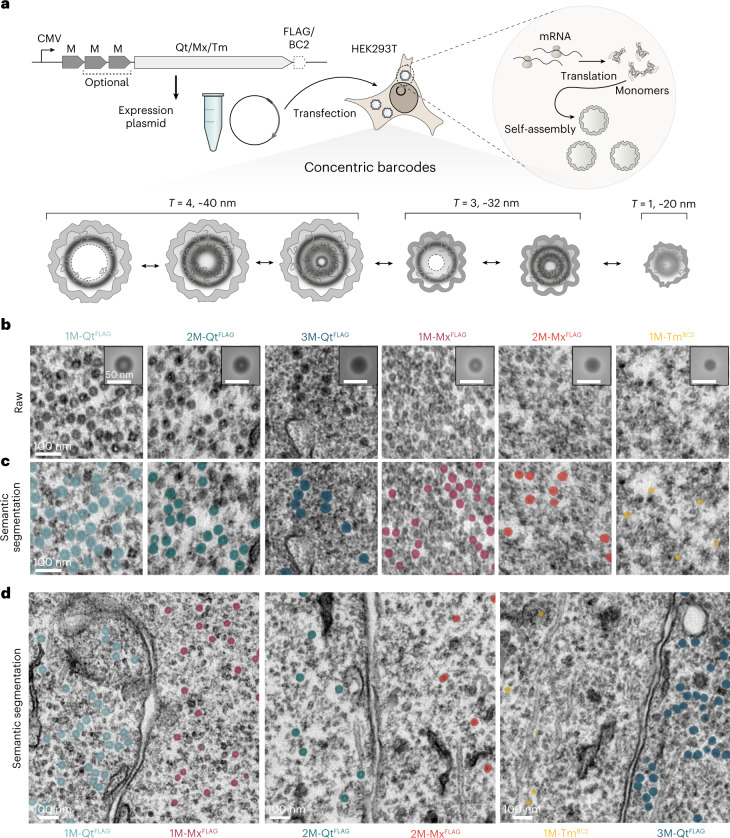
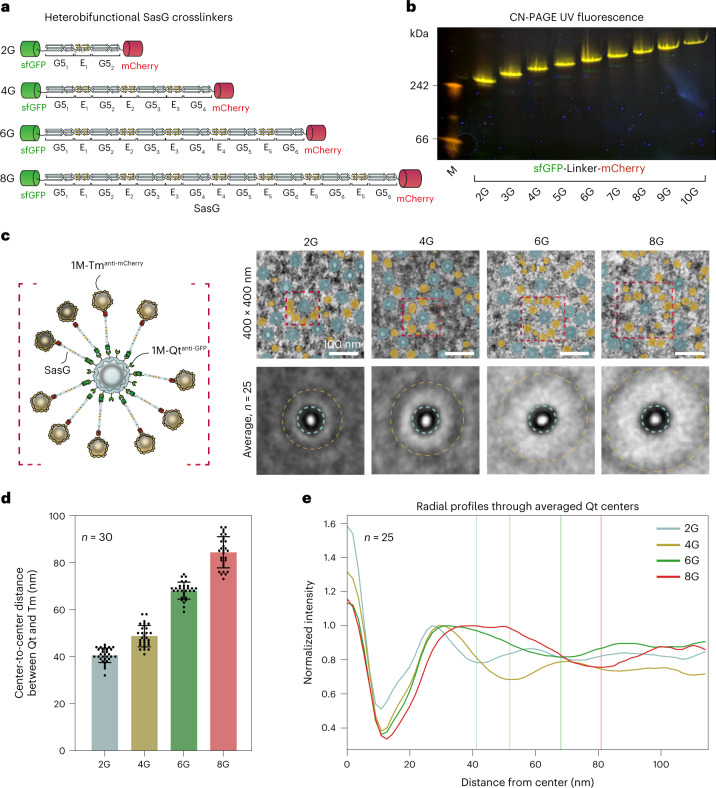
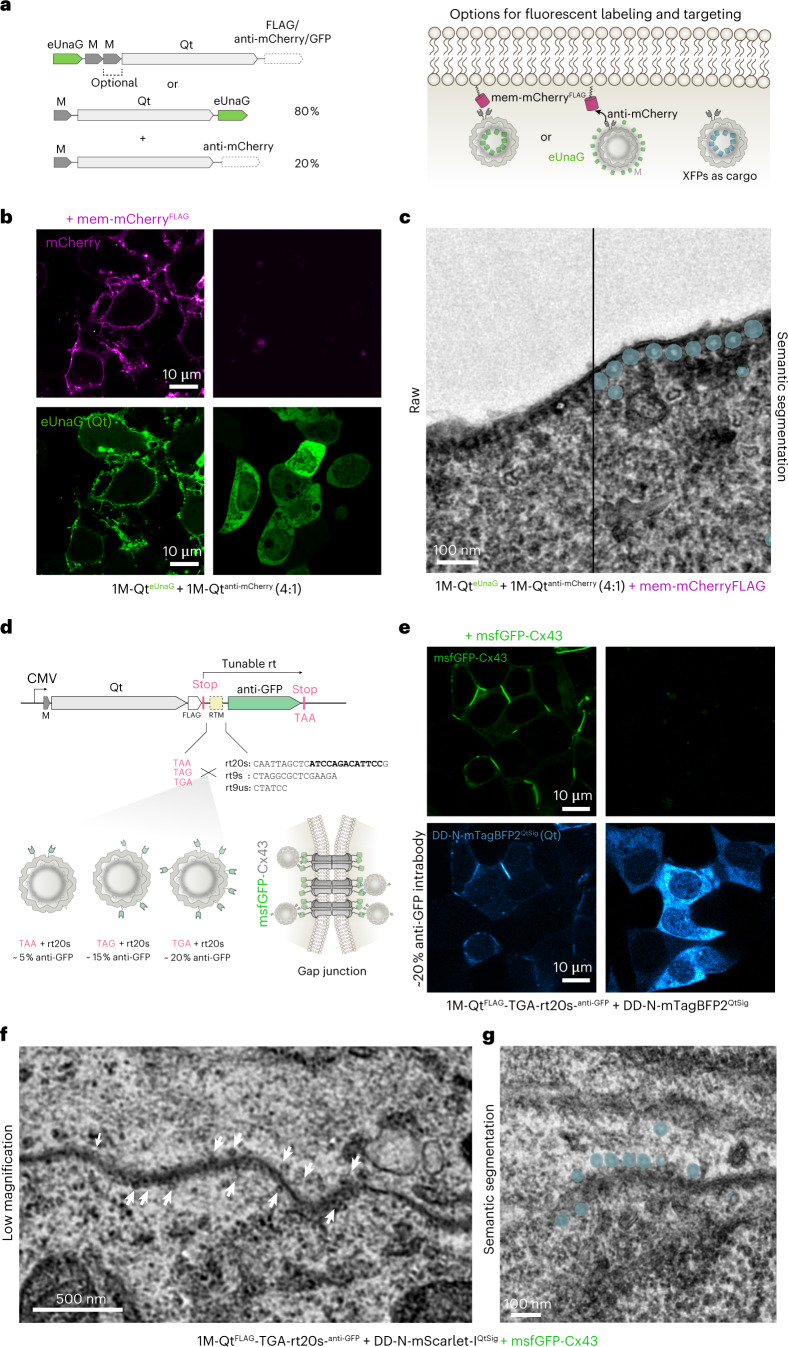
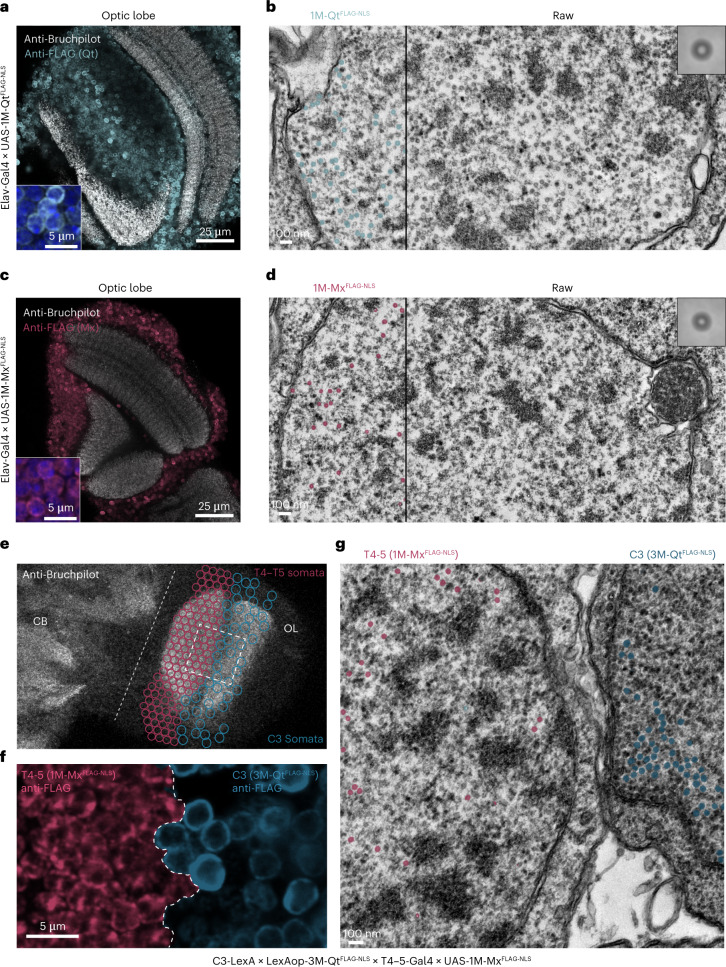
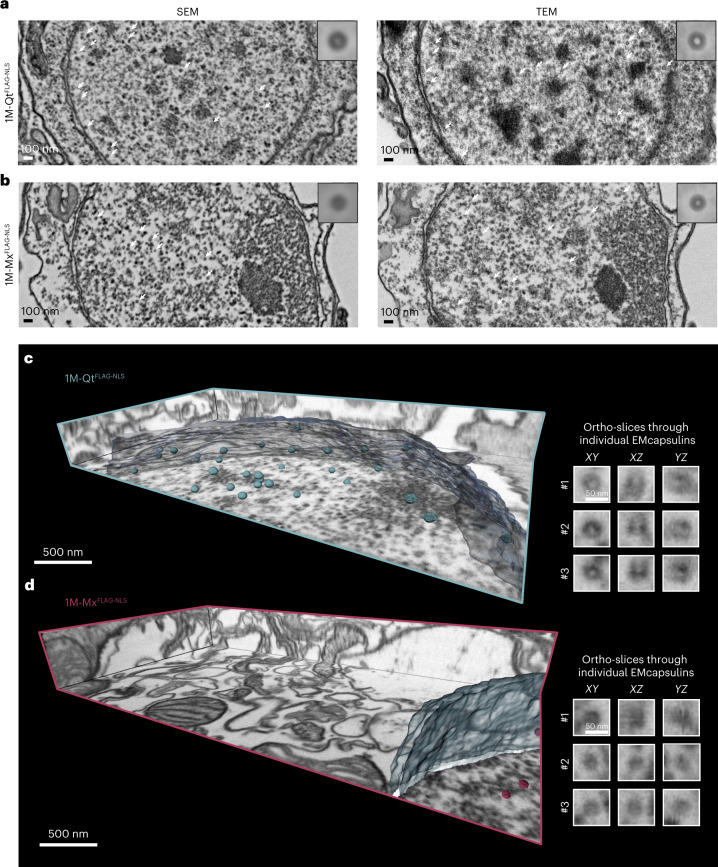
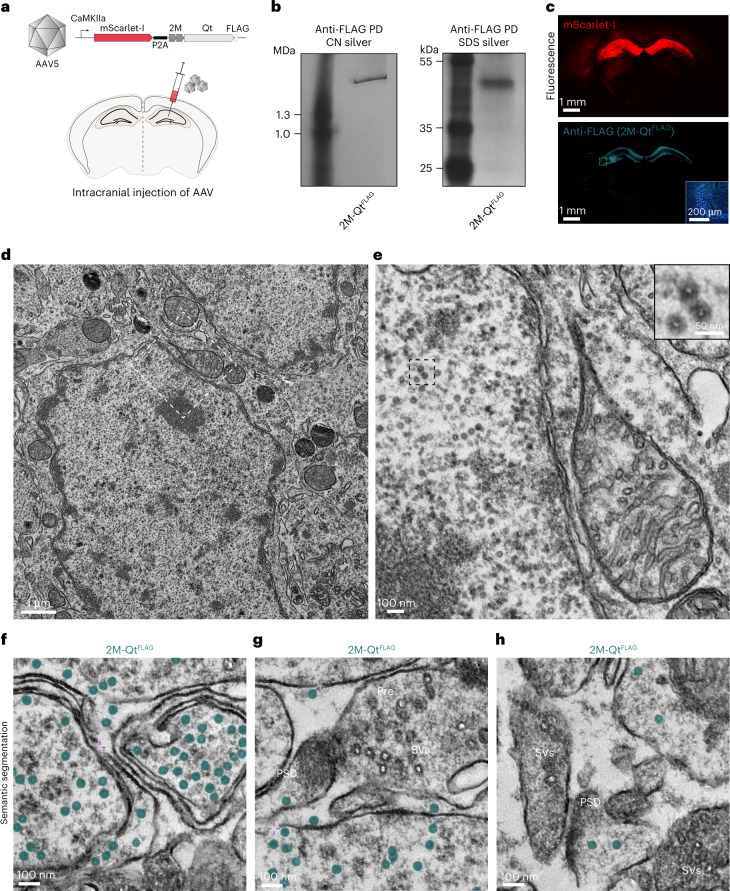
While genetically encoded reporters are common for fluorescence microscopy, equivalent multiplexable gene reporters for electron microscopy (EM) are still scarce. Here, by installing a variable number of fixation-stable metal-interacting moieties in the lumen of encapsulin nanocompartments of different sizes, we developed a suite of spherically symmetric and concentric barcodes (EMcapsulins) that are readable by standard EM techniques. Six classes of EMcapsulins could be automatically segmented and differentiated. The coding capacity was further increased by arranging several EMcapsulins into distinct patterns via a set of rigid spacers of variable length. Fluorescent EMcapsulins were expressed to monitor subcellular structures in light and EM. Neuronal expression in Drosophila and mouse brains enabled the automatic identification of genetically defined cells in EM. EMcapsulins are compatible with transmission EM, scanning EM and focused ion beam scanning EM. The expandable palette of genetically controlled EM-readable barcodes can augment anatomical EM images with multiplexed gene expression maps.


Conflict of interest statement

G.G.W., F.S., A.P. and O.B. have filed a patent application related to this paper. J.K. discloses financial interests in ariadne.ai. All other authors declare no competing interests.

Figures

Fig. 1
Fig. 1. EMcapsulins as fixation-resistant and heavy metal-interacting concentric EM barcodes.
a, Schematic of the mammalian expression of modular constructs coding for self-assembling encapsulin monomers with N-terminal fusions of metallothioneins (M) and C-terminal surface modifications for targeting (EMcapsulins). Expression of the EMcapsulin variants results in the auto-assembly of hollow protein nanospheres with different triangulation numbers (T), distinct diameters and one to three concatenated copies of M facing the lumen of the porous protein shells. b, TEM micrographs (8,000× magnification, 0.5525 pixels nm−1) after standard fixation and heavy metal staining EM protocol applied to HEK293T cells expressing the different EMcapsulin variants shown in a. Scale bars, 100 nm. Insets show averages of manually segmented image patches (n = 1,000 except n = 900 for 1M-TmBC2) for each condition (side length of insets: 89.2 nm (49 pixels); scale bar, 50 nm). c, Multiclass semantic segmentation from the end-to-end U-net architecture. d, Multiplexed detection of different EMcapsulin class combinations in adjacent HEK293T cells with overlaid semantic segmentation masks. Scale bars, 100 nm.
Fig. 2
Fig. 2. Modular EMcapsulin patterns.
a, A rigid heterobifunctional cross-linker was constructed from SasG capped off with sfGFP and mCherry. Different linker lengths were obtained by increasing the number of G5 domains connected by E domains (sfGFP-2G-mCherry up to sfGFP-10G-mCherry). b, CN PAGE under UV illumination loaded with lysates from HEK293T cells expressing sfGFP-SasG-mCherry heterobifunctional linkers (2–10G units) yielded discrete yellow fluorescent bands. c, Co-expression of 1M-Qtanti-GFP and 1M-Tmanti-mCherry with indicated SasG cross-linkers (2–8G units) resulted in distinct EMcapsulin patterns with ~40 nm ring-shaped centers from 1M-Qtanti-GFP surrounded by ~25 nm spherical objects (1M-Tmanti-mCherry) in TEM micrographs. The upper panel shows 400 × 400 nm exemplary regions showing the concentric, programmable EMcapsulin patterns with overlaid semantic segmentation results from the end-to-end network (8,000× magnification, 0.5525 pixels nm−1). Scale bars, 100 nm. The lower panel shows averages around selected Qt centers surrounded by a layer of Tm (n = 25). The bounding box has a side length 165 nm. d, Distances between the centers of 1M-Qtanti-GFP and the centers of surrounding 1M-Tmanti-mCherry for the indicated cross-linker lengths (n = 30); error bars, ±s.d. e, Average radial profile plots from the center of each 1M-Qtanti-GFP (n = 25) outwards via the cross-linkers towards the surrounding ring of 1M-Tmanti-mCherry color-coded for cross-linker length. The vertical lines represent contrast minima generated by the surrounding 1M-Tmanti-mCherry. Source data
Fig. 3
Fig. 3. Targetable fluorescent EMcapsulins as high-contrast labels for CLEM.
a, Targetable fluorescent EMcapsulins can be generated by N-terminally appending the small monomeric fluorescent protein (eUnaG) to 1M- and 2M-Qt, which harbor surface-exposed anti-mCherry intrabodies. Alternatively, EMcapsulin monomers fused to outward-facing eUnaG can be co-expressed with EMcapsulin monomers, a fraction of which can harbor an intrabody. b, Confocal laser scanning microscopy of fluorescent EMcapsulin composed of 1M-QteUnaG monomers co-expressed at a ratio of 4:1 with monomers harboring anti-mCherry intrabodies (1M-Qtanti-mCherry) with and without co-expression of membrane-bound mCherry (mem-mCherryFLAG). Scale bar, 10 µm. c, Corresponding TEM micrograph of mem-mCherry-targeted 1M-Qtanti-mCherry + 1M-Qtanti-mCherry (4:1). Scale bars, 100 nm. d, Control over the ratios of different EMcapsulin monomers can be achieved via tunable ribosomal rt cassettes encoded on a single cistron. To this end, different combinations of stop codons and short rt-promoting motifs are combined at the end of the ORF encoding 1M-Qt. In case rt occurs, the C-terminus of 1M-QtFLAG is further extended by an anti-GFP intrabody. e, Confocal fluorescence microscopy of HEK293T co-expressing the gap junction forming protein msfGFP-Cx43 together with the 1M-QtFLAG-TGA-rt20s-anti-GFP yielding ~20% anti-GFP intrabodies on the EMcapsulin surface. The EMcapsulins variants are also rendered fluorescent via co-expression of mTagBFP2 as cargo proteins harboring the Qt encapsulation signal (QtSig) and an N-terminal degron (DD-N), leading to the degradation of nonencapsulated fluorescent proteins. Scale bars, 10 µm. f,g, Corresponding TEM micrographs showing 1M-Qt (with ~20 % anti-GFP intrabody) particles labeling gap junctions (f), a low-magnification view (scale bar, 500 nm; white arrowheads point to 1M-QtFLAG EMcapsulins) and a higher-magnification view (scale bar, 100 nm) (g). Multiclass semantic segmentation results are shown color-coded in g, as defined in Fig. 1.
Fig. 4
Fig. 4. EMcapsulins as multichannel gene reporters in Drosophila neurons.
a,c, Overview fluorescence confocal microscopy images of the optic lobe (OL) of a Drosophila line with pan-neuronal expression of 1M-QtFLAG-NLS (a) or 1M-MxFLAG-NLS (c) harboring an NLS. FLAG epitopes on the exterior surface of EMcapsulins (anti-FLAG, cyan for 1M-QtFLAG-NLS and red for 1M-MxFLAG-NLS) are colocalized with nuclei (inset with DAPI in blue; scale bar, 5 µm), but do not exhibit cytoplasmic expression (anti-Bruchpilot, gray). Scale bar, 25 µm. b,d, Corresponding TEM micrographs with semantic segmentation maps as overlays. Scale bar, 100 nm. The insets show the average of the respective EMcapsulin class identified in the validation dataset (n = 132, bounding box: 89.2 × 89.2 nm). e, Overview fluorescence confocal microscopy image of the central brain (CB) and optic lobe (OL). f, Zoom-in to the Drosophila optic lobe containing both T4–T5 and C3 somata, expressing 1M-MxFLAG-NLS and 3M-QtFLAG-NLS EMcapsulins. g, Corresponding TEM micrograph with overlaid multiclass semantic segmentation masks color-coded as in Fig. 1. Scale bar, 100 nm.
Fig. 5
Fig. 5. EMcapsulin contrast in SEM and FIB-SEM of Drosophila neurons.
a,b, SEM and corresponding TEM micrographs of the identical sample from a Drosophila line with pan-neuronal expression of either 1M-QtFLAG-NLS (a) or 1M-MxFLAG-NLS (b) after a standard fixation and staining protocol. Ultrathin sections were captured either on TEM grids or on silica wafers for subsequent analysis by TEM and SEM (inverted contrast), allowing for the analysis of similar cuts through the identical cell with both techniques. SEM images were obtained from a Zeiss GeminiSEM with sense-BSD, Tandem Decel with 1.5 kV. Corresponding TEM images were acquired on a Zeiss Libra120 at 120 kV, 13 µA and 100 µrad. Insets show averages (n = 30) of the respective particle from manual segmentation. White arrowheads indicate the presence of EMcapsulin particles inside the nucleus. c,d, Isotropic FIB-SEM image volumes (4 nm voxel size) of Drosophila brains expressing 1M-QtFLAG-NLS (cyan) (c) and 1M-MxFLAG-NLS (red) (d) targeted to the nucleus. EMcapsulins and nuclear membranes were manually segmented and rendered within the FIB-SEM volume bounded by the ortho-slices. The magnifications (right) show ortho-slices through three EMcapsulins. Volume acquisition was performed with an SEM beam voltage of 1.3 kV and a working distance of 5 mm, at a nominal voxel size of 4 nm using an InLens detector. The FIB Ga beam was accelerated by 30 kV voltage at a current of 700 pA. Scale bars, 500 nm (overview) and 50 nm (zoom-ins). Please also see Supplementary Video 6.
Fig. 6
Fig. 6. EMcapsulin expression in mouse brain.
a, Schematic of the genetic construct for expressing 2M-QtFLAG together with mScarlet-I via AAV transduction and intracranial injection of AAVs into the hippocampus of a mouse. b, Native (CN) and corresponding SDS gels after silver staining confirming the assembly of 2M-QtFLAG after pull-down (PD) from the excised hippocampus. c, Confocal fluorescence imaging of a coronal section through the mouse brain 1 month after AAV transduction, showing direct mScarlet-I fluorescence in red and EMcapsulin expression in cyan (anti-FLAG, FITC). Scale bars, 1 mm and 200 µm (inset), respectively. The inset shows a zoomed-in region in the hippocampus. d,e, Overview TEM micrograph (d) and magnification of the region bounded via the white dashed lines in d (e). The inset shows a further zoom-in to the three EMcapsulins located inside the bounding box (black dashed lines). Scale bars for the respective magnifications are 1 μm, 100 nm and 50 nm. fh, Instances of EMcapsulins in neuronal processes. The overlaid semantic segmentations are color-coded as defined in Fig. 1. ‘⊹’ denotes membrane discontinuities. Scale bars, 100 nm.
Extended Data Fig. 1
Extended Data Fig. 1. Biochemical characterization and TEM analysis of the EMcapsulin classes.
a, Clear-Native (CN) PAGE analysis of lysates from HEK293T cells expressing six EMcapsulin variants (1M-QtFLAG, 2M-QtFLAG, 3M-QtFLAG, 1M-MxFLAG, 2M-MxFLAG, 1M-TmBC2) in comparison to wild-type encapsulin shells (QtFLAG, MxFLAG, (CC)-TmBC2) giving distinct high molecular weight bands corresponding to T=4, T=3, and T=1 icosahedral symmetries. Please note that the T=4 band corresponding to 3M-QtFLAG has a significantly decreased visibility. b, Corresponding silver-stained SDS-PAGE loaded with the same EMcapsulins as in a, pulled down with either anti-FLAG or anti-BC2 beads. The expected size shifts of the fusion proteins (1M-QtFLAG: 40.6 kDa, 2M-QtFLAG: 48.3 kDa, 3M-QtFLAG: 55.0 kDa, 1M-MxFLAG: 40.1 kDa, 2M-MxFLAG: 47.7 kDa, 1M-TmBC2: 39.4 kDa) were detected as compared with the wild-type encapsulins (QtFLAG: 33.4 kDa, MxFLAG: 31.9 kDa). c, Comparison of TEM micrographs from HEK293T cells expressing 1M-QtFLAG and wild-type QtFLAG. The insets show average intensity projections of 1000 particles. The scale bar is 100 nm, and the bounding box is 89.2 nm. d, Average radial profile plots (mean±SEM from 5 TEM images, with 50 segmented EMcapsulins per image) corresponding to c, showing the relative signal reduction in the lumen of 1M-QtFLAG as compared with wild-type QtFLAG encapsulin. Image intensities were normalized to the values of the surrounding cytosol. * indicates significantly different intensities at 9.85 nm from the center (P < 0.0001, two-tailed t-test). e, Sobel-filter applied on the average intensity projections from 5 TEM images, with 50 segmented EMcapsulins for each of the 6 EMcapsulin classes yielding mean diameters of 42.32 ± 1.44 nm for 1M-QtFLAG, 39.08 ± 1.44 nm for 2M-QtFLAG, 40.16 ± 0.72 nm for 3M-QtFLAG, 32.24 ± 1.35 nm for 1M-MxFLAG, 34.4 ± 1.61 nm for 2M-MxFLAG and 24.22 ± 1.44 nm for 1M-TmBC2 (mean±SEM). To determine diameters from Sobel-filter applied images, central line plots in x and y were averaged, and the distance between maxima corresponding to the edges was obtained for the five replicates. f, Average radial plot profiles of the 6 EMcapsulin classes (mean±SEM from 5 TEM images, with 50 segmented EMcapsulins per image). Source data
Extended Data Fig. 2
Extended Data Fig. 2. Results for multiplexed EMcapsulin detection by the sequential segmentation-classification pipeline.
a-d Examples of multiplexed detection of two different EMcapsulins classes in adjacent HEK293T cells color-coded as defined in Fig. 1. The scale bars represent 200 nm. e,f Multiplexed detection of 1M-QtFLAG-NES in the cytosol and 1M-MxFLAG-NLS in the nucleus within the same HEK293T cell, with overlays in e, generated by the sequential segmentation-classification pipeline and overlays in f, generated using the end-to-end multi-class semantic segmentation network as shown in Fig. 1. The scale bar represents 200 nm.
Extended Data Fig. 3
Extended Data Fig. 3. Additional linker lengths for generating EMcapsulin patterns.
a, TEM micrograph, and the average of the 0 G control condition (direct fusion of sfGFP and mCherry), which is also depicted in the schematic. The scale bar represents 100 nm. The bounding box showing the average projection represents 165 nm. The distance from Qt to Tm center is 32.83 ± 2.06 nm (mean±SD). b, Clear Native PAGE under UV illumination loaded with lysates of HEK293T expressing a direct fusion of sfGFP and mCherry (0 G) as a control, as well as 2G-5G SasG linkers. The redshift observed for the 0 G band is due to FRET between the closely linked sfGFP and mCherry. Source data
Extended Data Fig. 4
Extended Data Fig. 4. Characterization of targeted dual-mode fluorescent EMcapsulin variants.
a, Coomassie-stained Clear-Native PAGE loaded with lysates of HEK293T cells expressing dual-mode fluorescent EMcapsulin variants eUnaG-1M-QtFLAG, eUnaG-2M-QtFLAG or 1M-QteUnaG. b, Unstained UV-illuminated CN-PAGE shown in a. c, Silver-stained SDS PAGE after anti-FLAG pull-down from lysates of HEK293T co-expressing the combinations A, B, and C as specified in the figure. The relative DNA amounts of 1M-QtFLAG or Strep to 1M-Qtanti-mCherry were kept constant at 4:1. d, Densitometric analysis of the conditions A and C shown in c, giving the relative amounts of 1M-QtFLAG with respect to 1M-Qtanti-mCherry (set to 1) obtained from 3 biological replicates (with three technical replicates, mean±SD). Source data
Extended Data Fig. 5
Extended Data Fig. 5. Alternative variants of fluorescent, targetable EMcapsulins.
a, Genetic constructs and schematics of targetable EMcapsulins as alternative options to those shown in Fig. 3. Instead of a direct C-terminal fusion, intrabodies can also be covalently attached via SpyTag/SpyCatcher chemistry. Alternatively, EMcapsulins can be addressed to target proteins with bio-orthogonal coiled-coil (CC) pairs, enabling intracellular targeting. Instead of the direct N-terminal fusion of eUnaG, fluorescence is obtained here by mScarlet-I, which is degraded via a degron (DD) unless it is encapsulated to the encapsulin lumen via an encapsulation signal (QtSig). b, Exemplary confocal fluorescence microscopy images with the membrane target shown in green (EGFP-CAAX), except for the control in the first row and the respective targetable EMcapsulin variants loaded with mScarlet-I in magenta. Scale bars represent 20 µm. c, APEX2 co-expressed as cargo in Qt and Mx for optional DAB-polymerization as shown on Clear Native PAGE. The upper panel shows the Coomassie-stained gel with bands corresponding to the assembled nanocompartments, whereas the lower panel shows the same samples applied to a second gel incubated with DAB and hydrogen peroxide resulting in brown/black bands for the nanocompartments with polymerized DAB. Source data
Extended Data Fig. 6
Extended Data Fig. 6. Quantification of tunable translational read-through and Connexin 43 targeting.
a, Exemplary densitometric quantification of the fractional read-through via different combinations of stop codons and read-through motifs (related to main Fig. 3). Read-through resulted in the extension of the FLAG tag with an anti-GFP intrabody (higher molecular weight band). The heterotypic EMcapsulins were pulled down via the FLAG tag. Note that the exemplary SDS-PAGE shown here does not contain stop codon combinations with RT9us. The more complex band pattern in the case of TAG IntP2A indicates intein splice patterns. The lower band can be explained by correct splicing resulting in a 46.9 kDa band (Qtanti-GFP). The higher band can be explained by incorrect splicing, resulting in Qtanti-GFP fused to IntP2A with a size of 68.5 kDa. b, Percent read-through (rt) determined from densitometric analysis of the respective SDS-PAGE bands (QtFLAG-Linker-anti-GFP / Qt-total * 100), (The bars represent the mean±SD). c, Alternative labeling of Cx43 with C-terminal fusion of Cx43-msGFP (as opposed to N-terminal fusion as in Fig. 3e) and corresponding confocal fluorescence microscopy images. The EMcapsulins were made fluorescent via co-expression of mScarlet-I as cargo proteins. Scale bars represent 10 µm. d, Control condition for the experiment shown in Fig. 3e in which 100% of anti-GFP intrabody, that is, 240 copies were expressed per EMcapsulin, leading to an agglomeration of the msfGFP-Cx43 upon EMcapsulin binding. Scale bar is 10 µm. Source data
Extended Data Fig. 7
Extended Data Fig. 7. Additional TEM micrographs from EMcapsulins expressed in mouse hippocampus.
Overlayed semantic segmentation maps (color coded as defined in Fig. 1, and related to Fig. 6) for 2M-QtFLAG in neuronal processes and in the vicinity of synaptic vesicles (SV). The scale bars represent 100 nm. Please note that the misclassification of an SV as an EMcapsulin, as shown in sub-panel e is very rare. EMcapsulins are rounder than synaptic vesicles resulting in clear annular contrast with concentric round borders on both the outer and inner diameter. Synaptic vesicles, on the other hand, have quite variable shapes in their cross sections consistent with their flexible lipid membranes, resulting in non-concentric inner and outer contrast boundaries. In 4 test images of processes in the hippocampus containing 251 manually annotated SVs, only 1 was misclassified as an EMcapsulin. denotes membrane discontinuities. The scale bars represent 100 nm. f, Distribution of the areas of 2M-QtFLAG EMcapsulin particles and synaptic vesicles, n=100. 2M-QtFLAG: 457.5 ± 50.05 pixels, SVs: 523.0 ± 104.1 pixels (mean±SD). Source data

References

    1. Heinrich, L. et al. Whole-cell organelle segmentation in volume electron microscopy. Nature599, 141–146 (2021). - PubMed
    1. Xu, C. S. et al. An open-access volume electron microscopy atlas of whole cells and tissues. Nature599, 147–151 (2021). - PMC - PubMed
    1. Conrad, R. & Narayan, K. CEM500K, a large-scale heterogeneous unlabeled cellular electron microscopy image dataset for deep learning. eLife10, e65894 (2021). - PMC - PubMed
    1. Willingham, M. C. & Rutherford, A. V. The use of osmium-thiocarbohydrazide-osmium (OTO) and ferrocyanide-reduced osmium methods to enhance membrane contrast and preservation in cultured cells. J. Histochem. Cytochem.32, 455–460 (1984). - PubMed
    1. Seligman, A. M., Karnovsky, M. J., Wasserkrug, H. L. & Hanker, J. S. Nondroplet ultrastructural demonstration of cytochrome oxidase activity with a polymerizing osmiophilic reagent, diaminobenzidine (DAB). J. Cell Biol.38, 1–14 (1968). - PMC - PubMed

Publication types

LinkOut - more resources