

Phosphatidylinositol metabolism of the renal proximal tubule S3 segment is disturbed in response to diabetes
- PMID: 37069341
- PMCID: PMC10110589
- DOI: 10.1038/s41598-023-33442-2
Phosphatidylinositol metabolism of the renal proximal tubule S3 segment is disturbed in response to diabetes
Abstract
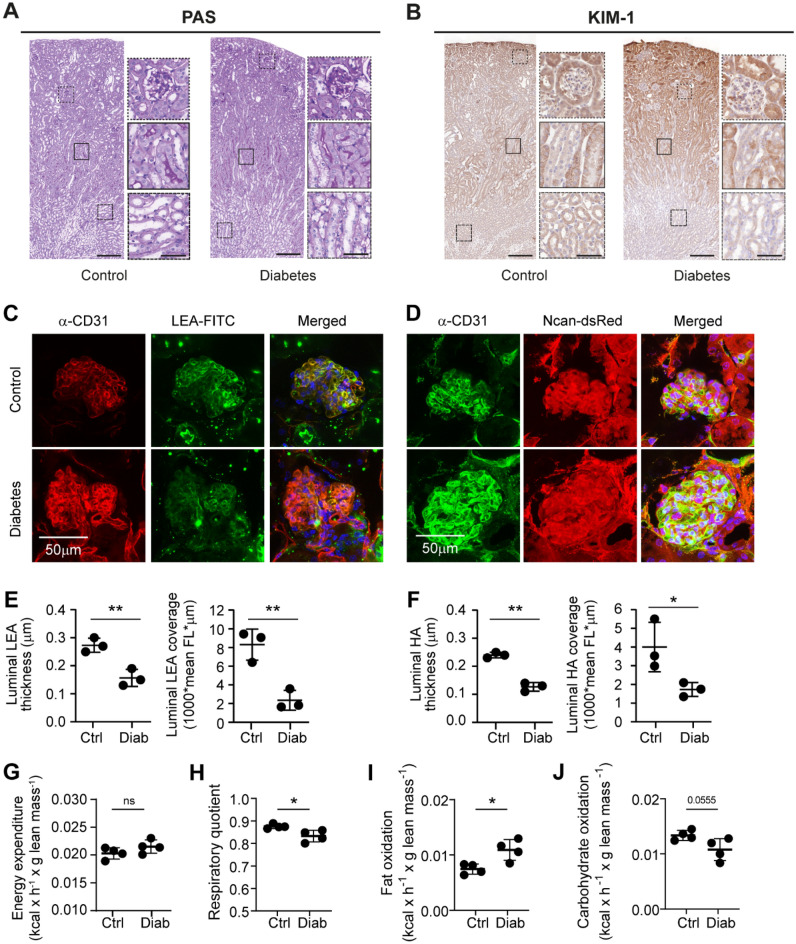
Diabetes is a main risk factor for kidney disease, causing diabetic nephropathy in close to half of all patients with diabetes. Metabolism has recently been identified to be decisive in cell fate decisions and repair. Here we used mass spectrometry imaging (MSI) to identify tissue specific metabolic dysregulation, in order to better understand early diabetes-induced metabolic changes of renal cell types. In our experimental diabetes mouse model, early glomerular glycocalyx barrier loss and systemic metabolic changes were observed. In addition, MSI targeted at small molecule metabolites and glycero(phospho)lipids exposed distinct changes upon diabetes in downstream nephron segments. Interestingly, the outer stripe of the outer medullar proximal tubular segment (PT_S3) demonstrated the most distinct response compared to other segments. Furthermore, phosphatidylinositol lipid metabolism was altered specifically in PT_S3, with one of the phosphatidylinositol fatty acid tails being exchanged from longer unsaturated fatty acids to shorter, more saturated fatty acids. In acute kidney injury, the PT_S3 segment and its metabolism are already recognized as important factors in kidney repair processes. The current study exposes early diabetes-induced changes in membrane lipid composition in this PT_S3 segment as a hitherto unrecognized culprit in the early renal response to diabetes.
© 2023. The Author(s).
Conflict of interest statement
The authors declare no competing interests.
Figures


Similar articles
-
Carbohydrate and lipid metabolism of the renal tubule in diabetes mellitus.Eur J Clin Chem Clin Biochem. 1992 Oct;30(10):669-74. Eur J Clin Chem Clin Biochem. 1992. PMID: 1493159 Review.
-
DESI-MSI and METASPACE indicates lipid abnormalities and altered mitochondrial membrane components in diabetic renal proximal tubules.Metabolomics. 2020 Jan 10;16(1):11. doi: 10.1007/s11306-020-1637-8. Metabolomics. 2020. PMID: 31925564 Free PMC article.
-
Primary proximal tubule hyperreabsorption and impaired tubular transport counterregulation determine glomerular hyperfiltration in diabetes: a modeling analysis.Am J Physiol Renal Physiol. 2017 May 1;312(5):F819-F835. doi: 10.1152/ajprenal.00497.2016. Epub 2017 Feb 1. Am J Physiol Renal Physiol. 2017. PMID: 28148531 Free PMC article.
-
Reducing lipid bilayer stress by monounsaturated fatty acids protects renal proximal tubules in diabetes.Elife. 2022 May 12;11:e74391. doi: 10.7554/eLife.74391. Elife. 2022. PMID: 35550039 Free PMC article.
-
Mitochondrial dysfunction in diabetic tubulopathy.Metabolism. 2022 Jun;131:155195. doi: 10.1016/j.metabol.2022.155195. Epub 2022 Mar 28. Metabolism. 2022. PMID: 35358497 Review.
Cited by
-
Application of spatial-omics to the classification of kidney biopsy samples in transplantation.Nat Rev Nephrol. 2024 Nov;20(11):755-766. doi: 10.1038/s41581-024-00861-x. Epub 2024 Jul 4. Nat Rev Nephrol. 2024. PMID: 38965417 Review.
-
Serum metabolic profiling in diabetic kidney disease patients using ultra-high performance liquid chromatography-tandem mass spectrometry.Diabetol Metab Syndr. 2025 Jun 7;17(1):197. doi: 10.1186/s13098-025-01780-y. Diabetol Metab Syndr. 2025. PMID: 40481496 Free PMC article.
-
Spatially resolved metabolomic dataset of distinct human kidney anatomic regions.Data Brief. 2024 Apr 16;54:110431. doi: 10.1016/j.dib.2024.110431. eCollection 2024 Jun. Data Brief. 2024. PMID: 38708307 Free PMC article.
-
Imaging and spatially resolved mass spectrometry applications in nephrology.Nat Rev Nephrol. 2025 Jun;21(6):399-416. doi: 10.1038/s41581-025-00946-1. Epub 2025 Mar 27. Nat Rev Nephrol. 2025. PMID: 40148534 Review.
-
Transcriptomic, epigenomic, and spatial metabolomic cell profiling redefines regional human kidney anatomy.Cell Metab. 2024 May 7;36(5):1105-1125.e10. doi: 10.1016/j.cmet.2024.02.015. Epub 2024 Mar 20. Cell Metab. 2024. PMID: 38513647 Free PMC article.
References
Publication types
MeSH terms
LinkOut - more resources
Full Text Sources
Medical
