Clinical Trial
. 2023 Apr;29(4):869-879.
doi: 10.1038/s41591-023-02273-z. Epub 2023 Apr 17.

Motixafortide and G-CSF to mobilize hematopoietic stem cells for autologous transplantation in multiple myeloma: a randomized phase 3 trial

Affiliations
Clinical Trial

Motixafortide and G-CSF to mobilize hematopoietic stem cells for autologous transplantation in multiple myeloma: a randomized phase 3 trial

Zachary D Crees et al. Nat Med. 2023 Apr.

Abstract

Autologous hematopoietic stem cell transplantation (ASCT) improves survival in multiple myeloma (MM). However, many individuals are unable to collect optimal CD34+ hematopoietic stem and progenitor cell (HSPC) numbers with granulocyte colony-stimulating factor (G-CSF) mobilization. Motixafortide is a novel cyclic-peptide CXCR4 inhibitor with extended in vivo activity. The GENESIS trial was a prospective, phase 3, double-blind, placebo-controlled, multicenter study with the objective of assessing the superiority of motixafortide + G-CSF over placebo + G-CSF to mobilize HSPCs for ASCT in MM. The primary endpoint was the proportion of patients collecting ≥6 × 10⁶ CD34+ cells kg-1 within two apheresis procedures; the secondary endpoint was to achieve this goal in one apheresis. A total of 122 adult patients with MM undergoing ASCT were enrolled at 18 sites across five countries and randomized (2:1) to motixafortide + G-CSF or placebo + G-CSF for HSPC mobilization. Motixafortide + G-CSF enabled 92.5% to successfully meet the primary endpoint versus 26.2% with placebo + G-CSF (odds ratio (OR) 53.3, 95% confidence interval (CI) 14.12-201.33, P < 0.0001). Motixafortide + G-CSF also enabled 88.8% to meet the secondary endpoint versus 9.5% with placebo + G-CSF (OR 118.0, 95% CI 25.36-549.35, P < 0.0001). Motixafortide + G-CSF was safe and well tolerated, with the most common treatment-emergent adverse events observed being transient, grade 1/2 injection site reactions (pain, 50%; erythema, 27.5%; pruritis, 21.3%). In conclusion, motixafortide + G-CSF mobilized significantly greater CD34+ HSPC numbers within two apheresis procedures versus placebo + G-CSF while preferentially mobilizing increased numbers of immunophenotypically and transcriptionally primitive HSPCs. Trial Registration: ClinicalTrials.gov , NCT03246529.


Conflict of interest statement

Z.D.C.: research funding, BioLineRx; M.P.R.: no competing interests. R.G.J.: consulting fees, WUGEN. K.S.-G.: research funding, BioLineRx, Caelum Biosciences, GlaxoSmithKline, GlycoMimetics, Ionis Pharmaceuticals, Janssen Pharmaceuticals, Millennium Pharmaceuticals (Takeda), Sanofi; equity stock/ownership, Abbott, AbbVie; consulting Fees, GlaxoSmithKline; board or advisory committee membership, GlaxoSmithKline; speaking fees, Janssen Pharmaceuticals; expert witness, Celgene. G.A.M., M.M., P.S.: no competing interests. I.A.: consulting fees and board or advisory committee membership, Janssen, Celgene, Novartis, Pfizer, Takeda, Roche. D.S: consulting fees, Janssen, AbbVie, Sanofi, GlaxoSmithKline, BristolMyersSquibb, Pfizer; board or advisory committee membership, Janssen, Sanofi, GlaxoSmithKline. D.P.: no competing interests. I.M.: research funding, BioLineRx. G.M.J.: no competing interests. G.M.: research funding, AbbVie, Janssen-Cilag; consulting fees, AbbVie, Amgen, Bristol-Myers-Squibb/Celgene, Janssen-Cilag, Krka, Novartis, Roche, Takeda. M.L.P.C.: no competing interests. U.H.: consulting fees, Sanofi-Adventis. J.H.: no competing interests. M.H.Q.: research funding, Janssen Pharmaceuticals, BioLineRx, Angiocrrine, Neximmune. N.H.: board or advisory committee membership, Incyte, Kite/Gilead, American Gene Technologies. T.L., I.G.-C.: no competing interests. A.V.-H., E.S., I.G.-K., I.G., D.I., L.S.-D.: employment, BioLineRx. S.K., F.G.: no competing interests. M.A.S.: research funding, Incyte, Cellect, Inc., Equillium, Inc., Fortis, Seattle Genetics, Amgen, Celgene, PBD, Inc., Sanofi Genzyme, Janssen; consulting fees and board or advisory committee membership, Advarra, Amgen, Astellas, CareDx, Dova pharmaceuticals, Equillium, Inc., FlatIron, Inc., GlaxoSmithKline, Gilead Sciences, Inc., Incyte, Inmagene Bio, Janssen, Novo Nordisk, Partners Therapeutics, Pfizer, Sanofi Genzyme, StemLine. R.V.: no competing interests. J.F.D.: equity stock/ownership, Magenta Therapeutics, WUGEN; consulting fees, Incyte, RiverVest Venture Partners; board or advisory committee membership, Cellworks Group, RiverVest Venture Partners, Magenta; research funding, Amphivena Therapeutics, NeoImmune Tech, Macrogenics, Incyte, BioLineRx, WUGEN; speaking fees, Incyte; patents (nos. PCT/US2019/035010 and PCT/US2019/035052), WUGEN, Magenta.

Figures

Fig. 1
Fig. 1. GENESIS trial enrollment.
a, A total of 162 patients signed informed consent (IC). Screen failures were due to patients not meeting study eligibility criteria; 124 patients began G-CSF mobilization, two elected to withdraw consent before randomization, leaving a total of 122 patients who were randomized (2:1) to either motixafortide + G-CSF or placebo + G-CSF and were included in the ITT analysis. In the motixafortide + G-CSF arm, one patient did not perform apheresis due to an adverse event unrelated to study drug. In the placebo + G-CSF arm, one patient elected not to undergo apheresis due to personal concerns regarding the COVID-19 pandemic. Both these patients were included as mobilization failures in the ITT analysis (that is, did not meet the primary endpoint) but were not remobilized on study. In total, 98.8% (79 of 80) of patients in the motixafortide + G-CSF arm and 97.6% (41 of 42) of patients in the placebo + G-CSF arm received all study-related mobilization injections and underwent apheresis on protocol without any events of treatment arm crossover. b, Patients were enrolled across 18 centers and five countries, with the majority treated in the United States. c, Enrollment numbers are presented by individual study center, grouped by geographic region (United States and Europe) and mobilization regimen (motixafortide + G-CSF or placebo + G-CSF), with the proportion of patients at each site meeting the primary endpoint (collection of ≥6 × 106 CD34+ cells kg–1 within two apheresis days) shown in red and the proportion not meeting the primary endpoint shown in black.
Fig. 2
Fig. 2. GENESIS trial efficacy.
a,b, Patients with MM were mobilized with either motixafortide + G-CSF or placebo + G-CSF with the goal of collecting ≥6 × 106 CD34+ cells kg–1. a, The proportion of patients meeting the primary endpoint of collecting to goal within two apheresis days and the key secondary endpoint of collecting to goal in one apheresis day are shown, along with collection rates after three and four apheresis procedures. No patients in the motixafortide + G-CSF arm underwent a fourth apheresis on protocol. The primary endpoint and prespecified secondary efficacy endpoint were analyzed using the CMH test and are presented as OR with two-sided 95% CIs and P values. b, The numbers of PB CD34+ cells μl–1 in each cohort are presented by mobilization day with standard box and whisker plots, where the measure of center is the median value for PB CD34+ cells μl–1 with the exact median value of CD34+ cells μl–1 noted below the x axis by day and cohort; the box represents the interquartile range and lines represent the minimum/maximum (±1.5 × interquartile range). Each patient contributed a single biologically independent sample examined over one independent experiment per sample/patient. Total sample counts associated with motixafortide + G-CSF were: day 0 (n = 80), day 4 (n = 80), day 5 (n = 80), day 6 (n = 11), day 7 (n = 6) and day 8 (n = 0). Total sample counts associated with placebo + G-CSF were: day 0 (n = 39), day 4 (n = 40), day 5 (n = 39), day 6 (n = 32), day 7 (n = 27) and day 8 (n = 17).
Fig. 3
Fig. 3. Immunophenotyping with percentages and quantitation of CD34+ HSPC subsets.
ac, CD34+ HSPCs from day 1 apheresis products, collected following treatment of patients with MM with G-CSF plus either placebo, plerixafor or motixafortide, were purified by immunomagnetic selection and evaluated by multicolor FACS. Each patient (n = 51) contributed a single biologically independent sample examined over one independent experiment per sample/patient. a, t-Distributed stochastic neighbor-embedding (t-SNE) projection of merged flow cytometry file showing nine HSPC subsets based on defined cell surface markers. b, Percentage of CD34+ cells within each HSPC subset is shown for patients with MM treated with G-CSF plus either placebo (n = 13), plerixafor (n = 14) or motixafortide (n = 24). c, Absolute numbers (Abs. no.) of each HSPC subset are shown for patients with MM treated with G-CSF plus either placebo (n = 12), plerixafor (n = 12) or motixafortide (n = 24). b,c, Data presented as mean ± s.d. Mean HSPC subset yields were compared using ANOVA followed by a post hoc Tukey–Kramer test for pairwise comparisons among groups. Exact two-sided P values for significant differences are listed.
Fig. 4
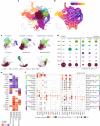
Fig. 4. Single-cell transcriptional profiling and trajectory mapping of CD34+ HSPCs with differentially expressed gene subanalysis of HSC1–6 and MLP populations.
a, UMAP plot of annotated single-cell clusters across entire cohort. Cells colored by abbreviations of each transcriptional annotation as defined. b, UMAP plot of single-cell clusters with Monocle3 trajectory mapping overlayed and colored by pseudotime. Overlayed trajectory indicates transitions between distinct transcriptional states. Pseudotime is a measure of progress along the overlayed trajectory, with the white spot labeled ‘1’ indicating the earliest state on the transcriptional path. c, UMAP of early progenitor populations (HSC1–6, MLP) across each cohort and mobilization regimen, with each cell colored by cell-type annotation and separated by mobilization regimen and cohort (M, multiple myeloma; H, healthy allo-donor). d, Average cell-type proportions across each sample within each treatment group and cohort. Spot size indicates relative average expression, with the exact value overlayed. e, Highlighted genes found to be differentially expressed between early progenitor populations in the healthy allo-donor cohort across the listed mobilization regimens. Each column represents a different DEG analysis between the two groups, and values for each DEG listed show the average log2(fold change (FC)) in the first cohort relative to the second cohort in each column. Each element in heatmap is colored by average log2(FC), with red and blue denoting increased and decreased expression, respectively. f, Expression of a subset of DEGs and genes (from the literature) across stem cell and early progenitor clusters. Each spot is colored by average expression, its size indicating total number of cells expressing the gene of interest in the mobilization regimen and cohort labeled.
Extended Data Fig. 1
Extended Data Fig. 1. Mobilization and Apheresis Schema.
All patients underwent HSPC mobilization and collection on days 1–5 (and days 6–8, if needed). In the AM of days 1–5 (and days 6–8, if needed), all patients received G-CSF (10 mcg/kg) via subcutaneous injection indicated by the syringe in blue. (a) GENESIS Trial: In addition to G-CSF, in the PM of day 4 (and day 6, if needed), patients received either motixafortide (1.25 mg/kg) or placebo via subcutaneous injection indicated by the syringe in green. All patients began apheresis (4 blood volumes) on day 5 (and days 6–8, if needed) with the goal of collecting ≥6 × 106 CD34+ cells/kg. Patients collecting to goal completed mobilization. (b) Correlative Study: A contemporaneous, cohort of demographically similar MM patients were prospectively enrolled on a parallel protocol and mobilized with G-CSF, as above, plus plerixafor (0.24 mg/kg) via subcutaneous injection on the PM of day 4 (and day 5–7, if needed) indicated by the syringe in yellow. All patients received plerixafor in addition to G-CSF, regardless of PB CD34+ cell count prior to apheresis. All patients began apheresis on day 5 (and days 6–8, if needed) with the goal of collecting sufficient CD34+ cells for ASCT, per institutional practice.
Extended Data Fig. 2
Extended Data Fig. 2. Pre-specified Principal and Sensitivity Analyses of the Primary Endpoint.
Local and central lab CD34+ HSPC assessments of the apheresis product from each patient were analyzed for the primary endpoint using Cochran-Mantel-Haenszel (CMH) weights on an intent-to-treat (ITT) basis using N = 122 biologically independent samples examined over 1 experiment/sample. In addition, a pre-specified sensitivity analysis was performed on a modified intent-to-treat (mITT) basis using N = 120 biologically independent samples examined over 1 experiment/sample and on a per protocol (PP) basis using N = 76 biologically independent samples examined over 1 experiment/sample. The data are presented as CMH common proportions differences for each analysis with 2-sided 95% confidence intervals (CI) indicated by the error bars. Mixed* analyses accounted for missing central lab values by replacing them with non-missing local lab values. Logistic regression (LR**), multiple imputation missing not at random (MI MNAR) and missing at random (MI MAR) analyses were also performed.
Extended Data Fig. 3
Extended Data Fig. 3. Flow Cytometry Gating Strategy.
CD34+ HSPCs from day 1 apheresis products collected following treatment of patients with MM with G-CSF plus either placebo, plerixafor or motixafortide were purified by immunomagnetic selection and evaluated by multicolor FACS. Gating strategy used to define nine different CD34+ HSPC subsets is shown.
Extended Data Fig. 4
Extended Data Fig. 4. CXCR4 Expression on CD34+ HSPC Subsets from Day 1 of Apheresis.
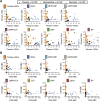
CD34+ HSPCs from day 1 apheresis products collected following treatment of patients with MM with G-CSF and either placebo (n = 12), plerixafor (n = 12) or motixafortide (n = 24) were purified by immunomagnetic selection and evaluated by flow cytometry. The expression of CXCR4 was determined by flow cytometry using anti-CXCR4 mAb clones 12G5 and 1D9. (A) Percent of HSPC subsets positive for 12G5+ and 1D9+ antibodies. (B) Mean Fluorescence Intensity (MFI) of antibody binding capacity (ABC) of 12G5 and 1D9 on HSPC subsets.
Extended Data Fig. 5
Extended Data Fig. 5. Engraftment Kinetics by Total CD34+ HSPCs Infused and by Specific CD34+ HSPCs Subsets Infused.
Pearson correlation with green line representing the regression curve and the shaded green area representing the 2-sided 95% CI presented with respective p-values. All statistical analyses were 2-sided. (a) time to platelet engraftment in days by total CD34+ HSPCs infused, (b) time to neutrophil engraftment in days by total CD34+ HSPCs infused, (c) time to platelet engraftment in days by total combined HSC, MPP, CMP and GMP CD34+ subset HSPCs infused and (d) time to platelet engraftment in days by total GMP CD34+ subset HSPCs infused. Each motixafortide+G-CSF patient indicated by circles and each placebo+G-CSF patient indicated by triangles.
Extended Data Fig. 6
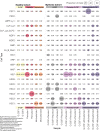
Extended Data Fig. 6. Gene Markers for CD34+ Cell Type Assignments.
Cell type markers from the literature used to annotate single-cell clusters. Dot plot shows the average expression of each gene for each cell-type population and size shows the percent of cells expressing that gene of interest.
Extended Data Fig. 7
Extended Data Fig. 7. Transcriptionally Defined HSPC Subsets with Distribution by Cohort and Mobilization Regimen.
Average cell-type proportions of each transcriptionally defined HSPC subset annotated by sample. Samples are grouped by mobilization regimen and cohort.
Extended Data Fig. 8
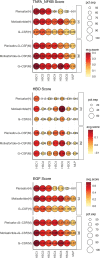
Extended Data Fig. 8. TNFα/NFκB, EGF and HBO1 (KAT7) Gene Scores.
For three different pathways a list of genes was curated, derived from GSEA and the literature, to evaluate changes in expression of related pathways (Methods). Each Gene Score dot plot shows the average gene expression score indicated by heat map color and overlayed with the numerical score. Dot size indicates the percentage of cells expressing each transcriptional program. Each plot is also separated by mobilization regimen (left axis); by multiple myeloma (M) and healthy allo-donor cohorts (H) (right axis); and by the HSC1-6 or MLP population of interest (bottom axis).

Similar articles

Cited by

References

    1. Raab MS, Podar K, Breitkreutz I, Richardson PG, Anderson KC. Multiple myeloma. Lancet. 2009;374:324–339. doi: 10.1016/S0140-6736(09)60221-X. - DOI - PubMed
    1. Kumar SK, et al. Improved survival in multiple myeloma and the impact of novel therapies. Blood. 2008;111:2516–2520. doi: 10.1182/blood-2007-10-116129. - DOI - PMC - PubMed
    1. Palumbo A, Anderson K. Multiple myeloma. N. Engl. J. Med. 2011;364:1046–1060. doi: 10.1056/NEJMra1011442. - DOI - PubMed
    1. Child JA, et al. High-dose chemotherapy with hematopoietic stem-cell rescue for multiple myeloma. N. Engl. J. Med. 2003;348:1875–1883. doi: 10.1056/NEJMoa022340. - DOI - PubMed
    1. Fermand JP, et al. High-dose therapy and autologous blood stem-cell transplantation compared with conventional treatment in myeloma patients aged 55 to 65 years: long-term results of a randomized control trial from the Group Myelome-Autogreffe. J. Clin. Oncol. 2005;23:9227–9233. doi: 10.1200/JCO.2005.03.0551. - DOI - PubMed

Publication types

MeSH terms

Associated data